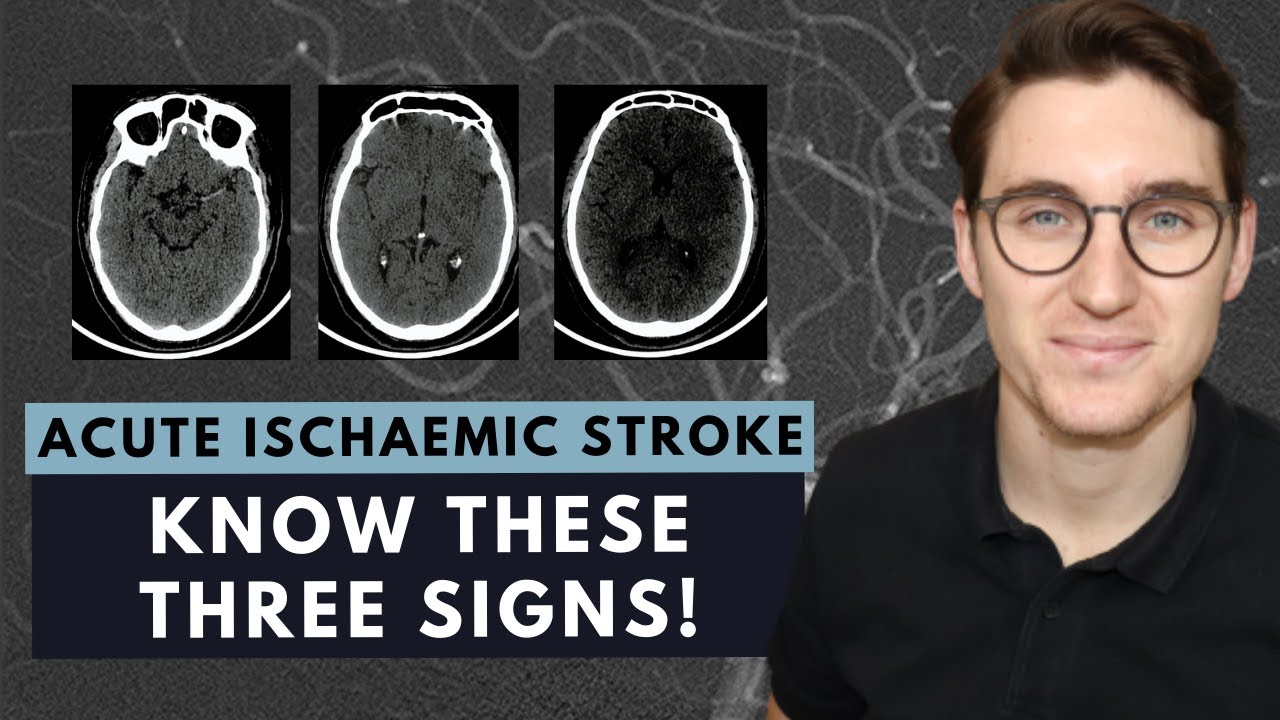
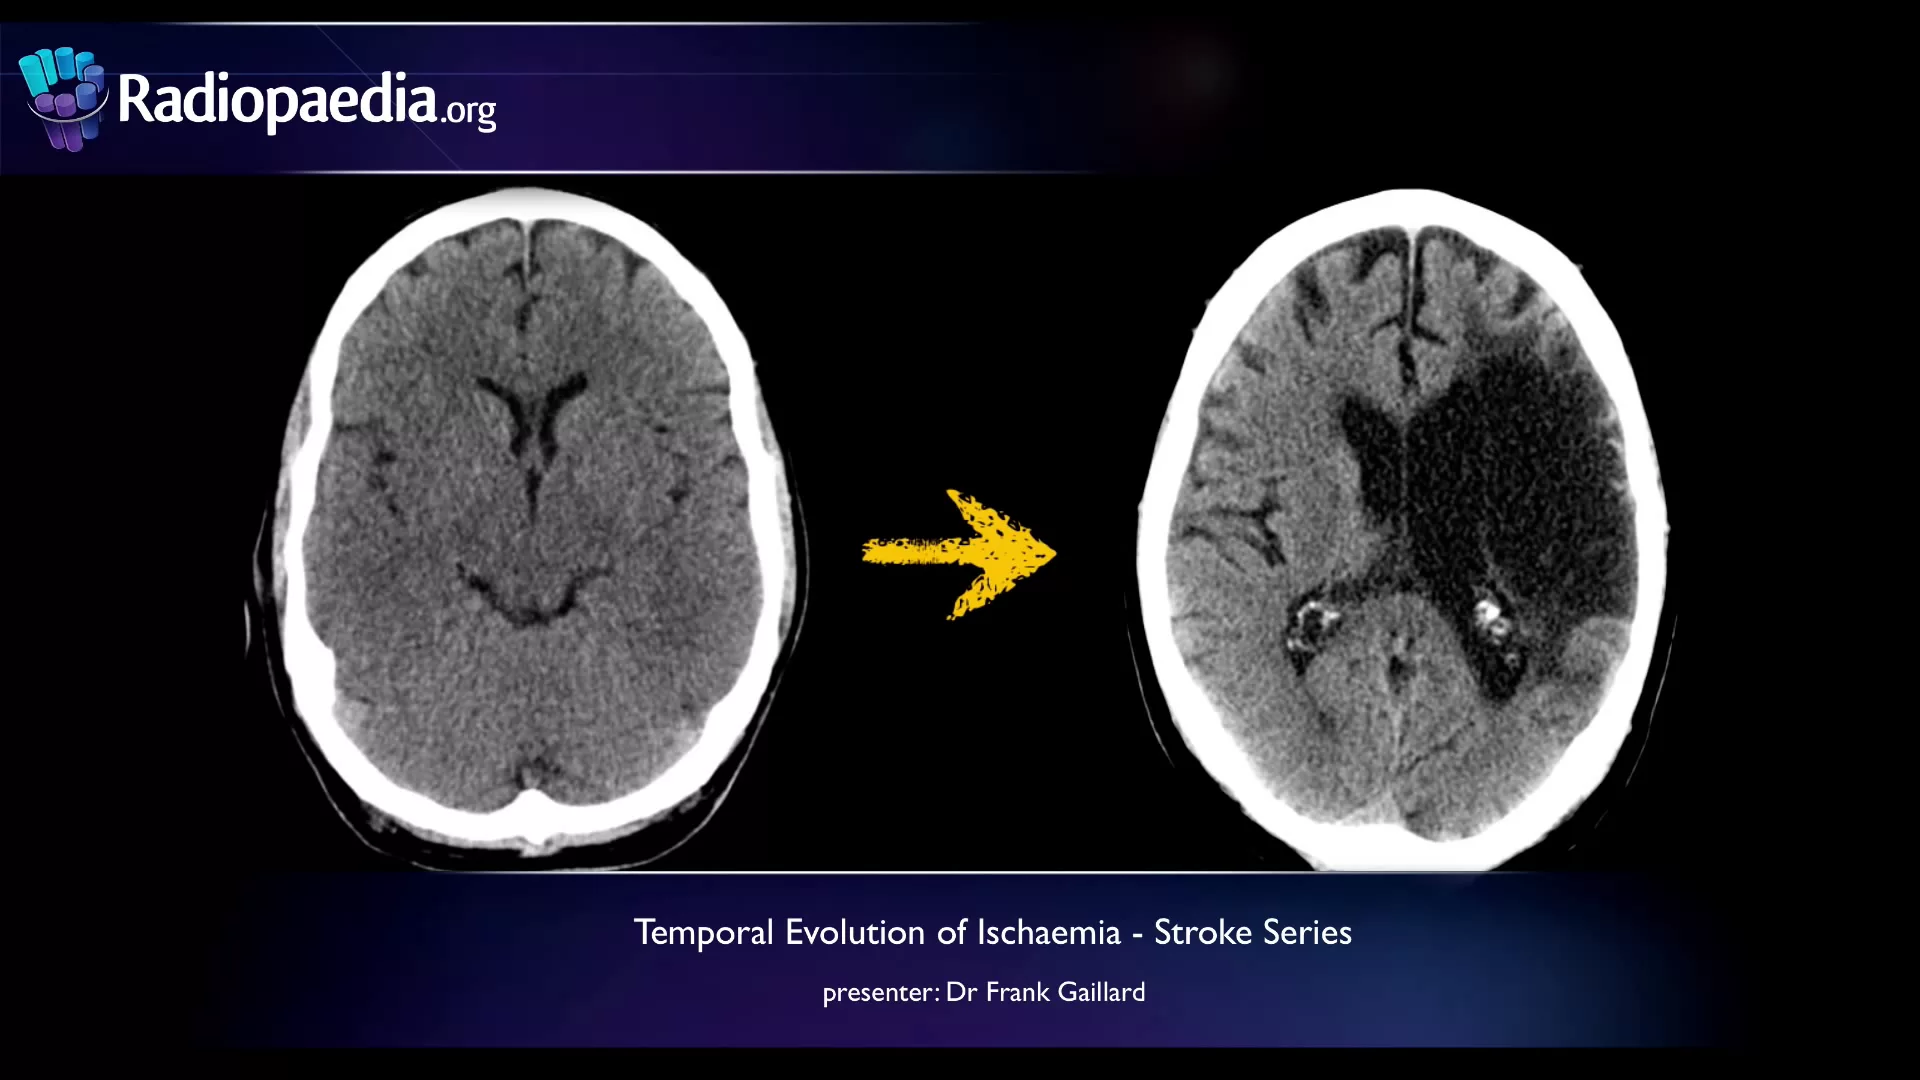
hello this is Frank aland from r.org and today in the fourth part of our series on Imaging of stroke we'll be having a look at the temporal evolution of esic Strokes before we start let's have a look at three cases which of these do you think demonstrates the features of a chronic infarct by the end of this video the answer should hopefully be obvious as we saw in our previous episode the earliest visible sign is direct visualization of thromboembolism seen here as a hyperdense middle cereal artery at this early stage one struggles to make out
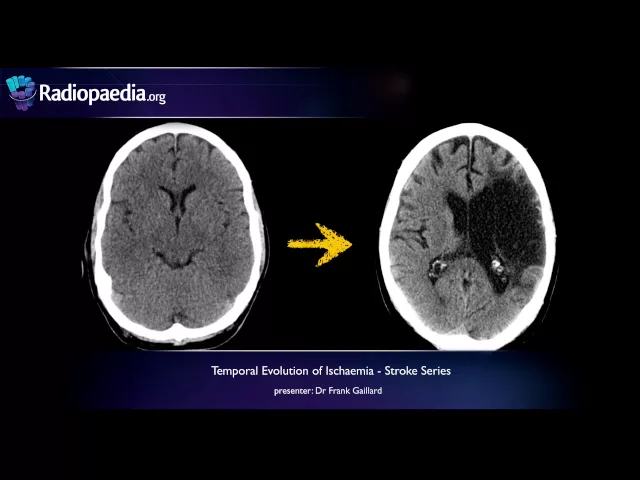
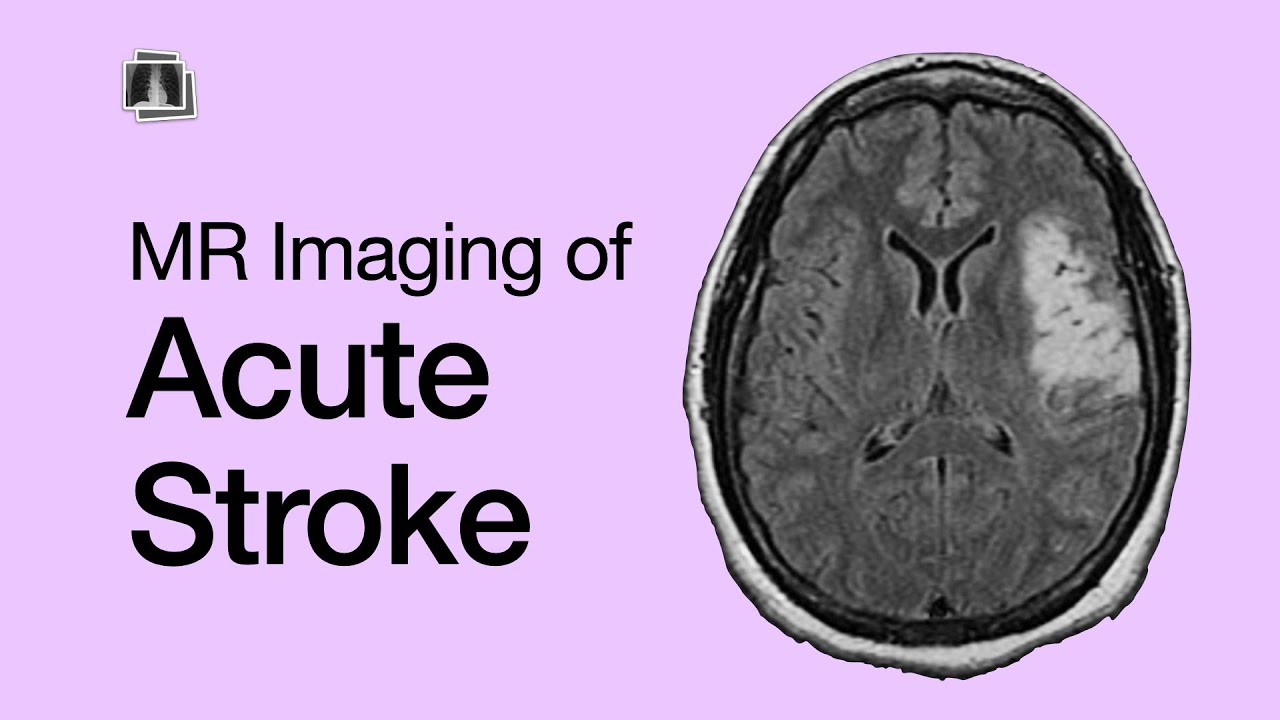
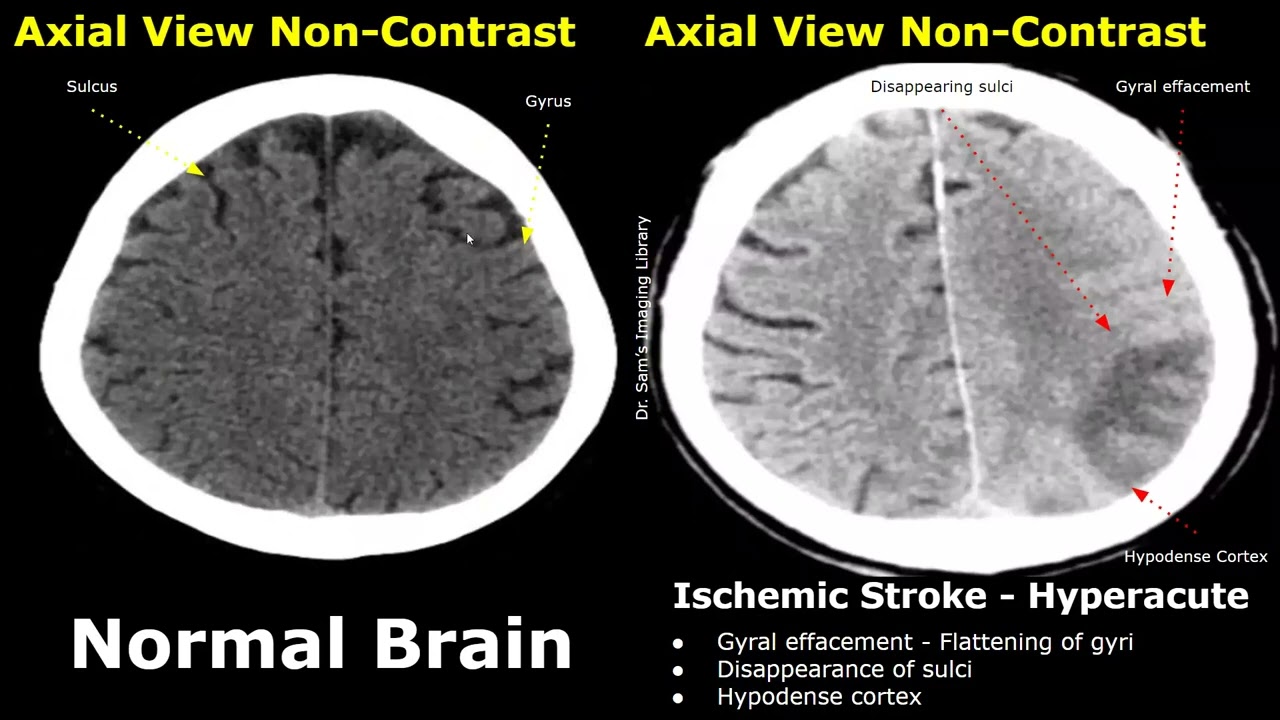
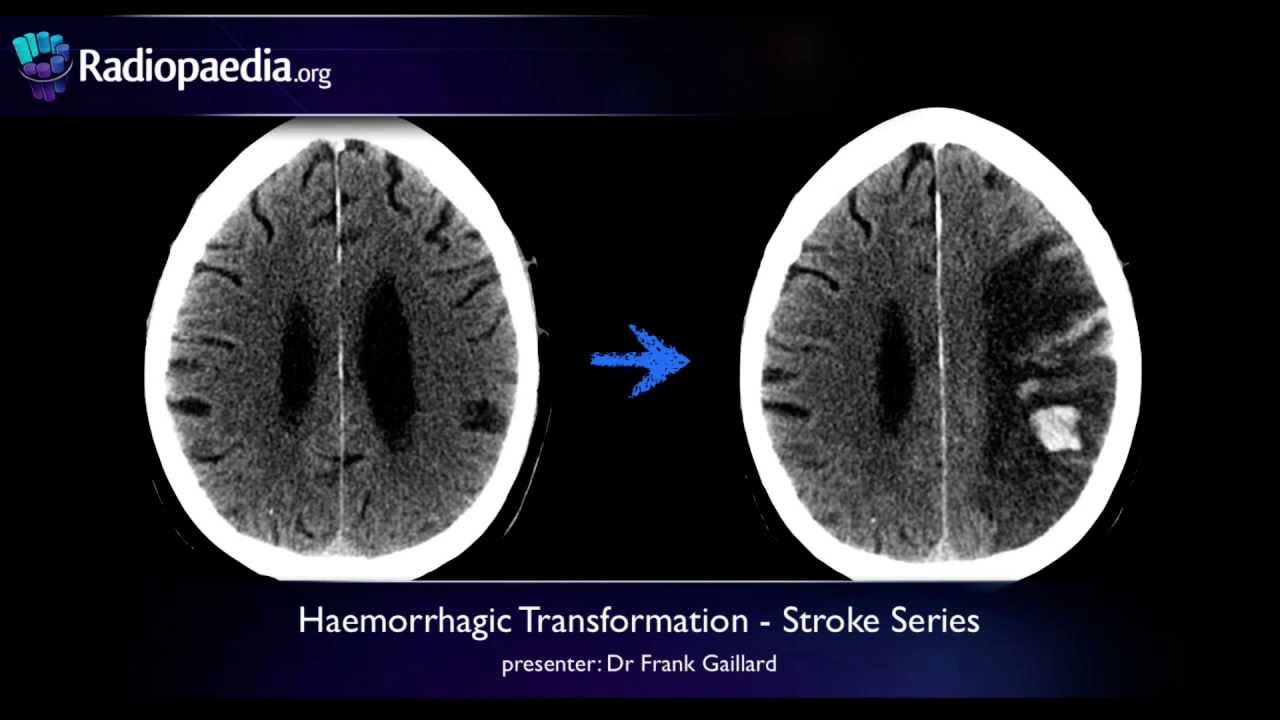
even the earliest of penal changes perhaps with the eyeth faith there is slight blurring and loss of gray white matter interace of the lentiform nucleus and the insell cortex if one were to perform an MRI Vivid restricted diffusion bright on DWI with corresponding low signal on ADC would be seen as in this scan from another patient going back to our previous patient over the next couple of days the infar becomes easily visible as a region of well demarcated low attenuation in this case with some areas of small hemorrhagic transformation this is associated with swelling as
extracellular and intracellular fluid accumulates this is due to Cellular swelling and breakdown of the bloodb brain barrier there is corresponding positive Mass Effect maximal swelling occurs during the first week typically maximal at day three or so in this case swelling is so severe that a decompressive craniectomy is performed to try and alleviate raised intracranial pressure and herniation with time swelling starts to recede as seen here on this day 11 scan note also how the reduced edema and Associated influx of inflammatory cells histologically the density of the infact increases this increase in density and reduction in
swelling can in some patients almost exactly mimic normal brain during the second or third week following infarction as is seen in this patient where the left-sided infarcts appear to vanish this phenomenon is called fogging and is the focus of our next video note however that just because it appears normal on CT does not mean the stroke has resolved administration of contrast either with CT or in this case MRI easily demonstrates the region due to persistent breakdown of the blood brain barrier resulting in leakage of contrast into the infacted tissues this is visualized as a region
of gyroor cortical enhancement continued volume loss results in negative Mass Effect on the surrounding brain seen here as ex vacu dation of the lateral ventricle and continued decrease in the density approaching that of CSF after a number of months little change will occur with the region appearing as a focal loss of tissue sometimes leaving a vague ghost of the previous gyal pattern as seen in this patient who had an infa a number of years earlier note how all cereal tissue in the region is lost replaced by fluid as demonstrated here following CSF on all sequences
including diffusion weighted Imaging and ADC Maps so if we go back and put all these CT images together we can see a general pattern of evolution the earliest peral changes seen even a few hours after onset of eskia is subtle loss of gray white matter differentiation gradually over the next few days the region becomes more defined and lower attenuating and swells such at the middle of the first week there is maximal swelling after this swelling gradually subsides and attenuation decreases in some patients returning to NE normal so-called fogging phenomenon eventually the infared tissue is removed
leaving behind cystic and keala it is important to note that the size of the infar therapeutic interventions and patient factors all influence exact timing at either end of the process the appearances and timing are predictable but during the Subacute phes exact aging of an infar can be difficult going back to our three cases it should now be obvious that image a is of a chronic stroke the region of infarction is very sharply demarcated and is a very low density similar to that of CSF and most importantly there is negative Mass Effect with widening of the
adjacent sulai and xacu dation of the lateral ventricle in contrast images B and C are Subacute infarcts they are often less well demarcated especially early on and although they are of lower attenuation than normal brain tissue they are still very much denser than CSF most importantly they have posit positive Mass Effect with the fac of the overlying Soul high in our next episode we will go into the details of fogging phenomenon a little more you can of course see many more cases and get much more detailed explanation on radio.org see you again soon