So yes I'm Carlos Costa I'm a senior research scientist at dark vision and it is my immense pleasure to welcome all of you to the first ever cvpr workshop on deep learning in ultrasound image analysis deep learning has taken the World by storm with numerous applications across across Industries and is evidenced by the sheer quantity and diversity of workshops talks posters and tutorials presented this year in Cvpr in this Workshop we'll delve into some exciting new Realms of emerging deep learning Technologies focused on ultrasound image analysis from its first applications in sonar echolocation ultrasound technology
has evolved to deliver high resolution images of subjects as diverse as human body to Industrial Parts such as jet engines and pipelines biomedical ultrasound provides a safe effective Portable real-time and low-cost solution in a wide range of medical Diagnostics on the other hand the non-destructive testing of materials helps to save billions of dollars annually worldwide in addition to mitigating catastrophic impacts to life and the environment in this Workshop we'll explore some of the specific aspects of how and why ultrasound data and often specific applications of that technology require Bespoke deep learning Solutions moreover we'll see
how deep learning can help ultrasound practitioners improve our data acquisition processing and Analysis both in efficiency and quality we will soon kick off this workshop with plenary talks which will be given by industry experts they will be followed by a short coffee break after we've had some refreshments oral paper presentations will follow with exciting new developments in biomedical and Industrial uses of deep learning for ultrasound afterwards we have the challenge presentations which will include the announcements of the winners of the challenge as well as selected presentations from the participants poses will be available from 11AM
to 12 a.m so please go check them out when you can at 11 45 I'll be back for closing remarks but beyond presentations and interactive Sessions this Workshop aims to foster a sense of community and connection it is a unique Outlet to build relationship Forge collaborations and expand our professional networks Beyond these walls and screens I encourage each and every one of you to actively engage ask questions challenge assumptions and embrace the chance to learn from one another's experiences on behalf of the organizing committee I Would like to extend my thanks to our sponsor Doug
Vision dark vision provides world-leading high resolution acoustic Imaging and inspection for industrial assets its technology is used worldwide to deliver exceptionally detailed and accurate 3D images of well equipment which is used to evaluate the Integrity safety and design of components dark Visions technology services are helping to mitigate environmental risks and Empower energy operators in achieving High performing reliable and environmentally responsible assets I would like to thank our speakers our volunteers who have made this Workshop a reality I would also like to thank each and every one of you for being here today physically or virtually
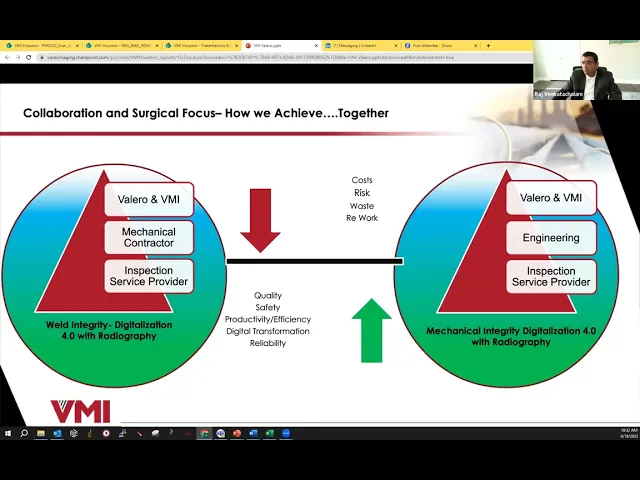
your participation and contributions are truly invaluable and with that I would like to declare this Workshop open As such let me introduce our first Speaker Raj venkatachalam is a senior research senior systems engineering manager at varex Imaging Corporation as well as chair of the artificial intelligence and machine learning Committee of the American Society of non-destructive testing the asmt the asnt is the world's largest technical Society for non-destructive testing Professionals in his role in the AI nml committee he is collaborating with Industrial and academic experts to develop guidelines for AI and its applications to the NDT
industry Raj is an active member of the asmt and has also contributed significantly to the international standards of the American society for testing and materials the ASTM he has a master's degree in electrical and computer engineering from the University of Waterloo and a bachelor's in Electronics and communication engineering from the University of Madras at varex Imaging Raj is working on developing engineered Solutions using Robotics and analytics to enable the Next Generation tool for radiography please join me in giving Raj a warm welcome hey thank you everybody thanks for the opportunity can you hear me okay
yes perfect whatever your idea feel free to Share your screen yeah I'm going to share my screen right now [Music] all right can you see my screen okay okay I hope you can see my screen okay all right so thank you everyone uh all right that's the presenter View okay um how about now [Music] Yep perfect thank you okay all right perfect thank you all right thank you everyone um thanks for giving me this opportunity to talk about aimo as applicable to NDT thanks for the kind introduction uh for people who are new to NDT
NDT stands for uh non-destructive testing so basically you use methods like ultrasound or eddy current or radiography uh to determine the condition of a part before actually A failure occurs so just like how you take a chess radiograph you would take a radiograph of a pipeline and try to see the condition of the pipe uh uh you you want to make sure that you assess the wall thicknesses of the pipe uh before a failure happens especially if it's carrying something like oil you want to make sure that there are technologies that exist that can in
a non-destructive manner test the condition of an object without causing any damage to it so That's NDT and NDT um uh is a technique which is very uh predominantly used in the industry in so many different areas and now with the Advent of uh artificial intelligence and machine learning uh we're trying to see how we could use these Technologies uh to improve the overall performance of the NDT systems itself so I'm sure the audience here know a lot about these topics on a very high level if you have to explain uh we all understand that
AI is nothing but Computer computer systems that are trying to perform tasks that are commonly associated with intelligent beings and machine learning is a subset of artificial intelligence where the software learns from data data is the most critical piece of machine learning itself and it just learns from the data that you provide learns from the um uh the crown truth basically the subject matter information that you provide to the data and then it comes up with Outcomes based on training itself right so so that's machine learning and uh as far as different types of machine
learning just to reinforce that like you have unsupervised learning where you pretty much provide this data and you don't give anything more than that in a computer automatically looks at the data and tries to find say outliers or tries to groups them uh based on what it's looking at right so you don't provide anything more than the data itself and And the program looks at it that's unsupervised way of learning supervised way of learning is where you not only provide the data but you also tell more things about the data right maybe you classify it
into different uh different categories you provide a lot more information uh which helps the computer to understand the differences and learns in that manner so that's basically supervised learning reinforced learning is what is Predominantly used in the NDT world where you have data coming in and then you have experts in our case we call the level two and level three experts subject matter experts who would look at the data and come up with interpretations saying whether the data I mean it's a part is defective or coming up with classifications and things of that kind and
then once you have that ground truth data you use that data and the Machine learns from it once It has learned you would deploy it in the background meaning you would still have this expert looking at the data and a computer doing the same thing in the background and at some point you would see if the outcomes are the same if they are the same then it's fine if it's not then you provide that corrected information to the computer or the machine itself and the Machine gradually learns and reinforces the learning itself so that's that's
reinforcement Learning especially in NDT since we don't have a lot of data and it's kind of very difficult where it's an evolving story when it comes to machine learning so you kind of develop tools that allows uh the the users the the software tools that will allow the users to generate the ground truth and then once you have once you have a decent amount of data you can go ahead and develop machine learning programs and then you go ahead and deploy it and then you do it and do It in a test mode uh with
reinforcement learning until you get to a point where you're satisfied with the performance and then you deploy it in the field that's typically how it's done uh this is kind of a new area for us in the NDT space a lot of systems have been developed that have these capabilities uh but there are still no real standards that are available uh how do I some how do I as an End customer know what I'm getting from someone else is validated Uh especially if it has some a machine learning capabilities integrated to the software as an
example so that's where we have the American Society of non-destructive testing and many such agencies uh working on coming up with standardization and processes that will allow us to use this particular technology specifically for NDT so when I say NDT I cover a broad range just not ultrasound it includes all the different modalities including ultrasound from an Inspection standpoint so uh just for the audience um maybe I think I should probably show a quick present slide here uh give me one second let me shift to that all right so just to get a feel of
uh what the what I'm talking about right so from an Imaging standpoint so let me go here um so this is basically a system that is used for inspection uh it's a scanner uh where you pretty much set up the part uh And then you're looking at I mean imagine you have a weld in the pipe this is just a test video I really don't have a weld you set up the scanner you give the software the information about the pipe the pipe diameter and then you start that's how you set up the scan plan
uh this is a flat panel detector so you have to perform calibration uh before you start the inspection and then you have the um an isotope source that is used here so the software based on The information you keyed in uh I think it's a 16 inch diameter pipe it actually divides the entire pipe into like 16 sections I mean 15 sections and then it moves to each position and takes a radiograph at that particular location so if you have a weld it's particular is specifically taking several images of the world and you can see
some well defects popping up in the process and so so the way we look at it is always when we think about machine learning Everybody thinks that hey it's looking at that final image and the Machine making an interpretation itself but that's not the only area in the area of from a complete inspection standpoint where machine learning could be applicable machine learning is something that can assist throughout the inspection process right from calibration to setup of the part uh to the final disposition itself so I'll talk about the various steps where this Could be actually
deployed but I just wanted the audience to get a feel of what this is all about it's just basically using an instrument and using any of the Technologies ultrasound or radiography for example collecting data and using the data that has an indication of what you're looking at and having the machines being able to process it and come up with an interpretation so traditionally the way this is done is Using expert or heuristic based algorithms and wherein you basically have a strict criteria right for example if you look at this particular image here hopefully if I
can pull it out right here okay this one so here you can see that is actually an image of an actual pipe uh and then it has some corrosion in it right so it has some elements of corrosion uh and then so you would typically radiograph this uh Um this pipe and then apply image processing or filtering tools so that you can actually clearly Define and see the wall and then you also here we apply a material loss estimation tool which is all based on measurements of contrast and the various transfer functions that is developed
in the background using a doe and then you overlap the color map so this is these are the tools the user has today uh and then they make those wall thickness measurements and then They determine whether this condition of the part is okay or not so that's basically you're using procedures with strict call criteria as algorithms you could also use model based inversion uh especially here in this case where you're inverting the gray counts on the radiograph into actual wall loss and showing it in the form of a color map and that could be based
on physics models so the and that's traditionally being used in the NDT procedure to Determine the condition of a part so that's how it's typically done today and now we are getting into machine learning right so here now instead of relying on uh the heuristic models or the model based inversion can we use the data and come up with classes uh can we feed in the data and also provide ground truth information and use like Advanced neural networks or deep learning methods for the machine to be able to do exactly what a level two or
a level 3 is Performing so that's that's where the focus is on right now and as we all clearly understand the main limitation that we have is having the right data uh enough sufficient data so that we can actually develop such machine learning programs so the emphasis right now is mostly on not even getting to the fair end of the game where we have the solutions but on the very first step wherein trying to develop tools making modifications to the whole inspection Process in a way that the data can be collected in the right way
so that it can be used to develop deep learning or machine learning Solutions so that's where a lot of emphasis should be if you don't have that infrastructure set up then you're not really going to be successful or not really happy with the results or the outcome that you would get from implementing a machine learning program so that's where a lot of emphasis is on in the industry so I Mentioned about how inspection is done and the way we see at it is that it's not only going to be playing a major role in steps
four five six of the inspection process but the the tools can be used pretty much for the whole NDT workflow right so the key step for getting good data is the calibration process itself so there can be AIML tools in the background reviewing the data and ensuring that some kind of calibration standards are met right so That's very critical that's that's that's a step that can be integrated into the calibration process itself then coming up with the right scan plan itself as I showed you a example of a pipe uh why did I why did
the program divided into 15 sections for example right that's called something to do with the the flatness of the detector and the geometric unsharpness and the number of views that are required to get the the right outcome from an inspection Standpoint so that's where the scan plan process itself could be uh something integrated to machine learning tools data processing so when I showed you the image of the pipe it was just just not the raw data that I was looking at it was processed data wherein we apply uh in the case of radiographs or ultrasounds
some image processing to it so that we can easily determine or make interpretation from the data what kind of image processing needs to be done how Do we ensure that the filtering or the process of image image processing does the right thing and not remove a defect for example uh those all could be aided by a machine learning tools there is one you once you have the data then comes the detection so this is where we're talking about rank indications of primary interest and then you got to provide explanation as to why you are rejecting
apart all of those can be automated uh once you have detection The Next Step would be characterization right so if you have good amount of data uh with different classes or then you could get into the characterization step uh as well so right now in the industry uh I think as long as I mean the way the way we are uh from from uh from the performance standpoint as long as you can detect uh and make sure that you don't miss a lot of defects in the process that itself is a huge thing because the
operator is so much you um Bored by seeing the same data over and over and over again so on the other hand if there is some kind of a screening or an assisted defect recognition process where only uh only images are of concern are sent to someone for for looking at it and not each and every image because in most of the cases the manufacturing process has been optimized where the number of defects are very minimal right maybe like one percent and you're engaging thousands and thousands of Parts uh you you want the operator to
be spending more time closer to on the images which are questionable rather than images which for for example looks just fine so that's where we could develop a screening type of a methodology uh for performing inspections which is what we're working on so as I said developing tools to collect the data coming up with some screening methodologies itself is a big step in the NDT world uh we're not Expecting all of this to happen uh for all the systems that are deployed but having some of these tools integrated itself is going to tremendously help the
NDT workflow uh talked about characterization and the last step is obviously this position where we're talking about like a past fail kind of a criteria itself so um and one one common question that I always get uh when I'm talking about the subject is okay when we try when we have Automation in place um and when we have an analysis of the data also done using machine learning techniques what is the real role of an inspector uh uh would his job be lost as an example right so the answer clearly is no um the skill
set that would be required uh by or the responsibilities of an NDT inspector is going to change because he needs to be familiarized with the tools such as the AIML tools for every step And he needs to be able to provide feedback and help the system and qualify the system uh so that's where as as the industry is going forward where we start using more and more of these tools uh the the skill set that is typically required for any teens factors are only going to change uh and it's not going to be a scenario
where uh we can completely eliminate them so um so that's something I usually emphasize when I'm talking about this Topic so where do we see an advantage uh basically if as I just mentioned repetitive tasks right so majority of these images that the operator is looking at or the technician is looking at uh is the same so you want to make sure that whenever you have a laborious interpretive tasks there's there's a lot of possibilities of Errors to come in uh so it helps in error reduction uh it pro helps in Faster decisions or actions
you Really don't sometimes you don't have access to the the level twos or the level threes who are in charge of looking at the data so the data is disconnected and then you got to wait for the person to be available uh to make a look at the image and make a decision after it with machine doing it uh it's going to do it immediately so that is the decisions are quite faster uh the overall risk could be reduced and I said you can be used in each and every Step so it acts as a
digital assistant and can also be a repository for human expertise number Point number six is where very important in the NDT side because the the population of experts uh on the NDT domain itself ultrasound or radiography is gradually diminishing um so it's very important to make sure that we capture that expertise as much as we can and hopefully with introduction of machine learning tools that is a possibility Um so that's uh there's a lot of emphasis on that and also um with the Advent the usage of these modern tools it might attract more population or
more people to come in and take this particular area as their as their career right so sometimes the NDT in terms of inspection uh is is not very attractive for like a stem graduate or someone who is very forward using advanced technology elements so but now we're bringing in AIML to NDT and that Probably might attract more people into this industry so I just want to touch upon a simple case study uh just to unders for people to understand how this this is being used uh is this is a case study where we use deep
learning based methods for rust identification and classification so uh as you may know uh one of the most important problems that we have uh from an industrial standpoint is corrosion right so there's a lots of money that's Been spent uh there's miles and miles of pipes running across States um uh and even sometimes between countries uh for for transportation of um multi-phase oil or anything of that kind so and these are all pipes with welding in between uh so um and so the Integrity of the pipes is something that has to be verified uh so
um one of the common method that is used in any NDP uh is visual methods itself just be physic just looking at the pipe From an external surface standpoint not even getting into ultrasound or radiography is that something that could be flagged so that's basically uh what we're trying to do uh if it's successful then you can probably have drones uh fly around assets say a Refinery or even miles and miles of these pipes and it could automatically flag areas of concern so so how is it done today right so you have an inspector who
goes and takes pictures extra to see the visual Uh look of how these pipes look like and then uh and a pile of images are then dumped on to someone else uh who has to look with those images and make interpretation uh to the severity of the corrosion itself and then they have to go back and look into that area again if it's if it's uh something if it's of concern and then a repair needs to be performed or some mitigation needs to be performed so that uh a leakage doesn't happen in that area So
how do they do it today right so it's very qualitative um and it all depends upon the experience of the person who's looking at the data itself um so there are two different methods which are kind of uh not the same it's complementary methods uh for uh assigning levels of corrosion based on the image so here you can see this is the ri index itself uh and then they have the cat category as well right so RI index is basically trying to basically more look into the density of the corrosion uh in a given area
and cat is basically looking at the extent of corrosion right like how much ball loss uh how how severe the corrosion is RFI and CAD D may be related but this is more in terms of the density and this is more in terms of the severity itself on the scale itself so how do they do it right and how are we going to change this process so just look at an image to Start with right so this is the Raw so this is this is what they would look at and they'll uh this is not
how it was done traditionally but we developed a tool an easy tool that someone could use and Mark areas of concern or at least different areas in the image and Associate different uh RI indices to it as an example so um so we gave a lot of images uh for these experts to look at we have Multiple experts looking at it just to make sure it's not biased to one person and then this was the ground through Theta that was uh generated right so so you basically uh they use uh tools in the software to
draw boxes or whatnot identify segments and then they associate a color based on the ri indexes itself so once that's done um then you basically these are the steps that we follow where you have data acquisition which is basically taking Pictures and then you have uh once you have the model developed then you process it using the model and then you come up with predictions and the subject matter this is reinforced learning where the subject matter expert corrects the false results right if there's if it's good outcome you want to hear she will not do
anything but if it's not the expected outcome uh we use the d-plat model and then we uh retrain the network and we do this several times until the Desired outcome is established so here are some examples where you can see the raw image this is the ground truth and this is the prediction itself so it was doing a pretty good job uh on detecting the different classes of corrosion and now it has gone to a point where this is any asset uh even in a Refinery or in unmanned assets in the ocean uh you could
actually add robots or drones fly around and and give you indication of the corrosion itself so this is just an Example the key to the success of this program was attributed to the data itself so availability of the data and then having several people look at the data and generate the ground truth and also having a good variety right you know you don't want to have a small subset of a training database uh and then you deploy it on a wider range of data itself and you cannot expect the performance to be good so in
this case we really had a good this is something That has been traditionally done so they had all these images available but the the ground rule which was required for our training uh was definitely not available in a format where we could use directly that's where we had to develop some simple software tools uh that actually allowed these people to look at the images again uh to come up with the ground truth and then the performance was analyzed so from a validation So algorithms income RS becomes a part of an ndd procedure and it needs
to comply into standard practices specific to what you're looking at A7 Section 5 article 14 is an example so here this is where more and more you would start seeing uh references to aim or going forward especially once it becomes a practice that is adopted in the industry so validation is the most critical element of AIML so yeah one is always if There is some validated techniques from prior work it's it's great to use that as a justification uh and then but data sets and making sure that it's not trained uh too much bias towards
one kind of data having that variability in the data itself and using outside of the lab data itself right so most cases what we do is we just use a data collection uh from a lab and then try to expect that it will work well in the field so that's where a lot of these systems have Failed uh non-availability of real field data for training so that has to be avoided and that's again where I emphasize the fact that as long as you have tools developed and the first two steps in the process redone from
an inspection standpoint it will help us to develop the AI Solutions itself so and I keep using the fact on the NDT side is I mean from an A it should not be as difficult as coming up with AI validation for a self-driving car when It comes to some of the applications that we are dealing with on and from an NDT standpoint it's definitely far less complex uh and this is where if someone if we can develop AI solutions for self-driving car uh we should be definitely in a better situation to develop good solutions from
the machine learning standpoint uh for non-destructive testing applications itself so um here uh let me quickly see if I can show you this video so this is Where it finally um so once you have these kind of systems developed then we go into complete automation itself right so uh imagine this is one of the systems that I worked on uh these are parts that are being inspected uh so it becomes completely automated once you can have machine do everything so you have the part being placed uh and then the part is here tilted at an
angle because we're looking at some agent inside the sample itself and the cabinet here houses a Detector and also an x-ray tube so the part is gradually scanned through the uh through the X-ray itself so it's a direct conversion detector that's been scanned using time delayed more so it actually as it passes through it it shifts and adds and generates the final image and then you have uh people on the other side really looking at the data at this point so hopefully you can get a feel of it so that's the image uh that is
being inspected and Then they have to look at it to make an interpretation in terms of levels or whatnot so this is a good example where we are working on developing AI Solutions because it's the same part that is being inspected and we have good understanding of uh the the defects that you're trying to look at it so but and so we have deployed this system we're in the process of collecting a lot of data we have software tools that are available to collect the ground root and Then the next step would be for us
to come up with a solution from a machine learning solution and then we would implement it and still have the operators look at it and then come to a point where the performance is good and then we go into the deployment itself so that's how it's typically done here so I spoke about the uh the pros uh in terms of how this can benefit on the mdp side we got to mention about the cons right so these sometimes the Implementation cost is High um uh especially identifying a problem going through the development process validating it
and then finally deploying it that's not something that happens instantaneously that's not like a ready-made product so that's where it becomes uh cost cost is a vital thing you don't you have to invest and then you would see the ROI uh based on based on your business model but definitely a high cost is something that one has to Or an investment is required for deploying this cannot make decisions well for scenarios not trained the machine it just works on what you have trained it to do lack of independent flexibility you just can't make any judgment
calls based on some other factors machine is a machine so it doesn't have moral values it doesn't really lead to unemployment the way I see it is um basically Um change in the skill set that would be required in the industry when these tools become more prominent uh when I say degradation of human skills is today you have an expert who understands the physics behind how the system works uh once you have machine start doing this then maybe you would probably put in people with not the right skill set who can at least operate computers
is what the requirement would be and this might Result in degradation of human skills so that's where it's very important to retain that in parallel to developing the machine learning systems so um to kind of finish up my talk uh there's lots of opportunities for AIML in the NDT industry if anybody here is interested to participate uh more in some of the asnt efforts for AIML they can reach out to me at this point we are writing a book uh NDT AIML for NDP audience or like a 101 like a For Dummies book and that
should be released pretty soon and then we're looking into other modern Technologies and what else can we do to assist implementation of aimo for NDT itself uh so data is the critical piece and uh just to summarize uh there's there's a lot of work that is being done uh right now to deploy AIML Solutions in NDP but some in some areas uh we've become we've gone very matured uh but the emphasis right now is to develop tools that allow Us to collect the data in the right way make modifications as required in the manufacturing process
itself and then over a period of time once we have the data and the ground rule then we come up with Solutions and standards for validation and and we're getting up in the ramp phase where this actually will become more and more a reality and you would start seeing it in industry uh that that pretty much uh summarizes my talk and I'm not sure if there is any Time uh then I can take off some questions [Applause] yeah we have time for uh maybe one or two questions yep thanks Rod uh I appreciate it very
helpful and insightful talk just a quick question more on the regulatory side of things like this is the case for anywhere machine learning or automation enters are there any discussion around Regulatory and like how much you trust the AI and whether there always needs to be someone to look after the automation or the to do quality factor I just wanted to hear your thought and whether you have any experience on the side thanks yeah absolutely so I think uh in most cases uh from a regulatory standpoint uh the stage we are right now is where
both happen simultaneously right the machine looks at it and the operator still looks at it the the only Area where we have gone one more step is operator not really looking at data that is good operated looking at data only that is questionable um so uh there's a lot of in the entity world the good thing is um uh from a regulatory standpoint the way they would deploy it is um everything happens in shifts so in an 8 hour shift they would have some kind of a validation Phantom of something of some kind uh that
they could use in the Beginning of the the whole eight hour process to validate the performance of the system obviously it's just based on what you have in the validation Phantom and so on and so forth uh but that's something that has been enforced to make sure your system is performing uh to the spec uh and they also have enforce a lot of blind sample studies in the beginning so you probably uh uh make sure that you have a good amount of data in the beginning and you have to prove it with A blind sample
that your system is performing as per the expectation so that it can be deployed and that's something that has to be done periodically uh just to make sure your system is still doing what it was doing when it was deployed uh so the answer to your question it's a little vague right now and it's got to take it application to application and where it is being deployed and depending upon the rules and the severity in terms of what you're Trying to do to decide uh if machine can actually replace what humans are doing today I
know it's around a long about answer so I wish we I can say hey everything is controlled and we have regulations and procedures to handle this but uh we are not there at least on the entity side great thank you um I think we'll move on to our next speaker our next speaker is Dr Paul Wilcox um Dr Wilcox is the professor of Dynamics at the University of Bristol a fellow of the Alan Turing Institute and academic director of the UK Research Center in nde he received an engineering science degree from the University of Oxford
94 and a PhD from the Imperial College of London in 98. in 2015 he co-founded induct the sense to commercialize inductively coupled ultrasonic sensors his research interests include arrays guided waves elastic Dynamics elastodynamic Scattering signal processing and machine learning let's give a warm welcome to Dr Paul Wilcox this is yours right yep let's do this thank you okay thanks Carlos I think we're in business um if you didn't guess from the introduction I'm from the UK slightly jet lagged so I'll try and hold it Together uh thanks very much for the organizers for inviting me
here to speak it's the first proper machine learning conference I've actually been to a lot I'm going to see a great deal of it but um anyway I hope you find this somewhat interesting just let me uh foreign yeah so I'm from the Ultrasonics and NDT group at the University of Bristol in Southwest the UK this is kind of um hopefully a sort of Educational talk or informative talk at least based on some examples of machine learning and our kind of process of of developing Solutions in that area so main contributors myself um Anthony croxford
Sergio cantero chinchilla Rob Hughes who are all faculty members jijang who's a senior research fellow and Richard Pyle who is a recently graduated energy student who have been the kind of the main contributors in this area So well the previous speaker gave a very good explanation of what ND is in general so I maybe gloss over that bit a bit but something that's come up multiple times and I don't know what fraction of people in the audience come from the medical application side but it's can be quite instructive to see what the difference between ultrasonic
um Imaging for nde and ultrasonic Imaging and Medicine what the Differences are and why solutions from the medical domain aren't necessarily directly transferable then I'll I'll go through three examples of work we've been involved in um some of which was less successful than others and I'll try and draw some conclusions and maybe some uh warnings from from those before summing up and suggesting where it's all going in the future uh so well we've seen General terms what ND is it's a suite of measurement Technologies for assessing the state of usually safety critical structures without um
damaging them there's probably five or six main modalities ultrasound is my thing um x-rays the previous speaker was talking about another modality there's also eddy current techniques there's visual techniques and so forth consequences well most of the time NDT Just happens and nobody knows anything about it which is not great when we're trying to sell ourselves to The Wider world but when something does go wrong you do know about it um sometimes in the form of a tragic accident or it could be just very large Financial losses so this this was a nuclear power station
UK that was closed for an extended period when um NDT found cracks in a critical component in the boiler um basically just um aging of the plants Um they've managed to repaired them and kept it going but the cost was um what's that half a billion Canadian dollars or something like that like close grounding planes because there's a problem in the gas turbo engine is extremely expensive even if there's not a catastrophic loss of whole incident so the reason for ultrasound is probably the single biggest nde modality it's an x-rays are the only modalities that
Enable you to penetrate into the interior of an engineering material um whether it's steel and aluminum titanium concrete so if you want to see inside it's got to be one of those two um ultrasound has the advantage and there's no ionizing radiation involved and it can be done on site and it only requires access to one side of a component whereas radiography always involves getting to both sides of it and there's of course attendant Um health and safety issues with doing it so medical ultrasonic images no doubt um be fairly familiar with what some of
these look like um obviously a single massive difference with engineering images is that there's movement of the thing you're looking at not just gross movements of the thing you're looking at but also differential movement within the the target as you Can see in this example which puts some fundamental um physical limitations on what you can do in terms of the speed of acquisition because you're reliant on coherent uh or the sound that's scattered back from the material being coherent from one shot to the next if you want to do any sort of coherent compounding or
beam forming also what you actually see in a medical image like this is essentially its differences In the intensity of a speckle pattern and the speckle pattern is coming from lots of the responses from lots and lots of weak scatterers in a medium that your first approximation is water there's also only one dominant wave mode which is compressional waves which both good and bad it generally makes things easier to interpret but then it gives you less options for looking at things the material itself human tissue is extremely non-linear and there are lots Of multi-physics effects
that go on which enable things like Photo acoustic Imaging the interaction between Optical absorption and the generation of ultrasound which we don't get in engineering materials at least not in a significant level conversely in nde where to be looking at Targets that are completely stationary at least over the duration of an ultrasonic measurement so we don't have any Physical requirements to go for Speed there might be Financial ones to be able to make scans faster but there's no fundamental physical limitation on the time taken to acquire data uh we're typically looking at Targets whether abrupt
changes in acoustic impedance whether those are due to the boundaries of the thing that's being inspected or due to the defects that you're looking for which could be cracks Or inclusions or or voids there's also in any solid there's going to be um two or sometimes more than two um wave modes present so a shear and longitudinal wave which have comparable amplitudes and velocities that differ by a factor of two which makes things more interesting in terms of interpretation and of course there's no conversion every time there's an interaction with the boundary we do have
very low levels of Nonlinearity and in fact nonlinear ultrasonic nde techniques is quite a niche field because it involves measuring very very small effects so there is some motivation for doing that because it's potentially more sensitive to precursors to to macroscopic defects maybe that's a much less mature area so what we're typically looking at in an ultrasonic image this is quite an old one but um there'll be some level of structural Max scatter from the material microstructure itself whether it's grains in a polycrystalline material or applies in a carbon fiber composite and most of the
time that's not of Interest that's a distraction and the thing that actually limits the detection or the detectability of defects so there's a sort of background coherent noise level that can't be suppressed by averaging because it's structural noise and what we're looking for is the presence of a New signal that or an unexpected signal and if there's an expected signal there can we characterize it and say something about the nature of the defect that's causing it uh the previous speaker um made good reference to all these points that I'm going to put on here but
fundamentally nde is invariably applied to high value or safety critical components the ground truth data about defects and degradation in terms of What's physically there is generally not available you can compare it to operator assessments which is the reinforcement learning approach but actually finding out what was really in a component on the inside is very difficult because a defects are rare which is generally speaking a good thing because these are high value components that are very carefully made um and B if something is found the component will generally be scrapped or It'll be the defective
area will be cut out or welded over so the last thing it wants to do is to then start going to a very expensive um dissection of it to try and find out what's really there which involves something like x-ray CT or Progressive sectioning to find the absolute truth so fundamentally there's a shortage of true positive data and especially true positive data that's labeled with ground truth information and the other point as Mentioned already is that nde is generally uh highly regulated because of the nature of the the things that's being applied to so most
of the time there'll need to be some sort of regulatory Authority whether it's the FAA or a nuclear inspector that needs to be satisfied that an inspection can indeed reliably detect all defects that it claims to be able to do and a problem of course there are existing procedures like the any standard and the military Handbook 18 whatever it is that say how to do this but the methodology in those is very much based on um a physics-based interpretation of data as soon as you have machine learning in the loop that basically means that a
lot of the current methods of qualify inspections don't work anymore so there's the last question so the first example which was the first foray we made into this area it couldn't Be simpler it's not really Imaging in fact it's not Imaging at all um but we thought we'd start with the simplest um kind of ultrasonic measurements which are um straightforward normal instance um thickness measurement so the idea is you stick a transducer in this case physically Stick it to the surface of a structure you inject ultrasound in pulse active mode and record the signal that
Comes back and if it's a nice um structure with good surfaces inside and outside you get some sort of time signal like this and it's trivial to work out the thickness the structure if you know the speed of sound from when the first Echo arrives um this was motivated by the spin out company mentioned inductor sense which manufactures these permanently attached sensors that are intended for deployment in the petrochemical and process Industries so you can go back and make repeat measurements of an asset that's potentially corroding from the inside the challenge comes um when the
internal surface that you're trying to measure the Reflection from becomes rough due to corrosion so a smooth surface gives a nice Echo chain that's trivial to extract the thickness as it becomes rougher The Echoes get more and more distorted so trying to get Reliable estimates of remaining wall thickness which is the quantity of interest and also to do trending analysis on the race of corrosion wall loss becomes harder and harder so given that we were doing a modeling campaign anyway for various other reasons we thought maybe we could try a bit of machine learning on
this see if we can do better than just measuring the peak of the first arrival time So again there's a problem of not having sufficient quantity and diversity of known ground truth data I mean you can think of ways you could go about doing it with laser scanning of corroded samples but at this point we were doing an Fe modeling campaign so these are 3D explicit time domain elastic Fe simulations using software called Pogo which is written Imperial College in London We did about 20 000 different cases of varying thicknesses varying levels of roughness in
terms of amplitude and spatial wavelength for the roughness and different transducer Dimensions which actually one of the quantities we're originally doing this campaign for guess a key Point here is that you need a lot of data to do anything useful with the machine learning and um if you're doing simulations that means you've got to have a completely Automated tool chain in order to be able to do it reliably which took quite a bit of effort to set up anyway as we didn't really know much about how to go about things at this point we just
did the kind of obvious thing which was a 1D convolutional neural network so nothing um complicated implementing tensorflow compared to what was at that point apparently the optimum uh time series analysis Um architecture called Inception time so we applied it to all this these 20 000 odd time domain signals We Got Each one of which we knew the mean thickness underneath the transducer and we knew the minimum thickness and then we looked at the error between the prediction and um the truth so this is just graph on so this was just basically us trying to
get a handle on um how complex we needed a network to be we had the inspection the Inception time result Which is this red dot down here which took quite a long time to train and you can see the the level of that but we also found that if we just progressively increased the complexity of a much more basic um convolutional neural network we pretty soon um was that about half an hour's training time we got to the same performance so we didn't need the particularly complicated Network the Limitation is in the amount of data
available and this is you know there's nothing particularly amazing about this result but it does seem to be a general Trend that once you get enough complexity the exact details of the network you're using doesn't really matter it's more about having enough training data and obviously you've got to make sure you do get to this point but you don't need to go much Beyond it uh so here's some Results this is all on simulated data um so looking first of all at estimates the mean thickness the left-hand graph so on these graphs the bottom axis
is truth the y-axis is inferred thickness from the data this is The Benchmark so measuring just the arrival time of the first peak in the signal converting that to a thickness this is the result from our trained neural network and it's great to pull the scatter in quite a lot this is all Looks quite promising we also looked at the detecting the minimum thickness um which is a harder challenge because that typically caused by the well it will be caused by the the deepest pit underneath the foot of the transducer um again the CNN does
better these histograms sort of capture the errors the blues are the CNN results the orangey colored bits are the the results from um traditional just picking a peak value From the time Trace and you can see we get quite a good Improvement in the both the mean thickness error and the minimum thickness so this all looked um great uh obviously the CNN is pulling out more information that was available in those a scans when it gets to the rougher samples the the simple Peak finding method wasn't using of course we don't know what it was
that extra information and then we made the mistake of trying To do it on experimental data uh which was a disaster so we had some coupons machine that actually had in theory exactly the same profiles as some of the models that we'd use to generate data uh so we were quite careful about it we didn't we knew that our FP model because it hadn't been designed for the transducers were using wasn't quite right but super efficiently the the a scans from the experiment and the model looked the same pretty similar uh There's a bit more
noise and experimental data and there's some lower frequency ripples in the simulated data but when we came to um put the simulated data sorry the experimental data through the trained Network the the error is absolutely not so 3.7 millimeter RMS error on samples that are only about five or six millimeters thick anyway so it's basically just completely useless so the learning point here was that although the simulated data is Superficially looks good it was nowhere near close enough to reality and because we don't know what the features in the simulated data that the CNN is
actually using um we can't really say why it's gone wrong we just know that there's something else there that it's exploiting which isn't there in the experimental data we did subsequently through a bit of budging managed to get a better result Than that essentially by corrupting the model data to suppress some of the more subtle features in it so the CNN couldn't learn off those but it was fundamentally rather unsatisfying solution what we really needed was a better model or more accurate model in the first place so the second third applications do relate to images
so after the first um experiences in machine learning we thought we'd better think a bit more Carefully about how we're going to do it so just the first of all the traditional ultrasonic Imaging pipeline for nde is you start off with a load of raw measurement data from elements in an ultrasonic array so each one of these is a a Time domain signal containing Echoes there's then some physics-based beam forming to form an image where you're exploiting prior knowledge about how waves propagate the velocities and so forth uh to form an image of the Interior
of the component and then some physics-based analysis or possibly human interpretation to get the useful information about the state of the structure out of that which you can then make it is used to make a decision on whether it needs to be scrapped or repaired or it's fit for service so the kind of the naive way to do the machine learning approach which is essentially what we've done in our first example which just take a huge amount of Raw data at this end forget all the physics-based stuff that we've we've learned about over the last
50 to 100 years and just stick it all into a big box of machine learning and hope that something useful comes out at the end of course the problem with that is the parameter space that you've got to span here in terms of the road the the data that you need for training is enormous you've got to cover all possible structural and Geometric variations as well as all possible defects of Interest so it's a very high dimensionality parameter space um and it's going to take even if you could get that much data it's going to
take forever to train and you're throwing away a lot of prior knowledge so the better approach we thought was to make use of physics-based experience where we could so going from raw measurements to images which is definitely exploiting some prior Knowledge and any um knowledge we have about how to interpret things um in an image and really focus the machine learning on where it can make a difference which is on the human interpretation side which can't be easily coded algorithmically so the first example and this is ongoing actually is trying to suppress artifacts In ultrasonic
nde images just to explain what I mean by that here's a an example of a typical ultrasonic image from a I don't know what it is probably a component with the Wilderness the ultrasonic array would be up here there's a I think this is the back wall reflection here this is probably this is an artifact due to the slower Shear mode there's also some Imaging artifacts over here and there's microstructure noise here What we're looking for is the presence of a new peak in there but the all the artifacts are making that job more difficult
which is why a human operator is typically required um a simple way of getting around it is just to mask out all the regions that contain large artifacts but that of course restricts um the amount the area that you can inspect and if there's any uncertainty in where those artifacts are going to be You have to grow that boundary or Shrink the inspectable region even further so the the basic method used here um was to assume that all the variability in the defect-free data depends on a small number of inspection parameters which could be things
like this thing so the structure or the exact position of the probe try and train an auto encoder to infer What those latent parameters are and then to predict when the artifact signals are going to arrive in the Raw time domain data so they can be suppressed prior to Imaging uh it's a basically a split Auto encoder in that the two halves have trained separately then there's a later iteration which I won't talk about which avoided that bit um the encoder is basically learning from a Model what the latent parameters of the inspection are and
then the decoder goes from those latent parameters to predict when signal should arrive so effectively the decoder is a surrogate model for potentially a much more complicated Fe model of wave propagation in the object when in operation it looks a bit like this so we feed in measured raw data at the left hand end um that goes splits into two paths one of Which goes through the the machine Learning Network which works out when in that raw data there will be artifacts present those artifacts then used to mask out very specific regions in the Raw
data so not large regions in the image but in the Raw Data before it's formed into an image and then we can form images from that maths data and as a bonus we get the latent parameters which are actually several of them are needed to form the Images anyway because we need to know where the array is relative to the sample in order to compute um Ray paths to do imaging I wouldn't go through the architecture of the two halves of the network they're basically standard convolutional neural networks and the back to front version of
that uh just to stress again took about 5 000 training sets to get both sides um trained And this is what the a typical result looks like so this is a cross-section of the setup up here this is the sample there's water coupling there the probe has some uncertainty in its position relative to the surface and its its angle if we don't do any corrections this is the image we get it's actually fused from images from different wave modes but this to illustrate the principle so you can see there's a whole load of artifacts jumping
around if we Do do the artifact suppression we kill off all these and there is a in fact a Target here which then remains stationary so it's brought it out of the the background and this could is now something that could be detected and characterized using conventional methods what am I doing okay uh right last bit is on from multiple defect sizing from multiple images and so this will be of interest to uh some of the people in the audience definitely pipeline inspection Using internal uh so-called pipeline inspection gauges this is uh one that isn't
from dark vision but the same principle applies so it's got a load of ultrasonic arrays around the perimeter the Rays looking outwards at the pipe surface and the the tool is deployed into a pipeline where it will trundle along for maybe hundreds of kilometers Gathering data as it goes this is looking end on and the challenge here is Um basically every point on the in the pipeline in the diameter of the pipeline is observed from four different views uh or from two different directions and two different wave modes so every every position we have four
overlapping pieces of information um and this is a huge volume of data if you imagine this is all around the diameter of the pipe and then over hundreds of kilometers so the the motivation is really to automate the Human interpretation of um signals in here it's not the detection problem detecting things is fine and also there's no artifacts here because the inspection has been said very carefully so that um in a good pipeline you'll just see blank um blanks here the problem is when something is detected can you classify what it is uh so once
again we've got a problem with simulating enough or generating Enough data here we used a hybrid approach where we have experimental measurements from defect free um component that gives us the background noise and then we superpose onto those the responses from known defects so we have known ground truth information on a realistic noisy background uh top row is simulated bottom nose experimental and here the the cracks we're looking for are surface braking cracks that are growing from the Outer diameter the outer surface of the pipe inwards and they may be inclined at some angle relative
to the normal Direction so it's a very tightly constrained problem because we know exactly what domain of the effects we're looking for and it turns out this is kind of like a perfect machine learning problem because although you can see the indications quite clearly the way that they manifest depends very much on the length and the orientation of the defect So it's very hard even though an operator could do it with experience to algorithmically say what it is the operator is doing anyway once again it's a fairly standard now 2D convolutional neural network the input
is the stack of four Images so rather like RGB channels in a color image there's now four of them for the four different views the output is a prediction of length and also the second one doing angle And again these these showed the the results um the blue uh bars in the background they represent the kind of the best case of a standard algorithmic approach which is picking a certain view the one that gives the best overall performance and then drawing a box around the indication um following a certain procedure and then the largest dimension
of that box isn't it measure the crack length um then the orange Peak which obviously Has a much narrower scatter as the result from the the CNN so it significantly beats the classic method by about a factor of three and we also checked what happened if you allowed some variability in the parameters so here we put in I think plus or minus 10 variations in the velocities used in in the simulation which we didn't know and again if you include that level of variability in the training set you can actually make a Network that's fairly
robust to to um to that level of variability and just finally on this uh this was Richard Pyle's ngd work he did four papers um sort of heroic uh energy student who won the best I've ever had um this this is provoked quite a lot of interest which was how do you quantify the uncertainty of a network like that problem is you can whatever you feed it It will spit out a number as to what it thinks the crack length is it doesn't know if the data came from a crack that within it was within
its domain or it's something else or or it could be just um fundamentally faulty data looked at various different ways of quantifying certainty but the one that performed best and also the most intuitively simplest one from my point of view is simply to Train an ensonder of identical networks on the same data but with different randomization conditions at the beginning it gives you enough diversity and output you can take the average across the outputs to get an estimate of crack length but you can also look at the standard deviation across them to get a measure
of uncertainty on the basis that if all the networks kind of agree that it's good data the uncertainty measure should be less and That was certainly comparing on this side the on on the data where we know that the truth the the erroring crack size to the uncertainty that was almost a perfect one-to-one relationship when it was trained and tested on simulated data and even on the train on simulated tests on experimental data which is the blue one although it's not it's the monotonic relationship it's not the same gradient but it's certainly it shows the
the same effects And this just illustrates how that works for looking at um in domain and sorry in distribution out of distribution data so remember it's only been trained on Surface braking cracks so this top row shows images from a surface breaking crack the black and white dots um you can see there's quite a small 0.2 millimeter error and the predicted uncertainty is comparable the second row Is an embedded cracks that's one that doesn't break the surface so it's something that's never seen before it still comes out with a prediction of crack length and probably
thinking it's the making the worst case assumption but that's optimistic but the uncertainty is much higher and then when presented with some pictures of Richard's cat uh it um it again predicts it's got a 4.2 millimeter crack but the uncertainty is much much higher because this is just Data that's never been seen before so finally just to quickly summarize where we've got to I think um key is understanding exactly what problem it is you're trying to address when applying machine learning to nde data whether it's to replace a human interpretation for the purposes of increasing
capacity or throughput or repeatability or to try and do something that can't easily be done currently to Increase capability rather than increasing capacity I'm encouraging everyone in our research group now goes oh can I use machine learning for this so I try and ask them the set of questions roughly like this have you tried non-machine learning Alternatives because they're going to be um much easier to explain and understand how the the how they're working if you do insist on doing a machine learning um going down the machine learning Routes have you thoughts about where you're
going to get all the training data from because it is typically the order of I'd say 10 000 is kind of number of data sets you need before you get to be doing something useful that you couldn't do by the means and also the killer question for industrial application is how exactly is the inspection going to be qualified uh I mentioned we need roughly 10 000 samples for training Um the business about getting the data you're never going to have 10 000 labeled ground truth samples of different defects if it's not in the foreseeable future
so you've got to have some way of generating label data whether it's from uh synthetic complete numerical simulations or a hybrid approach which is what we use for the pipeline work or possibly to reformulate the problem so that the machine learning part doesn't require defect data for Training which is the approach we're taking at the moment increasingly on the artifact suppression to train on defect free data we learn to predict what that looks like and then we simply subtract that from a measurement to leave either defects or noise which can then be processed using kind
of existing methods though I would stress that even in that case you still need to have some real label defect data for the testing and qualification purposes And we actually put it in a recent paper we proposed half a dozen axioms for um machine learning in nde which I noticed were pretty similar to what the previous speaker um listed numbering slightly different but things like being completely clear on what the domain of operation for a particular tool is so that is we can typically take a transducer out of a box and stick it on a
sample of a Different thickness and it's absolutely fine we know how to interpret the data but if you have a machine learning analysis toolkit that's only been trained on samples from five to ten millimeters and you try and apply to data obtained on something that's 15 millimeters that you don't know how it's going to behave also quantifying uncertainty and related to that networks that are aware when they're presented with data that they they shouldn't be Handling or can't handle let me just skip this one let's finish this one this is where it's all going um
complete automation of the process uh if we can convert raw nde measurements which will in the future be acquired almost certainly largely robotically um or by some some form of completely automated um acquisition automatically extract useful information from that and then feed it into a Structural Integrity model which is the kind of the Missing Link at the moment we've got something that ultimately can provide a what one of my colleagues described as a self-verifying asset but essentially this is where the aspiration I think for where digital twins are going ultimately the computer architectures there and
the software is there to store all the data but to actually use that data to make um predictions of structural Integrity Using nde data as the link to the real world that's the the next bit right I think I'm sorry I've run a bit sorry I'll stop there thank you um I think we'll go on to the next speaker because we're a little bit behind if that's all right um but yeah uh please ask questions during the break as well to talk to Paul okay All right um our next speakers um will be Dr Reza
zahiri and Jason Van Tome uh Dr Reza zahiri is the vice president of innovation at dark vision Technologies he has a PHD in engineering from the University of British Columbia and an MBA from the Beauty School of Business at Simon Frazier University his background combines over 15 years of experience in leadership and innovation product and Technology development and startups mid-sized companies and Global Organizations resolove solving problems and finding Creative Solutions that are inspired by research and grounded in practice um Jason Van Tome is the director of machine learning at dark vision Technologies it has been
in software product development for almost 30 years working in both research and product development in both Enterprise and consumer products before joining dark Vision um he held data science and product director roles at cubic form systems Microsoft and Electronic Arts Jason has degrees in music technology from McGill University and a master of information data science from UC Berkeley let's welcome our speakers I haven't put it on there is it right yeah that's a mirror among Liv knows where it is no I don't Know yeah so just press F5 impressive right it's already shared it's being
shared foreign well thanks everyone for coming I'm actually surprised by a turnout I was worried it's just going to be a few people but this is a good room so thank you and also Happy Father's Day uh to all the fathers in the room sorry you're spending your father's day Here but glad to have you also wanted to thank the invited speaker I really enjoyed it appreciate it looking forward to the rest of it as for my talk I'm just gonna talk briefly about hopefully briefly about dark vision and like a bit of history of
what the company where it's coming from what are they doing when Jason will cover more like where it's headed uh so dark vision let's see if I can Figure out how to move forward just there these are the founder um believe it or not they're they're UBC graduate uh UBC is the one of the biggest universities uh around us in Vancouver uh so these are the founders they started company in 2013 and fresh out of grad school and the focus was mainly on asset integrity and pipeline inspection right now at the time it was small
obviously but in 2020 like almost three Years ago the company acquired by Coke which is for those of you know it's the biggest private company in the world they're like as big as Microsoft believe it or not and they invested a lot in a company and now the company is close to 150 people we do we do have a bunch of site and our headquarters obviously Vancouver it's North Vancouver uh to be exact this is where we do most of our r d and operation but we do have a lot of sales Offers around the
world um starting with North America but very soon we're gonna actually have office in uh probably someone in US Saudi Arabia Norway and even Australia so the company is growing fast and now we kind of touch on what briefly the company is doing but let's start with what the problem was at a time when they started the company uh most of you Probably are familiar which what could go wrong in an asset Integrity business this is an example this is a picture of Vancouver downtown this is what would happen if a pipe burst in the
middle of the city so obviously this is not something you like or look forward to or the other problem which is very common in assets Integrity is leakage like somewhere in the middle of an over there's a pipeline no one is looking at it and it could cause catastrophe damage And the last one this is also I don't know for those of you who watch Breaking Bad uh this happens illegal tapping someone in the middle of nowhere can just break into your asset and start distilling your resources it could be anything it could be it
could be all it could be gas it could be chemical and just keep in mind this is very far from anywhere you have any visibility to And you just want to know you just want to know what's happening to your asset and there are obviously existing Solutions this is one solution in the market they it's just they call it caliper it's actually a bunch of mechanical fingers what they do they sing they send these fingers to the pipeline so it goes through the pipeline and they look at the basically the geometry of the pipe and
it gives you at the end some sort of a report like What's the quality of those pipe is there any hole is there any problem and obviously as you can see it's it has a resolution problem it has a bunch of other problems because every all the information you're getting is from those fingers and you don't see anything in between so it's it's at a time it was very popular now it's becoming less and less popular just because it doesn't really give you enough information the other solution at A time this one is still going
on it's these are like digital camera they send these camera inside the pipe and the goal is to kind of inspect is you're you're visually seeing what's happening inside the pipe obviously there are advantages to the camera people are used to seeing out images but they're also this advantages first of all that your view needs to be clear the all you need is a Surface You Don't See Beyond the surface and there are other like lighting is another problem keep in mind you're in the in the pipe it could be under the ground there's not
really much lighting so there are a bunch of problems with the camera uh I think I have a video this is what the camera view will look like and it kind of give you a sense of what you're dealing with then you're trying to do inspection and all you have is a Camera and as you can see like if you have some sort of weird liquid it's just going to block your whole view you won't be able to see anything and that's where the company came in and they thought about at the time they thought
about different variety of solution like what would be a good solution for this kind of problem so that you can actually see inside the camera inside the pipe and inspect it in a high resolution and this is after Exploring different technology ultrasound was the clear answer and this is what they came up with why not having a high resolution ultrasound solution that goes into the pipe and just inspects the condition of the pipe and generate the report and as I talked by Paul he already covered obviously it wasn't new this was done before people use
ultrasound for decades in medical imaging especially high resolution but in nde nde or NDT at the time high Resolution or linear array phase reimaging wasn't that popular especially in a pipeline inspection people are using it externally like for the ND application but from within the pipe uh it wasn't that popular and there are obviously there was a bunch of reason why we decided to look at the ultrasound uh first of all you can collect volumetric images keep in mind these are like kilometers and kilometers a pike and you want it to be a little Collected
uh images the other good thing was obviously it doesn't need light if you were compared to the cameras you do need flashlights or LED lights but not necessarily the ultrasound the other great thing with ultrasound was it's fluid agnostic like you don't need a clear fluid to be able to see the pipe which was one of the big problem with the camera obviously with the camera you need clear fluid you need good lighting this didn't have any of this problem and The others Advantage was basically with ultrasound as shown was similar to examples but you
can see beyond the surface when you take a picture of something all you see is the surface but with an ultrasound you can actually see through it and you can see what's inside it so that's how I started I'll teach it was a thought behind the whole company in the technology so we did and come up with three different type of solution I'll go through each of them and what They were and fundamentally they're kind of similar but they address different problems so the one where I'm showing you the first this is our radial solution
what it does what you see on the two sides they're just basic centralized all they do they keep the tool in the center so that you try to do your best to centralize uh the sensor and the sensor is just that tiny things and it shows it fires a cone array outside and that's all it images and This thing moves through the pipe so as it moves it collects the data I'll show you a bunch of Animation hopefully it gives you a sense of what the product looks like so this is like a rendering of
the tool and that's the sensor it has close to like 500 elements of transducer around the device and this is what it goes into the pipe like it just as it goes it collects the data and I'll show you a brief uh simulation of what it does it's a it's Kind of a phase array image you know here's an example let me see if we can work this yeah this is like if an example of what this sensor does obviously it it's just some sort of focusing based on the where you want to focus it
sends sets some delays and transmits a pulse and it hits a point depending on you can obviously adjust where you want to hit and then receives the Echo and The Echoes is what you're looking at on the receive side trying to Make a sensor pi I'll show you images later but before getting to the images uh maybe a bit of a tiny video that shows how this works in action I'll play this video but you will see is a it's a tool and uh how are you gonna push this in through the pipe and these
are the two centralizer and you just pass the sensor a sensor just collects High frame rate ultrasound data as it walks through the pipe and this goes on and on for kilometers and Kilometers and you get images like this like the one image on the right is a standard 2D image you'll get from the cone Imaging and obviously because you're moving and collecting you can turn that into 3D volumetric data you can start looking at the whole 3D images and the last one is something we do it's like it's Max intensity projection it's like unfold
your pipe and look at it through and you can it helps you to see some of The features better you can see like this one has a bunch of defects and you can easily inspect it either with machine learning or even some of our analysts uh also let's see if this works this should be a quick clip of how these 2D and 3D images are put together and as you can see like and these are click the slice by slice but once you put it together you get to see the full volume Um now you're
okay the max intensity projection I'll show you the comparison and we do a lot of testing and validation in the uh the company I'll show you for example this is an example of pipe that we machined like you can see the one on the left is the actual Optical image of that pipe it has a bunch of features on it with holes like cracks and stuff the one in the middle is the CT which we kind of use as a gold sander or a reference and the one on the Right is what are the device
generates and you can see there's a very good correlation obviously we went through these and we do a lot of quantification analysis but it seems to do a pretty good job of creating or it goes back to like digital training concept can you recreate what you're Imaging so these are like field like lab data I'm going to show you some of our field data uh these are these are some of the report that we sent to the Customer obviously they don't know what's going on with their pipe let me show you a few example most
of these pipes are kilometers under the ground like you have no way of seeing them or visualizing them sometimes you know there's a problem you don't know what it is sometimes you don't even know there's a problem you just do it just as an inspection and these are the type of images we can get um based on the our Imaging device one Thing I also I'll say even though the focus of this Workshop is molar and the data analytics side just to getting the results we do have a very active projects which focuses more on
the rendering and visualization like once you have this data it takes a lot of effort to properly visualize this data so that's something else we are actively working on I guess is the focus of this way this Workshop will be most on the analytics side not necessarily on the Visualization but that's these two are both very active research topic these are another example for our field data like again some of them has ruptured some of them have corrosion or damages um I'll give you another visualization which we do but again we I'm here's like a
walkthrough of the pipe which is they really value this because it allows you to kind of walk through Your pipe and right now you have no way of doing it and we do have a team of analytics that go through these and tag these or flag these problems or measurement these are the numbers you'll see are they do we have a team of data analysts that they go through these data and then if there's anything important they flag it for their operator another initiative you have is how much now that we have all these labels
data The question was can you automate it this is where the whole discussion of machine learning and analytics come in uh and right now these two go hand in hand we have a team of data analytics that they label these data and at the same time we have the machine learning team that try to automate as much as we can I know Paul said it's very hard to get thousands of label data but we actually have tens of thousands or maybe hundred thousands of labels data it just Keeps going which is a good thing it's
usually you this is something that holds back to machine learning but if there are any other settings if you have too much data to deal with and would we love to see automation as much as possible for a variety of Reason obviously the user dependency becomes you reduce the dependency by the operator and also the repeatability the fact that the same thing is looking at the same data so there are a lot of advantages to doing These things in automated fashion the next one uh I'm glad Paul again gave a bit of introduction to this
one this is what we another solution uh it looks very similar but the array is a bit different this one fires perpendicular and the reason for that is whether you want to measure the thickness of the pie again there are a lot of application that this is more important they want to know how much metal is left and this is like some lab tests uh we do Those are machined uh sample we do different thickness and you can see what the tool kind of measures uh again we've done this we're using classical algorithm and we
are also looking at doing this with machine learning uh by looking at those data sets uh here's a like a quick demo for this tool will look like the thickness it's it's very similar to the other one the only difference is it fires in a Perpendicular like right either pipe all right and this is all marketing fault but let me show you some example this is an example of what the tool actually generates it out because the one on the left is a photo stand like where we capture is this example we took in the
lab is a real sample we chopped it off we scanned it to the photo scan the one in the middle again is the CT scan how does CT scan will measure the thickness Of the pipe and the one on the right is what the our device right now generates and I can see there's a very good correlation between what we do versus what CT does and again keep that in mind this is a piece chopped off in the lab we did it the actual value is being able to do this under the ground in a
very difficult like far distance and due to this scale like being able to do this for like kilometers of the data that's Where the value is um and this is the last one uh last release product this is called Barbie car 4 for you see the the problem this tool is trying to address is that when something is blocking your path and you have no idea what it is because it's just in the middle of nowhere just know there's something but you don't know what it is and this is where this tool comes in and
you can see there again there's a Centralizer in the beginning but there is a mechanical arm in the front that tries to inspect basically your region of interest to figure out kind of what you're looking at and for those of you who participated in a workshop you looked at these data um where the the robot collected a bunch of 3D volumetric scan and the goal was to see can you make sense of what you're looking at this is a closer look at the device and you can see the mechanical Arm and this is the one
on the image on the right shows you when it's parked obviously this is a very delicate robot you just don't want to you want to be very careful with it so the robot is always parked until you get close to the inspection area then it comes out and there's the inspection for you uh this is an example of again doing lab scan uh what you see was what uh in the middle of another bigger pipe so imagine you Have a big pipe and there's this piece in the middle of it and the tool scanned it
and you can see there's a we can do a very good uh digital tuning of what was actually in Dubai again I'm playing around with light and stuff keep in mind it's all synthetic there's no these flashlights and that's why I'm bringing it back to the visualization that's another active area like how you having collecting this data is one thing but being able to visualize it in a way that It's like it's appealing and it gives you the most value that's another thing that requires attention and the last one maybe this is just a rendering
of what the forward standard scanner showed you looks like uh the robot as I show the animation the moves around and we just put these data or slices back together and we are able to reconstruct the volume that's looking at and you can repeat this as many as you want just to get better images Um Maybe here's another example of what we found down the pipe I mean wants to guess what it is any vital gas turns out to be a ball so it's it's actually pretty impressive if you think about it somewhere in the
middle of nowhere you have no idea what's going on and you just this tools gives you a chance to look at it and inspect it and analyze it and figure out What you're looking at so that's kind of in a nutshell what the company does in general uh next I'll pass to Jason to go through all the data available this data where the machine learning comes in and all the initiatives that we're doing on a machine learning side all right thanks Rosa so as Reza uh said you know one of the challenges that we have
in fact is not too little data it's too much data uh and so how do we approach that problem And what do we do with it and how do we deliver real business value from that that challenge it's not trivial um interestingly so you can see 1.2 plus billion uh images captured I believe uh the current number is close to 1.8 and these are only probably months apart so the more the product is used in the field clearly the the volume goes up at a pretty rapid rate um you know if we think about the
sort of business challenges that the company Has you know there's sort of three big areas I mean there are many areas but there are three big areas first is Imaging we've heard a lot about that from Reza so I won't repeat that but the second is this problem of data management what do you do with it and so we have obviously software engineering teams or you know um uh building sort of state-of-the-art storage architectures to be able to um not only just like literally get it Off the device in the field to the cloud so
that something can be done with it but also to be able to produce real business value from it um in a timely way because these are very very large data sets and then finally that active visualization that active analytics what do we how do we communicate what it is that we're producing and capturing and how do we you know literally produce the value from that information With our our analyst team so I'm going to talk a little bit about this third one quickly for you and give you some grounding examples of of where we spend
our time and so um if you think about it uh you know you have that radial probe there uh which produces field measurements um it's captured by a capture device on a truck via you know this these are tethered devices uh it's uploaded to the cloud Um where for us as uh AWS um and then in when when it's when that upload is finished it's downloaded to uh local local machines or cloud cloud devices that do processing where human analysts team of human human analysts work on it um and you know fundamentally uh do very
complex analysis uh on large volumes of data in very short periods of time like turnaround can be you know a day uh and these are like intense intense activities and then they produce A report so fundamentally as a company this is what we're doing we're producing reports for our customers on the health of their asset to resist point from earlier how do we think about this when we identify machine learning opportunities this is very much a sort of business way of thinking of this problem set right it really comes down to thinking about automation right
we've heard this from both Paul and Raj this this idea that There's these the potential for for both augmenting the human and I'll talk a little bit about this in a second but also I'm thinking about what automation opportunities are so if you think about the opportunity of automation you think about uh you know a class of methods that we can apply to that opportunity and then also think about it in the context of what the analyst is doing and the four things you see here are what analysts or analysts do literally every Day all
the time and like this is the vast majority of what they do so I'm going to give you some examples here of what they look at and what we try to achieve for them through machine learning on the left hand side of each of this pair of images you see that raw View that raw signal and the analyst uh you know one of the things they're faced with is what's the surface and you know with annotation They are able to get a real good sense for the surface obviously they have to at some point through
that large scan have to adjust it and that also then brings up this issue of what does tooling look like right and so you think about what does it mean for the human to interact with this particular model or this particular output and how do you get them to adjust or improve as quickly as possible right because if throughput in this particular case is important how Do they do that in meaningful ways obviously you have to be robust to a wide variety of signals and circumstances and still be able to give a good surface in
this case similarly thinking about it with thickness um you know that that thickness probe the output is uh you know what the report is expecting is what is the health of that asset right in terms of the corrosion and so on a similar problem Um one that is a little bit uh different that is this uh the sort of automated detection of perforation um and you know as a machine learning team one of the things that we try and do is provide reference points as guides for the analysts to be able to literally guide uh
where how they work through a large volume of perforations because these can be quite significant these are here you can see um a um that unfold the tube view image That Reza talked about um and then the MLM annotation you might be able this very small I apologize but again you get a lot of noise and a lot of artifacts and these signals and you have to be able to be robust to identify what is a true perforation uh so that the analysts can go look at it on the left hand side you hear you
can also see that tube view the cut view where a perforation uh will show up and from a tooling perspective what's really Important is uh enabling the analyst to be able to use multiple views to be able to verify and identify in an effective way right so they they themselves will use multiple uh tools and then finally just being able to size it again uh on the left hand side um no MLM annotation and on the right hand side ml annotation um what's on it's very difficult to see I apologize again but on the bottom
here Uh this is obviously a different view this is that cut view but being able to um you know sizing is a particularly interesting problem because it it's temporal and so it changes over time so being able to understand how again to get annotation to reflect the change of the perforation over time it's a very interesting Challenge and in the case of perforations that change shape through the thickness of the casing itself how do you identify what is quote unquote The size of the perforation when in fact the size of the perforation changes and you
may not even have a very good view of the perforation size on the back side so these are very complicated problems you can see how human training experience and frankly intuition are critical in uh in in being able to assess and analyze so as a machine learning team we look at these activities that the analyst team are doing To be able to help them so really in thinking about it in sort of you know business objective senses obviously improving or increasing the speed at which they can do the analysis is important I mean that's sort
of obvious I suppose I think the second though is really thinking about how do you improve the variance between the and the analysis the at the output of an analyst this is an interesting problem to think about when you produce a report for a Customer you want to have consistency in how you communicate what you've found and if you have a large number of people who might have varying skill sets doing that analysis how do you help them via ml artifacts get to something that has less variance in terms of its communication and then finally
and we've heard this we've heard this before I think Raj talked about this as well really identifying areas where we can reduce repetitive Tasks a human is useful in the areas where we don't you know where things aren't obvious where they need a certain amount of interpretation uh and really you know thinking about the value of that person and what they can offer and reducing uh the stuff that is not high value for them or high value for us having them do are really great opportunities for machine learning um so that's just a little bit
of an Overview of how we think about uh our opportunities machine learning at Dart vision and as a team uh and uh what we're working on and that's it all right thank you um it's time for a coffee break uh we'll be back in 15 minutes thanks oh that's right yeah uh so let's start so what I'm going to be talking about today is uh is Blended acquisition uh so I come from Uh let's say from a geophysics background but it applies to entity as well so here on the left we see our acquisition device
and we have an object that we want to probe and then what we do in conventional acquisition is we fire a source and uh okay waves propagate through the medium and after they've propagated then we wait until we fire the next source as we see coming in here and the reason we want to do this is because in our Imaging we Need all the individual shot records that we want to use to do the Imaging later but there exists another acquisition modality called Blended acquisition that we show here on the right and what that does
is it fires the sources at a reduced interval so here after we find the First Source before we've recorded all the data we already see that the next shot is coming in and that is what is uh Blended Acquisition um the problem we've done this acquisition though is that we don't get the clean shot get it so here I show uh here on the left a clean shot getter in the middle I I show what it's called a pseudo de Blended shortcut so this is when you acquire the data with uh shots fired and reduced
interval then here we have the receiver Getters in here all the way on the right we have the suit of The Blended receiver get us and what we see is that the coda that we have recorded are now um contaminated with some noise now in the shot Getters this appears as coherent noise but luckily in the receiver goddess this appears as incoherent noise and when we zoom in we see a little bit better so what we actually see is that uh via the studio you're blending the noise that appears is trace-wise coherence so we have
a Longest traces we have noise that we later on have to filter uh and the question is well why do we have to filter that well if we do the Imaging without any processing then on the left here we see the image that has been uh obtained with imaging with the clean data and on the right we see the image that has been obtained by Imaging with the pseudo de Blended data and you see it's completely corrupted by noise so it's clear that if we want to have an Image that resembles this we have to
do some pre-processing so here's the outline of the talk I'm gonna uh first introduce the blending operator so this describes the physics of what's actually going on when we do Blended acquisition uh then we're going to talk about self-supervised denoising uh and what that we are introduce our algorithm start uh BS and this is designed to filter this trace-wise noise that we saw in the in the introduction Uh then I'm going to talk about the Plug and Play methodology that allows us to couple the blending physics with the machine learning and finally we come to
our proposed algorithm SSD blend and I'll show some experiments and a conclusion so uh the blending operators actually rather simple it can be mathematically described as just some um some time shift operators that we see here so we have the Blended Data that can be described as a linear operator applied to the clean data that we have over here and then we see it's just actually a sum of all the shot Getters that we have acquired now the firing time for every shot constitute the blending code and what we actually need to do is we
need to make sure that there's some Randomness in there because if we don't do this then what starts to happen is everything shifts along to a predetermined sequence And you get coherent events that you cannot filter uh so typically we have like a nominal firing time which is like some fixed um period that we want to reduce the acquisition and then we add some random data to that uh and then typically what you like to do is you like to solve an inverse problem because you have sorry let me go back you have the clean
data here you have a blending operator And then and that describes your Blended data but this is of course heavily underdetermined because you're acquiring shots uh in a way faster uh setting so you need to apply some regularization here and for our regularization we propose to use what is called a self-supervised denoiser um now I think most of you are familiar with um self-supervised machine learning so the idea in Self-supervised machine learning is that you do not need any clean labels rather the uh the data that you use go both as input and as labeled
into your network and that's what we see here so on the left we see this data that is contaminated with the noise and once we feed it into the network uh we actually compare it with the output itself um but of course if you just do this in a naive way you're only going to learn The identity so what we're doing here is we are creating a blind spot and that means that we filter out one specific trace and the network only sees everything above and or let's say to the left or to the right
of that trace and the idea being is that in this case you're doing some type of averaging so you're forcing the network to learn from the neighboring traces now since the signal is coherent along those traces but the noise is Incoherent the network can only infer the signal and the idea is actually kind of similar to what we to a very basic method that we've been using for a long time is called moving average where you just use the neighboring points where you just use the naming points to infer uh the point in the center
and then here's the loss function so you feed your image through the network and then you compare it with the image itself again so the Nice thing about this is that you don't need to do any type of pre-training or whatever you don't need any clean data you only use the data that you have from the experiment itself um but we want to also use the blending physics in here and that's kind of tricky because we don't really know how to link let's say machine learning operators to your physics and this is where the Plug
and Play methodology comes in Now and we're going to drive that a little bit here so this Plug and Play methodology came from um from the inverse problems Community from an algorithm that is called the admm and this is used to solve inverse problems where you have some type of non-smooth regularization uh so what you do is you make a variable splitting so here we assume that the data term is differentiable and the Regularization is non-differentiable we introduce a new variable Y and we use the methods of LaGrange multipliers to formats called the augmented LaGrange
here you see the LaGrange multiplier and there's this extra penalty introduced here which makes it what is called an augmented function and once we have this augmented lagration what we do is we simply alternatively optimize over all the variables so we start with the Y variable then X and the Z and while we Update these variables all the other variables are kept fixed and the Plug and Play uh breakthrough came from the realization that in this first step what we're doing is we're simply solving a denoising problem so what the authors of the Plug and
Play methodology suggests is uh instead of having like some very simple denotion here that is linked to a certain type of regularization why don't we just replace This by any denoiser of choice uh and when you do that you have a lot of flexibility because you can kind of devise your own um denoiser as we do here with the self-supervised enhancer and plug it into your inversion algorithm to have this interplay between physics on the one hand and powerful machine learning on the other hand and the physics simply comes in through the Second Step that
we see over here so Here we have a that is our blending operator and X is of course going to be the clean data and B is the the Blended data so that introduces our algorithm called SSD blend so on the first step we have this self-supervised denozing network where we do training on the Fly no clean labels or whatever required on the second step we have the inversion that corrects for the physics and then we Have a simple LaGrange multiplier update that's what we see over here so we did some experience with a real
uh data set that was acquired in a lab we have a plate here with 128 transducers with seven millimeter spacing the plate is 20 22 millimeters thick the sampling three frequency is 100 millihtz megahertz sorry and the uh the longitudinal velocity is about 5800 meters per second then there's a Lack of fusion flaw that we see over here so first we had to do some data preprocessing where we used some trapezoidal filter uh with these kind of frequencies that we see over here then we simply resample the data to 16 megahertz we did some filtering
to suppress horizontal events and finally we truncated without 1024 time samples just for the uh sake of the experiment so then what we see over here on the Left is the true data that had been acquired in the lab we did an artificial blending of course because this has not been acquired with Blended acquisition uh here on the right we see the result of Rd blending algorithm and here you see the difference so you see the difference is actually sorry it's actually quite small we do the same with the common receiver gather again we see
we that we could guide quite uh some good results now we have done this for What is called a full Matrix capture data set from this we also synthesized a plane wave data set and we did the same experiments for the plane wave data set it was quite a bit harder to get some good results but still uh it seemed to seem to manage quite well so now we want to compare like the reduction that we get in acquisition time from firing much faster uh versus the SNR that we obtain uh as a result of
our deep Landing algorithm so here you Nicely see the trade-off where you have in red the SNR that you get after the blending algorithm versus in blue the reduction in acquisition time so you see that the faster you start to fire the the more your data gets kind of deteriorated but one very important uh test that you want to do is how the Imaging is of course and that's what we did here so if you remember from the beginning we talked about uh Imaging with the pseudo de Blended data so again Here on the left
you see the Imaging with the true data Imaging with the pseudo Blended data and then finally Imaging with uh the best let's say the blending results so that is let's say the least reduction in acquisition time versus quote unquote the worst acquisition was the blending result and you see that for F and C in both cases you're actually able to get a quite a good image so we have presented uh in this work the Algorithm SSD blend which is a plug and play based algorithm that combines uh Power of let's say machine learning with physics
our algorithm requires no clean labels no pre-training uh because training is done on the Fly and the noise image access voltage input and and the label of the algorithm we were able to re remove most of the blending noise and produce high quality Imaging results and as we saw for this particular experiment that we can at least speed up The acquisition by 50 percent um and for FMC even up to 90 percent and with that I'd like to acknowledge my collaborators Mateo ravasi and also Carlos Costa who's been very helpful with everything NDT and debugging
some of the codes I would like to thank cast for the funding and all the experiments I've done with the pile up software thank you for your attention I think we have time for uh one question so first of all you mentioned could you Uh for the benefit of our remote so you mentioned it's um thanks so much by the way it is very well laid out um you've got this plug-and-play where you have the physics in one piece and your noise reducer another piece and you're bouncing back and forth between those and you said
you can change the noise module to suit your exact case so if you can characterize the noise you can tune that is the same for the physics like is There anything about that that equation that is required for your method the particular form of that or if you have a different physical constraint does this method would you be able to put it in a different physical constraint in that physics section well it kind of depends what you mean by different physical constraints roughly speaking you need some type of uh an operator that describes your physics
and a certain norm and that can be anything Non-linear over there but you need some what we call like data discrepancy so you know that the physics has to match uh the data okay yeah but given that there's nothing special about the exact no no person used okay so great thank you so much yeah the other thing I'm sorry I'm going to ask second question since I'm here um you said you trade on the fly yes how does that affect uh probe time like what computation do you need behind that to trade on the Fly
Is that pretty lightweight okay okay when I say training on the Fly means you're doing the algorithm so this is not during the acquisition so you have to do the acquisition first and then comes like this post-processing step where you have to actually do the training so in that sense it's uh slower than when you reduce something where you have a network that can just like denoise because we need to be doing the training okay but the huge benefit is is That you don't need any type of clean data or whatever so it adapts really
to all the geometry that you have there's no there's no issues there okay wonderful thank you so much thank you all right uh thank you we'll move on to our next speaker oh yeah all right thank you actually there's two of us so uh my name is Blake amberlo I'm a PhD student at the University of Waterloo and I'm Brian Lee I'm an undergraduate engineering student at the University of Waterloo and we also both work in the machine learning organization at debrief and today we're going to talk to you about our experience trying to apply
self-supervised pre-training to a task in M mode lung ultrasound classification sorry right so it is a brief introduction um we focus on point of count point of Care along ultrasound um point of care lung ultrasound so in contrast to what's been uh talked about today we're looking at Medical ultrasound um point of character sound is a rapidly evolving tool um that's using Critical Care scenarios um some in the clinical World call it Hocus Pocus but there really is nothing too magical about it um but it does have some very large Benefits clinically one of which
is that it's accurate it's as accurate diagnostically for some conditions as it's as accurate as chest x-ray or CT for some conditions it's very inexpensive it does not expose patients to ionizing radiation and lastly it's portable it can be brought right to the bedside and there's two major types of Imaging modes and pointed car ultrasound the first being B mode ultrasound and so we have two spatial dimensions and then We have our M mode ultrasound so this is what we're going to focus our talk on um in M modes it's it's a less commonly employed
type of point of care ultrasound has most of its use in one ultrasound and echocardiography and one who sets up Mo capture by taking a b mode image and then selecting a single axis to focus on and then when you look at the evolution of that axis over time so there's a brief discussion of self-supervised learning in our last Talk so I'll try to be pretty succinct with this so self-supervised learning broadly is a feature representation learning strategy that requires no labels um typically it's there's two steps in which it might be is useful the
first of which being um the pre-training part and in during self-supervised pre-training what we do is we solve a supervised learning task that requires no labels from the data Itself so in fact the labels actually come from the data and it's up to you to devise your own pretext task and then we design a self-supervised objective to minimize and then in the second half of that so what we get out of this is a pre-trained feature extractor in computer vision this is typically a convolutional neural net or a vision Transformer and in the second step
we conduct fine-tuning so we take those weights and we use it to initialize the Weights the feature extractor of a secondary model for a downstream task and in this Downstream task we usually have labels for this task and we hope that we've learned something useful during pre-training um that we that will be helpful in this Downstream task the key thing about self-supervised training though is that it does not require labels right so if you happen to have only a small fraction of your data which is labeled which is Common in medical imaging it's a useful
representation learning technique so we focus on the The Joint embedding architecture this is a broad strategy for self-supervised learning it's used a lot uh in the Contemporary fashion um and so what happens with joint embedding architecture is the two different views are sent to a feature extractor here denoted as F in the diagram you get features that come out of that which are sent to typically a Projector module which is often a multi perceptron what comes out of that is feature embeddings and um what usually we want to minimize the difference between feature embeddings of
related examples so related examples are those that satisfy this a pairwise relationship or they're called positive Pairs and self-supervised learning speak and and typically the paralyzed relationship just involves some sort of semantic similarity between any two Examples negative pairs consist of images that do not satisfy this relationship in the two broad approaches to self-supervised learning in the joint embedding sense uh this contrastive learning we're going to minimize the between embeddings of positive Pairs and maximize the difference in embeddings between negative pairs but in non-contrastive learning we dispense with negative Pairs and we focus only on
the positive pairs so reducing the Difference in those embeddings now there's a few kind of problems optimization issues with that but I won't get into that now you can come and find us at our poster if you're more interested in that so the problem that we looked at was can these existing state-of-the-art self-supervised methods can they provide value for increasing performance on a downstream task in M mode lung ultrasound we've seen self-supervised Learning um being useful for point of care ultrasound tasks with B mode but we haven't quite looked at it with Mo yet and
we assess it in terms of performance on unseen data label efficiency generalizability so evaluating on an external data set and then evaluating the qual the um the quality of feature representations by looking at saliency maps for explainability and so as I mentioned earlier we had a downstream task in lung ultrasound and The task that we chose to look at was the task of absent lung sliding detection lung sliding is an artifact that's visualizable on B mode ultrasound actually and M mode ultrasound and you can kind of see it here as a shimmering of the pleural
line that's this horizontal line you see at the top of the image here and you'll note that when lung sliding is absent you don't have that shimmering anymore of the plural line now this is also appreciable on M Mode ultrasound so um for the long sliding case we call this the seashore sign because the mo kind of looks like a Sandy Beach and then on the right side we have the the barcode sign and that's pretty self-explanatory why it's called that so we wanted to to train a binary classifier that could distinguish between these two
and furthermore sea of self-supervised pre-training would help us We had access to a large institutional local data set much of which is unlabeled we also had a smaller set of labeled data so this is a great example of the applicability of self-supervised learning we split it by patient ID into training validation and test sets and then we had three external data sets that were labeled on which to evaluate these models roughly speaking this is our approach during the self-supervised pre-training Method we use joint embedding methods including simclear Barlow Twins and vicrag the pairwise relationship we
actually had B mode videos so the pairwise relationship we constructed was taking two different end modes from the same B mode so two different slices through time and these actually would have the same label so long as they intersect the plural line in the B mode video they would have the same label for the uh the long sliding task so as is Customary and Joint embedding architectures we then apply stochastic data augmentation and those comprise are positive pairs after that's done we took the feature extractor and ported it over via transfer learning and fine-tuned those
weights on the label data and here's a couple of examples of images that satisfy the pairwise relationship we looked at two separate data augmentation pipelines one that makes sense more for um M1 ultrasound Which we devise and then one that's more standard so the bring your own latent or byol architecture for short or architecture out data augmentation pipeline for short this is commonly employed in a natural image self-supervised learning and you can see it consists of so so classically applying these Transformations some of them are not applicable to Ultrasound because we have our single Channel
images We also devise an M mode augmentation pipeline that we thought better reflected the natural variability of these images so that included additive and multiplicative gaussian noise and then additionally making sure that random crops of the image contain the plural line because that's very important for the interpretation of the long sliding artifact so the first experiment that we ran was to validate whether this custom Augmentation pipeline had some Merit over the more standard natural image pipeline so as you can see we actually saw that when we randomly initialized our feature extractor weights before pre-training uh
our custom pipeline actually yield ended up yielding better Downstream classifiers however when we used image initialization and then pre-trained off of that we saw that the more standard by L augmentation pipeline as we refer to It ended up producing better performing classifiers and I should note here that the metric that we used in basically all of our figures from now on is AUC and this is because of the naturally oh sorry the basically the imbalance that is naturally present because of the fact that this pathological case is much rarer so for from now on for
all the other experiments we used our custom pipeline when we use random weight initialization And then we use this byol pipeline when we use imagenet pre-trained initialization so the next thing that we looked at was a basic benchmarking study which essentially just Compares performance of these pre-trained these pre-trained and then fine-tuned or linearly classified classifiers with just fully supervised models and here we saw that with random weight initialization arbitrary methods did perform uh Noticeably better however the interesting finding here was that when we moved to image Network initialization we actually saw that this difference basically
uh was very diminished and we actually saw for example in the case of linear evaluation which is when we don't mess with the feature extractor weights in our supervised task and just train a linear classifier we saw that an initialization here the fully supervised model actually performed the Best which was contrary to what we might have thought going into this so next we wanted to look at whether we could uh more efficiently train classifiers using this pre-training so to do this we basically just decreased the proportion of the train set that we used in the
fine tuning section of like the self-supervised learning process so we actually ended up having pretty similar results to the previous slide we saw that When we randomly initialize our weights there's a fairly noticeable difference in performance and our pre-trained models perform better however when we have this imagenet weight initialization we see that this difference again is basically nothing and yeah in some cases our fully supervised models actually even perform better foreign the final thing that we'll talk about today is generalizability so here we wanted to see basically kind of the Other facet of the key
advantage of self-supervised learning here which is can we take advantage of more unlabeled data and basically just learn representations that in this case can extend better to other domains so in this case the the way that we tested this is that we had three different labeled sets from three external institutions and we pre-trained uh we for each method we pre-trained once with just a normal train set as we Did previously and then once including all of our unlabeled data which was a fairly significant proportion and here what we saw was that when we included all
of these unlabeled samples under pre-training we actually saw a pretty significant performance increases across the board or at least fairly consistent performance increases across the board and this in the medical image in the medical image domain is actually a fairly significant finding because the Fact that these data distributions are often seen to differ across different institutions for example due to things like patient demographics or just different devices used so just knowing that including all of these unlabeled sets all of this unlabeled data for pre-training can help with generalizability is definitely very important finding here and
yeah that was the best performing that was the best performing model Overall from these experiments so uh all in all here are some of the potential direct next steps that we found with given our results uh so for one we can explore whether the M mode pairwise relationship that we proposed here which if you recall was taking multiple end modes from the same B mode um whether that is actually effective compared to the more standard practice of Simply taking an image and augmenting it and treating that as a positive pair Another thing that we that
would be useful would be to look into developing more novel and better you could say data augmentation pipelines for end mode images if you recall from our results we didn't really see that our custom pipeline performed better overall so there's definitely work to be done there and finally we can look into trying to create more customized pretext tasks for this Emerald image domain possibly leveraging certain elements of domain Knowledge for example um just the fact that you know these mLs are taken from like the same bmode image and there's some element of distance there hence
that is what we have for you today foreign we have time for a few questions hi as an engineer could you just explain what lung sliding actually is in the physics of the kind of the images corresponds to absolutely so I I Actually realized that I forgot to to mention that early on in the presentation so long sliding is a clinical finding uh it's an artifact that's caused by the um the articulation of the two layers of the pleura of the lung um and that's why you get that shimmering appearance right um now this occurs
naturally for most of us it's normal finding one sliding because for all of us our normally Articulating when we breathe they're sliding across each other um in the case of absent lung sliding this occurs or can occur when you have gas between those uh two layers and so that's actually indicative of potential pneumothorax so this artifact when it's visible actually excludes a diagnosis of a pneumothorax as a result or it's 100 specific for pneumothorax um so the significant um clinical meaning in actually ruling out pneumothorax You're welcome sorry I didn't mention that earlier hi I'm
your Tech I'm actually a bottom and I and also I am working in forecast so it's really interesting so my question is about like the data and the so because like it's challenging to have this you know high quality uh image long images where you have like the clips where you have like a nice plural and like the you know between the Two ribs I was wondering if you if you have any type of you know uh images where you where you don't have you know quality like good quality videos because uh my question is
like did you have any sort of uh plural detection at first to like find the plural line and how did you decide on those points that you wanted to suffer that's a fantastic question so this actually was based on some previous work where we we did not Use any cell supervised pre-training we did a previous study um at our at the company debrief where we tried to just train a binary classifier only using only label data and that was one of the major problems we faced at the beginning right because um we only had a
limited set of videos uh and so it was actually really hard for us to train like for example like a Time distributed convolutional neural network or a three-dimensional Accomplishment neural network there were um like the model capacity was far too high and we were getting a lot of overfitting so then we made the switch to M mode but that necessitated us figuring out a way to actually identify which end modes in the plural line would be of candidates in this case it would be those that intersect the plural line so what we did was we
created a small labeling an effort in our company to label bounding boxes for the plural line And we trained an object detector separately and then we actually use that object detector like in the pre-processing to produce like these uh these end modes from the B mode videos that we had and it actually turned out to be surprisingly not a very difficult problem um the real problem was actually identifying long sliding so that's how we did it and then from that though because like you said there could be Breaks in the plural line like where you
have rib Shadows things like that what we did was we only selected um for that previous study the M mode that was actually the brightest the greatest total pixel intensity because presuming if you actually have something that intersects the plural line anything that intersects a rib Shadow is going to be significantly darker thank you for your presentation so I have a question about the data Augmentation so you you use some of the like the computer vision measure of the guitar I'm wondering have you ever invested investigated the how the data and all the meditation affect
geometry down because we know that okay General computer vision task is translational environment but some of the data augmentation may change the features of the the ultrasound it may change the normal one to the abnormal so so what's the the effect of different Data augmentation messages for sure that's that's a really great question um so we we try to be judicious in our selection of data augmentation Transformations um and in consultation with the clinicians that we work with um determine whether or not those augmentations those sets actually change their interpretation of the image um to
your point it would be a great idea to conduct an ablation study over Every single one of the augmentations in the pipeline we just didn't have the time of the resources to get that done instead we just focus on uh in that case just this clinical quality evaluation but it's a great question thank you a quick spot question about your your generation of positive pairs first of all you were only dealing with non-long sliding or did you have both categories those categories yeah and secondly you say that you take um from one patient Different slices
and first of all was there a distance that you went or did you exclude lung shadows as you mentioned and the second question is did you try going between patients and was that a bust or did you just not try it or we did not try going between patients um we focus on MOS that were taken from the same bmode video um and so to answer your question uh the way that we selected those were we actually use that object detection Method that we were talking about earlier that we had previously developed um to come
up with a set of candidate and modes that might intersect the plural line and then we just took the um the top 50 of them ordered by brightness as possible candidates for selection from one B mode video that's a very rational approach yeah sorry just to be clear um the reason we didn't take like we didn't try Crossing patients or we didn't try crossing videos was Because we wanted to stick to a more strict definition of positive pairs at least for this initial study okay okay thank you very much thank you um unfortunately our next
speaker uh did not show up so we're gonna move on oh you were here okay thanks foreign [Music] foreign I had a problem I said about that and I'm very happy to be here and I thank the organizers of this interesting workshop for organizing this topic so um part of the things I will be talking about to admissions in the previous slide so you will have some background of what I will be mentioning so I will be uh for the sake of time I will go directly to the presentation yeah so so mainly I will
be talking about the methodology and the component of our methodology and the conclusion Um so yeah before that I'm presenting this work on uh on behalf of my colleague and Dr Samir at Harvard Medical School and National Hospital so that's now the main structure and I want maybe to spend one minute or two because that's a new topic here now the the the topic is about um classifying between ultrasound images that could tell the liver and between images that don't contain the liquid now it's a classification problem that can Be solved using you know supervised
learning and many methods but in our setting there were two challenges which was the motivation of this work the first question was as a hospital we have you know thousands of ultrasound images so yesterday we're not short of data now but the the the the challenge here was uh most Radiologists or thick or you know Dominic domain experts in general don't have the time you know to label Thousands of images to change your supervised learning algorithm so that's why the simple part was was part of the method which was mentioned the previous uh presentation and
I was you know describe the method now the sitting challenge is we work with industry most of our projects are industry related so in other words what we develop will eventually work on some ultrasound machine So the the second challenge that came it was you know how can we use a simple okay algorithm that you know it works well with real time in a real-time setting and that's where that's why we use logistic irrigation and you know that we wanted to emphasize that to see you know if we can you know logistical religion is simply
a one-layer neural network it's very simple so the question was before you know going to an extent like will it do Any better like will we it might work but will it do a state-of-the-art performance or not and this is what the topic here so so we have the same Clear where we have the unbelievable data the train and then we use that on our Downstream task of classifying between images that have the liver organ or don't have liver organ using only one layer in neural network so the first part is the same clear so
Same Clear was um developed uh at the University of Toronto here and one of the authors is representing anybody working in machine learning or deep learning is aware of Jeffrey Hampton he was a recipient of the touring award along with his show being viewed in 2019 University of Montreal and uh University in New York and he's no longer with Google So that's why you know there's many uh like contrastive learning algorithms what we chose simchil are as you know different to this part of it so we thought something interesting now housing CLR Works basically so
that's like a high level explanation and in the next slide I will show you how both augmentations look like on ultrasound so it seem clear how it works and if you're aware of CMS neural networks it kindly you know have the Similar structure in the sense that they have the same code so how simple it works is that it takes an input image there are some like four or five augmentations used in this paper like like the image or or cropping the image so it produces only two uh augmented versions of the image and then
it will it will pass through okay so both augmented images will be passing through The same path so they will go through an encoder which is basically a computer neural network here and to the goal here is to provide a representation with that image now that's an image but what does that image mean to a computer so this is now a vector of numbers and it then passes through this is called a projection head a projection head merely contains of two so this this dense layer it's a Multi-layer perceptron basically so it's a simple Network
and the goal here is to get a representation that will be that I can use in my um similarity function so the goal here now of the so you can consider now there's many thousands of images coming in but the eventual goal is we have a similarity function that we want to learn until it's called the Essentiality function this generative function as mentioned in the previous slide in the previous presentation was to maximize the distance between images that don't come from the same source and minimize and maximize the similarity between images that come from the
same Source in other words those two augmented images belong they come from this Source they look different but they came from the original Source So Eventually so the humanity function will will be will have a maximum bum and in the same Clear when it works it will it will have you know a similar augmented images coming from the similar source and from a different shorts so uh the eventual goal the eventual goal is to have a similarity function that is able to distinguish between images that look similar or different but what does that mean for
our Downstream task Those are some samples of you know augmentation so every pair like we saw the image of the dot and there are where two augmentations or samples of the two augmentations how you know they look like using different documentations but all of them they belong to the same source so if now the algorithm when it sees all of those images it's not like and it takes the original image it knows that they all mean the scene But what does that mean to our Downstream task all the the goal of the Sim cleared here
is to produce a model that can eventually give us a meaning to that image because if we if we just use supervised learning which means in order to learn you should give it an image and what do you want to learn from that thing so the label in other words so here It's a binary classification problem so the first rule are images that have a liver so they will be labeled each of which will be labeled that it has a level the second row are images without a liver now if we just use the logistic
revision alone the algorithm will deal with any material as a raw material just roll it no means and that's where the hymns clear comes Into play where before before that image is fed to the logistical region it is first passed to the model the model will give it a meaning a meaningful meaning and then it will be fed to the to the to the logistical religion by this way you will see now that our challenge of you know using a small amount of labeled images would be sufficient using visual so if we look at some
results here so here that those are some results and this Table here show us the number of images third class so for instance we have two classes which liver this means we have 10 images that put 10 deliver and then 10 images and here and this represents the epoch they both means zero training your algorithm all your all your data and and how how many how many times you do that so there's 100 times and this means that You know you increase more you will spend time more but but we will see now you know
with the with the GPU and big Power that doesn't matter and the the point you take here is that if we if I ask the radiologist to label only 10 images I am able to like uh let me talk about the 50 images here because I have the volumes there so the the radio before doing before using Sim clear I was worried that I would ask her if you're just terrible South which will not happen but now with only 50 images I can reach a 1990 99 accuracy that my algorithm can tell me this image
contains the liver organ this image doesn't contain deliver order one point here I would like to mention is that like naturally like if we increase the images that quickly should be higher the a quick Point here to take into Consideration is that the images here were picked randomly and there's a field of machine learning called Active Learning and active learning deals with you know picking the images that have that ability to my model so it seems like from this data set like you know it was a bit randomly but for some reason those around the
religions were like um where you know very useful to to learning our model so that's why so it doesn't it doesn't have to it doesn't You know mean that the situation is always the same you know why why not 10 is better why but then this is where big trans women but but they take away from here is that even with 10 images I can reach 28 classification yeah and uh very quick here uh this shows a comparison with you know the with resnet which is you know a very uh well-known uh like supervised learning
algorithm and you can see now the Gap here like now now this is Considering using all the images so so we use around 1000 images and for both settings and this as you can see even with like even with few epochs we can reach you know um a high high accuracy I will just uh maybe wrap up here just to the conclusion uh for the sake of time so the takeaway here merely is that that using a self supervised learning approach can save us time And because I no longer worry about labeling a lot of
images as you saw telemages can bring you 98 accuracy and and the other thing is the future work that we're looking to here is that you know um sometimes the clinicians might be presented with thousands thousands images of different organs and they might want you know a specific organ to study so we can apply this thing and extract those organs in an accurate way Yeah and yeah and I will stop here and sorry about trash thank you uh we'll move on to our next speaker next okay yeah thank you everyone for uh showing the interest
in our work my name is I work as a machine learning research scientist for Global Health Labs Global Health Labs is a non-profit organization fully funded by Melinda gets foundation and we Work with Bill and Melinda Getz foundation and other other clinical experts to develop a smart Healthcare solutions for the developing World in this work we are presenting uh three video level classification algorithms for the to detect ultrasound features for the features associated with pneumonia foreign okay so I will uh describe a little bit about pneumonia so pneumonia is a lung Infection which can occur
one or uh in one or both lungs it can cost due to viral bacterial or any kind of fungal infection and it is a very deadly disease so you can see about uh 2.5 million die every year because of pneumonia and historically x-ray has been a method to diagnosis different um uh to identify pneumonia and uh and this is ultrasound ultrasound based Workshop so I don't have to explain how extreme ultrasound differs the only one Thing I would highlight that uh we are talking about here lung ultrasound so unlike OB ultrasound where if you do
Ultrasound with with a pregnant woman you can see the the limbs and the head of a baby in in case of a lung ultrasound whatever we are seeing in the image those are all artifacts and that's why it's uh so what we are saying is artifacts that's what it makes it very difficult to interpret and what we think that with the recent advancement of deep Learning and computer vision we think we can apply those new advancement in ultrasound imaging to understand what is going on in in those artifacts so there are three features there are
three features that we are interested in and also we think that they are highly correlated with pneumonia so the first thing we are talking about is plural effusion it's a buildup of liquid and this is how that buildup of liquid look like when you take a lung Imaging uh in Consolidation is also buildup of liquid in um in in sponge like uh uh sponge-like object within lung and when there is a lake builder for liquid there this is how that buildup of liquid look like with consolidation b line and merge VLAN is the case when
the surface of lung is inflamed and it is red and if you do lung Imaging on that this is uh this is what the inflamed lung look like um the one line that you see here is the B line and if you you can see b line in A healthy lung also but if you are seeing a lot of B lines uh and also if you see two or three B lines in a single rib space that's where it's a it start to become more serious case of pneumonia uh so we are using mind rate
dp10 ultrasound system we have two different data collections site one is adult uh where we are collecting data from Nigeria we are using CTS 10 to confirm if the patient has pneumonia we are collecting pediatric data from China and There we are using x-ray to confirm the pneumonia so from a patient we have 10 different location as you can see here uh okay so my mouse is not okay okay so as you can see we have 10 different locations here um and this is in efforts to capture the the entire part of lung uh overall
we have about 20 000 ultrasound videos and we are uh each each video is annotated by expert Radiologists to label one of the uh one of the features that that we Just talked about in case of consolidation and B line we also have frame level annotation available there is also one thing I would like to point out that in case of plural effusion and B line so if you play a video Loop there is a temporal information available and we think that's and we think that temporal information is also useful uh if you want to
develop any kind of algorithm um yeah so in this slide I would like to Highlight the organization of the data so overall we have about 700 pneumonia patients uh 700 pneumonia plus healthy patients and for each patient we have on an average 10 videos indicating from 10 different locations around the lung uh from each video we have about uh 90 average frame and within each frame we have we can have one or more features uh in in this work we are more interested in the video level learning so we are developing a video level algorithm
while Also using frame level classification uh so this this diagram uh explain our overall algorithm framework so for plural effusion we are using a one algorithm the input is a video and the output is a video score in case of consolidation and B line we are using a two-step process where the input is individual frame and the output is a score for individual frame I'm sorry I keep forgetting that I'm not pointing on this slide uh for Consolidation and b b line our the way we calculate the video level score differentiate what algorithm it is
and I will explain the more details about each uh each algorithm in the next few slides so for the plural effusion uh we only had video level annotation so that's why our overall approach is to use the combination of CNN plus lstm so CNN we are using a simple vgg style CNN feature extractor and those features are being passed to the layer uh stack of two lstm Layers there are two advantages of this approach as I mentioned earlier that we don't have to annotate each frame or each video and the use of the second is
the use of lstms helps us to understand the temporal uh temporal pattern and here so highlighting on this bottom part so the frame level classifier is a simple vgg Style Network which is giving us frame level score from frame to video in case Of in case of consolidation we are we we have individual frame scores and essentially what we are doing is calculating the mean of those scores and then come and uh using a learned threshold to identify if it is a consolidation or not we uh we try some other complicated method also but essentially
what worked uh was to just calculate the mean uh mean frame score in case of b line and merge bill and we Are using hidden markup model to uh classify a video we are finding a temporal pattern within uh different uh frame confidence across entire video so these are our overall results you can see um for consolidation we have really good sensitivity our specificity decreases if we are including SPC uh SPC and this is something a very common in any kind of healthcare application with the feature that we are interested in it has a Spectrum
of uh it it doesn't have a very clear decision boundary between positive and negative so almost all the feature that we are interested in we are interested in on a very uh on a classification boundary line we see very small size of those features those small size of features in case of consolidation it's called subplural changes in b line and virtually line it's b line and for plural effusion it's a very tiny effusion so any the them if The amount of liquid is less than one one centimeter we are labeling as Tiny effusion um clinically
it's not very clear if identification of these small size feature provides any information or it provides any clinical action towards the diagnosis of pneumonia so that's why we are excluding those very small uh small features in our holdout set so there are some limitations that we we Had obviously if you have worked with any kind of medical machine learning solution I think the quality of the data and the quality of annotation that's something that we have to work in a very iterative manner uh the other thing I would like to point out that all of
our data collection sites we had we had to train the sonographers and uh this is something if we deploy any kind of this solution in the field just to expect that that any Random person would be able to collect image in a very expert manner that's that's not realistic so that's one of the limitation we have is to collect really good quality ultrasound data and also although the results that we are showing it's on the video level so we are identifying these features on the video video level and connecting those video level identification to the
overall patient level diagnosis so there's some something also we are Working with other clinical Partners to identify what that process look like um another thing about pneumonia that just uh understanding uh these features about pneumonia with ultrasound that completely doesn't diagnose pneumonia there are other meta information or other information about the patient that we can add on top of lung Imaging to make it more uh highly sensitive and specific diagnosis of pneumonia There is one thing that we we are ah we can be really helpful as I was because we are collecting different areas we
are collecting data from different part of the lungs so we have 10 different locations and uh for example if we are seeing these features in eight of those 10 locations that actually uh that actually means that it's a very high level of lung infection we have going on and if you are seeing those features only one or two out of Ten locations that means there is a small amount of inflammation going on so we can use this these algorithm to at least identify the severity of lung infection so with that I would like to thank
all of our partner we um we will be presenting poster also so if you have any question and if you want to talk anything in detail feel free to feel free to join our post representation and with that I will I will uh I will see if Anyone have any questions thank you thank you yeah uh we have time for one question I I really should know the answer this question because I'm on this list but I realize I don't um the fusion used did not have frame annotations and the consolidation did and was it
why did we use the video level only with lstm for the effusion but use the frames for the consolidation yeah so So what we so plural effusion has more temporal pattern than consolidation so as the person is breathing so fluorine Fusion is a buildup of liquid between these two layers is called and as the person is breathing you can see the lateral movement of between these two layers and that's why we think that only video level information should be enough because there is a lot of temporal information that we can learn Whereas in consolidation the
temporal pattern is very less and it's also um if you are as the person is breathing you can see these features disappearing also with individual frames yeah thank you thank you yeah uh we're moving on to our next speaker uh Gareth Monroe he will give an introduction to uh the challenge that we had uh ongoing with this Workshop thank you Uh do you know where my thing is two noise great is that from everyone okay um so yeah as Carlos mentioned I'm going to briefly outline some of the uh points um of the the challenge
that we presented and the data that we presented um before the participants come up and uh kind of explain their Solutions um as he also mentioned I'm Gareth Monroe a senior data analyst at dark vision Technologies um so yeah all of this data was captured by the forward-facing probe it's used in phishing operations in the downhill space so very much like the everything has gone wrong uh what is happening in my well um they will use it to find out uh whether or not there is an obstruction and what that obstruction looks like so all
the scans will be completed within Like a cylindrical uh drill casing of anywhere from like four inches of inner diameter to like 13 and a half um and maybe a little bit more depending on whether things have really blown up um so because it's uh uh kind of a major issue uh response um the turnaround times are very very quick uh and the data quality um or the the well conditions present uh Are very very subject to debris and kind of anything going on um so both of those present a lot of challenges um in
requiring very experienced analysts uh being ready and on the scene to help out and annotate or uh uh segment the the volumes to present the client with actionable uh direct measurements of what they can expect to find within their well uh and what they can expect to do about it uh to create Uh successful phishing or otherwise operation um yeah so uh fishing is kind of a term used for uh like I mentioned before anything that's gone wrong somewhere down there or something something that's uh present in the well that shouldn't be there so phishing
operations would be them uh taking our images and going and using some sort of basket or hook or drill to deal with the fish that we find yeah Sorry inside baseball yeah so the as I mentioned before the varying data quality uh and features present um make it very difficult to complete to create a comprehensive automated solution um the current kind of process that we employ is uh we take uh numerous passes uh resident actually showed a little video of one of those passes taking place it's a vertical phased array 192 Elements that rotates to
create uh several volumes that are then added together to kind of create a full picture um so yeah those are scan converted and inserted into a volume we apply a few pretty basic uh like brightness rescaling pre-processing steps uh and then the largest uh part of the work would be the creation of a volumetric erase mask so very much a segmentation problem Um that is handled mostly by an analyst as well as some other very helpful tools that we've developed uh up until now and then from that we'll create a surface because the the point
of all of this is direct measurements of the the features within their well so a volume is very nice and it creates a very comprehensive picture but it doesn't necessarily have that repeatable direct measurements component uh and yeah there you have like a very Simple picture of a single slice um some artifacts Some Noise Within one and nice and clean in the next yeah and here we have a full volume um that really shows many many examples of the the common artifacts that we're dealing with here so you see some uh this kind of light
blue stuff I'll point on the screen can you see it on the screen okay sorry online um yeah you can see the some electrical Artifacts uh in this banding as it emits out from the tool that's very very dim so very very easy to deal with and then you kind of get into the more complicated ones uh many many multi-path returns as you can maybe see the next slide I'll have a little bit more like over here multipath returns within the casing so a lot of reverberations a lot of signal coming back that's not necessarily
associated with a feature we want to Represent we also get a fair bit of thickness returns or multi-path returns from within the steel uh that we could if we wanted to take a thickness measurement from uh but for these purposes it's not necessarily what we're after oh uh one more example here um this big cylinder right here um may have confused some of the uh challenge participants previously um that would be associated with the Actual lens of the probe um so uh typically that would be cropped down with uh like your scan ranges um but
sometimes you have things very very close to the array so you want to keep that clipping to a minimum and you're going to end up seeing a little bit of a uh the lens itself yeah uh here we have another example that kind of illustrates um how the multi-path returns can be very Dynamic and very changing and often Look very very real and Discerning whether or not they're real is uh kind of a difficult contextual problem that takes a lot of time for an analyst to become good at and confident in that so in some
of these images because of the geometry of the the feature we're scanning which uh this one res actually showed previously as well it's kind of sheared casing so like a singular tube that has been split uh in the center Um split and disjointed kind of creates weird uh reverberations that create a signal where there is not necessarily uh features present uh the kind of primary one I'd like to point out is in the upper left cross section there um that kind of hook that extends to the left and above is not present and we know
it's not present because it's not within the line of sight between uh the probe like there there's there's real features between the probe and uh those Features so we obviously know we can't see through steel that well um so it's not real but that from an image segmentation problem is very difficult and I'm sure that uh challenges or the participants will talk about how they tried to address that uh because it's it's very difficult to include that context of a line of sight from the lens uh yeah so this was our evaluation metric uh the
Primary ones we use were chamfer distance and primarily and hosdorf uh distance as well and we presented our assessment code to the participants uh prior to the challenge so that they really knew exactly what they were trying to achieve um so sweet uh I will get the participants up I think uh research forego from ubc's first sorry research for good yeah uh Yeah so we'll we'll get you started yeah so we have a remote speaker at least Tang um to be the first one to present for uh the challenge one of the challenge results so
yeah take it away thank you I'm just gonna show my screen uh hello everyone you can hear me well and the screen is okay um the screen is now showing up just trying to figure out which um it's just this right one sorry Um foreign [Music] sorry uh Lisa is still not showing up maybe then um is it showing now [Music] it says the browser is preventing um maybe that's why um are you able to see anything right now um starting yep there we go thank you Okay I apologize everyone uh good morning um I'll
try to be quicker um just so um time losses recover um I just want to start with a quick recap of the data um so that was kind of interesting to me uh that the life shows the different data set uh that I got to download and the purple is the corresponding Mash meshes for each of the volume there are 85 volumes and five of them were labeled I personally I Couldn't leverage the remaining unlabel meshes but that could be a very exciting future direction to look at the dimensions are 7068 uh update 1028 I
did make an assumption of the Viewpoint so um and interesting to know how others have tackled that problem but this is all available on the GitHub repo for other uh to take a look um I think uh best way to go with this uh challenge was for me to kind of understand the meshes so I just I want To show some of the mesh's uh renderings um that I worked with um so it was interesting to see how uh their services um are not really consistent over time over the different samples you can see some
defects for example this one in different views I can see this is uh probably a normal pipe nothing potentially defective whereas this one may potentially be a defective mesh with some occlusions Inside that we are interested in extracting as well and another one with an object inside which I I'm guessing that we are not supposed to uh that we are supposed to detect as well as part of the challenge labeled um so Esther title suggests my Approach is really simple to go from the mesh data to an image volume um so the key question really
for me uh in the proposed solution is how to encode the meshes um so I just use a Very simple approach on nearest neighbor to encode the positions future work may look at for example features and that may be more potentially Irrelevant for the segmentation problem but once the encoding is done uh everything else is straightforward you have training images the mesh volume encoded interim volumes and of the original ultrasound feed feed into the training base I think any algorithm could be used including those presented by previous speakers and then The question comes from testing
is basically new volumes including the ones that have been unlabeled potentially being used for the training of my Approach um and then after decoding to the binary map ask kind of any ISO surface reconstruction algorithm could be used which isn't something we looked at in this solution but definitely something important to look at in the future Solutions Um so I um based on some preliminary analysis I didn't seem to matter how the the binary masks are encoded I tried dilating under masks to make them thicker I also try saturating the the surface points to make
the loss function easier to be optimized um it didn't seem to be too much importance in the end results so just give you a quick review of the one encoding I guess any one of you could guess which match this belongs to is it Obvious um just tell you this is the fourth mesh right here and corresponding ultrasound is right here we can see that the outer um interest points are actually not part of the mesh that we are trying to extract um I'll just quickly go through the setup setup where basically I have three
volumes randomly selected for training and then use the other two volumes as either validation set or test set Um it could be done this way it could be done in an alternate alternative way more rigorous cross validations could be done for sure where we have Ensemble approach and then this is a slideshowing different parameters we looked at on how to encode as I mentioned whether image resolutions mattered the type of random transformations in the augmentation rather flipping horizontally vertically or even rotations how aggressive that should be done and other things Minor Details and number of
filters in a convolutionary networks we use the implementation presented in scientific reports open source so basically uh four uh five models were explored in this pipeline and show some examples kind of the preliminary results where we can see overfitting may have occur where there are artifacts when the input size doesn't show that surrounding artifacts some training requests uh plots just Appreciate um the potential overfitting that might have happened different scenarios I have kind of the parameters are noted at the topic to get in touch with me to understand them the better um and then more
visualizations here where the ultrasound inputs are placed at the bottom and I show the probabilistic outputs in the initial training phases um here is one where I'm seeing funny Ornament Christmas ornament here I'm guessing if the is this mesh here we can see that the probabilistic outputs are coming to resemble the input in the ground truth mesh um and a few more examples here is the quite a more obvious case for the first phase I can I think we can appreciate um uh that the lens that we mentioned we saw earlier on presentations and it
has not been um it did not go to propagate into the Output which was a better example and then just a few more from the non um the training data that did not have the Nash provided so which could be a potential potentially used for pseudo labeling trainings um that could be done in the future work some rendering of the extracted binary masks and then finally some quantitative measurements I couldn't get the um some of the um packages are working so I have kind of implemented my own traffic Distance so here I see the green
and the red Point clouds overlaid the distance measured with 73 for this example different viewpoints and now I could kind of appreciate that this surrogate measure does somewhat correlate to the actual measurements where this I can see the green and the red has a more of a disconnect compared to the bottom set here I have more of these tables in the report kind of reflecting these Measurements where I did the validation and test um and then how the trainers may have affected them I can see not uh they did not see any Trends which may
suggest that an ensemble coach may not have health because the way I have potentially created the random subset so we're not diverse enough um and just one I'll just pause um on this one again more results in the report uh happy to talk about but I want To end here with a thank you note to the organizer so far this very exciting and interesting Challenge and thank you everyone for listening to my presentation thank you foreign Thank you Lisa um yeah and I and I'd just like to announce that this was the the winner of
the challenge um and Lisa's uh research for a good team won five thousand dollars uh with this excellent submission so thank you So much uh Lisa I hope you enjoyed uh working on this challenge as much as we enjoyed reading our report thank you thank you so much I really appreciate that do we have any questions hi I have a very very simple question um what is the goal of this challenge that might be better uh answered by the organizers I guess yeah sure um so I can give a little bit of of an insight
into this uh so Gareth explained A lot about um how this data is acquired we had some talks early in the morning about how the state is acquired how it's processed Etc um but the idea is is essentially that we have uh dark vision as a company we have billions of data sets ultrasonic data sets that are acquired um in Wells and assets energy assets and they often have different sorts of objects inside of them and they need to be analyzed by our analysts but a lot of The um a lot of the processing has
to be automated because it's just this vast quantity of data and so this particular challenge is about taking these volumetric data sets um that are coming from ultrasound sensors and converting them onto meshes that can actually represent physical objects and that operators can look at and actually understand what these different tools are we had in one of the Earlier presentations we had a bolt that was shown as an ultrasonic data set and then the mesh representation of how that bolt will actually look like and it's it when you see both of them it's easy to
tell that they're the same thing but if you're just looking at volumetric data sets you can actually be quite tough thank you so much by the way um quick question so as you went through exploring Solutions what was your your were there any points that you thought Were like this was a critical decision or this was a really good trick to use or your favorite tricks that you employed or methods I guess I'll call them techniques that you would take to the next project any favorite uh things you found out um yeah uh thank you
for this uh uh I I I agree um I I think the um my biggest fan I find and um based on the results I didn't find Variants of the unit mattered a lot um you can see the consistency of the performance in the report and resolutions didn't matter activations uh supposedly should have some effects um but I have to say I didn't get to um perform external validation to kind of testify um the actual effects of each element I would say um I think the augmentation was kind of the determinant piece um I tried
for Example starting with a very harsh learning scheme where all the random application Transformations were applied versus you know progressively harder and harder samples are presented I do have find that um one is converging better than the other but um in terms of other techniques out there I'm sure there are many even the units have changed so much since since there's been Benchmark work so I'm guessing others may even look at kind of the newer variants I think the No new unit is another one that I was thinking that could be potentially would be the
go-to next go-to thank you um any other questions before we move on to our next speaker no okay yeah thank you Lisa thank you um we'll move on to our next uh runner up to this challenge uh Waterloo VIP please come up so okay Okay sure um so hello everyone I'm idra I'm from United University of Waterloo vision and image processing lab and I'm here to present our solution to the ultrasonic image analysis data challenge so um since some of the audience are not very familiar with the challenge I'll quickly introduce our the problem to
you so let's see on the left it's planes yeah on left this is an Ultrasonic volumetric scan we are referred as the raw skin in our presentation and on the right is our Target which is the um surface of the tube we are scanning and the project is basically very simple given the noisy raw scan you can play again given the noisy raw skin or going to reconstruct the surface in the form of either a mesh or a point cloud yeah Um so let me talk about our data preparation so the Imperial scan is of
resolution 1280 by 768 by 768 um to better resolve the problem we align the output format to the input format by convert it into an occupancy Grid at the same location whereas the same resolution um the conversion is conducted based on a distance based metric where we set a voxel grid to be occupied if the distance between Center and the nearest Surface is closer to the half length of the diagonal of that voxel so basically if it's a voxel is very close to a mesh surface we set it to be occupied otherwise unoccupied and here
is an example of the converted ground truth you see it has already been voxelized and at the same resolution of the output sorry and we formulate this problem as a denoising problem so on the left we Illustrated a raw X Y slice which is a slice that says parallel to the x y direction of the scan001 and on the right is the corresponding converted ground shoes we can see in the um in the input there are some outliers and some noise but we find the noisiest sponsor weaker and less connected comparing to the surface signal
therefore we got an expiration to use convolution on your network to process This problem because of the convolution on your network is ideal for perceiving local information and especially the connectivity um so a natural solution is to use a 3D CNN um but the problem to process develop metric data but the problem is the 3D CNN is two um computational heavy and the computational cost is prohibited prohibitively High because it scales by n Cube where n is their resolution so What we do is we reduce the computational overhead by using three different uh 2D convolutional
neural network to process the XY slice YZ slice and the ZX slices separately then we use a 3D CNN at the Learned voter to aggregate the results from three different directions and take the CNN that process the XY slices as an example so we use the standard unit structure because unit has a higher receptor field and we want to perceive a wider range And what we do is we passed five consecutive XY slices as a five channel input into the CNN and ask the CNN to predict the middle um to predict the occupancy mask for
the middle slice foreign we will convert the occupancy grid learned by the Learned voter back to the point Cloud by taking all of the centers of the occupied voxels predicted by the learn folder So let's look at some results um so the top row is a scan from on the scan007 which we don't have the ground truth there so the models haven't seen this um scan before and these two slides are at Z equal 480 C equals 640 and Z equals 800 and um the bottom row is the aggregated prediction by the Learned voter at
the same location we can see our model is able to generalize well on unseen data which because it makes like um clean and Accurate predictions and quantitatively our method achieved an F1 score of 0.18 with tolerance one which is a disadvantage because our model instead provides a dense Point called red construction which means at smoother area we will use a far more points than required if you describe the surface now while in the ground truth so we only have there is only a few therefore our model will be penalized in terms of the position and
also the host Of distance um because the host of distance is kind of like adversarial metrics where um you can choose a point and other people um want to mix maximize the distance between the point they choose and the point in the other point set but for other distance based metrics our result is comparable to the score from the first place [Music] um Thank you everyone and thank you for the organizers do you have any questions foreign so again we'll have time some for some questions um but I would just like to to uh thank
Waterloo VIP for their excellent submission they were runner up and they got three thousand dollars for their submission so yeah again thank you so much this has been uh great Um any questions maybe predict what my question is going to be were there any special actually two questions one are there any favorite tricks or methods that you found really made a difference or are you know turning points and then the other is a spot question you have these three projections and then you have a 3D CNN to bring them together was that a pretty straightforward
task because it seems you're just finding the intersection of Three things or was that a complicated question um okay so can you repeat the first question again text just your favorite tricks that you're going to take to the next ultrasound task I'm not sure it's techniques methods um yeah just the things you found really made a difference or you really found you needed to fill in improve your performance and so forth yeah I think For 2D um data my tricks is I think I would like to like to visualize it as the similar to the
first participant to see the data relationships and what kind of anomalies exist here and find the um better solutions that can adapt to this problem and um so another thing is like the similar to the first participant there are a lot of unlabeled data like um five label and 84 unlabeled data we are also tried some um unsupervised method for that but um from my end after I add some unsupervised loss the performance actually dropped so we didn't submit the unsupervised method but for any supervised method we have some um thoughts first of all is
uh I have the three cnns that are working on XY slides by these like and ZX slice I added like agreement loss to make sure that those three predictions predict the same thing or similar things and the second is connectivity loss I try to make sure if I predict if I predict uh Like um Standalone um voxel that is occupied with none of these neighbors classified as um occupied I penalized the model but after I added the model didn't perform better so I just dropped it before the submission and for the second question so those
four models are trained independently after I trained the model on x y y z and ZX directions I use them to prom to output logits for all of the scans instead of the hard label 01 and Then a 3D CNN is applied on 40 64 by 64 by 64 tubes to um to aggregate a 64 by 64 by 64 by three Channel input into a 64 by 64 by 64 um binary mask yeah that's how it works um I guess it's questions to be organizers as well you present the data as a 3D cube um
would the performance actually be maybe easier if you use the kind of natural Coordinates of the acquisition systems so sort of cylindrical coordinates because then you'd have um but I don't know intuitively it seems like there might be it could be an easier learning task oh okay um so if you want if we do not use our boxers um voxelization it's hard for like convolution unit to work if we are just Giving points then we need some Network that that takes Point directly at the input to processor data yeah a future moving Direction maybe use
another Network to predict um I offset um on the same on the occupancy grid which is at um 1280 by 7 68 by 768 and added on the center of the points maybe it will be more accurate but I think the current limitation is the points Cloud we predict is two Deaths yeah yeah and just just to add to that uh Paul when you have something that is predicted in a let's say a polar cylindrical coordinate system and you create a mesh there then you have to convert that mesh to Cartesian at some point because
that's where how you're going to process and visualize that data so it's not clear that that conversion will lead to nice visually appealing meshes Um but of course it's something that would need to be tested to to ascertain if it's any good or not any other questions all right uh let's think of speakers once again thank you everyone all right everyone um yeah just before I start the closing remarks again I'm going to remind you guys that we have uh posters that are downstairs in exhibition Hall a um yeah please go check them out after
This is done so we hope you have enjoyed attending our event as much as we have enjoyed putting it together we have learned about how Ai and ml has been reshaping Industries and their standards how it can be used for improving data acquisition processing and Analysis with the goal of providing more efficient and accurate Solutions in a variety of Industries we have also learned ingenious new ways of using industrial Data as explored by our challenge participants I am humbled and excited by the vast rise of the community continues to take in solving the present problems
over Aram I would like to thank again all of those who made this Workshop a reality my fellow organizers in particular mang Lu Zhao has been a an unreal Relentless organizer for this conference she has done you know pretty much everything that you guys have seen here today uh uh she Has touched upon those things um I would like to thank the speakers who have taken the time and their effort to come here and present their their work to us our participants volunteers and of course the computer vision Foundation I would also like to extend
a very warm thanks to dark vision for sponsoring the event and uh the Hefty prizes and for the challenge so thank you all and I declare this Workshop closed foreign