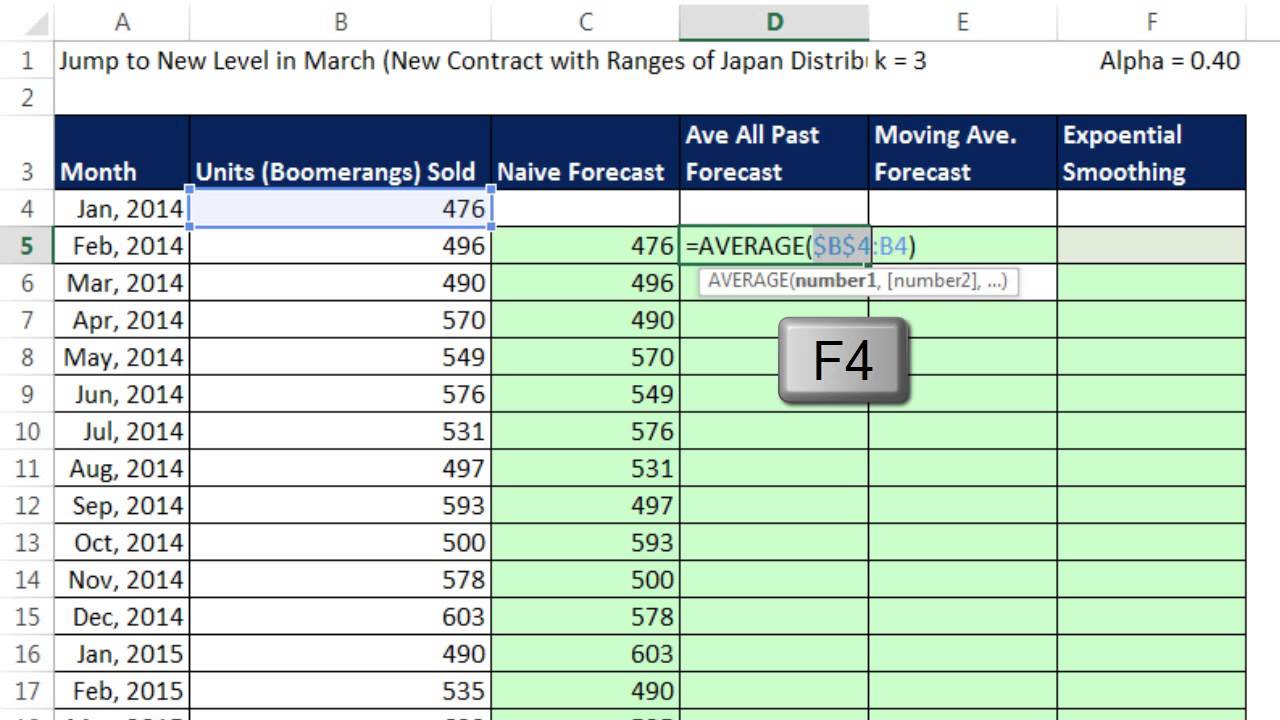
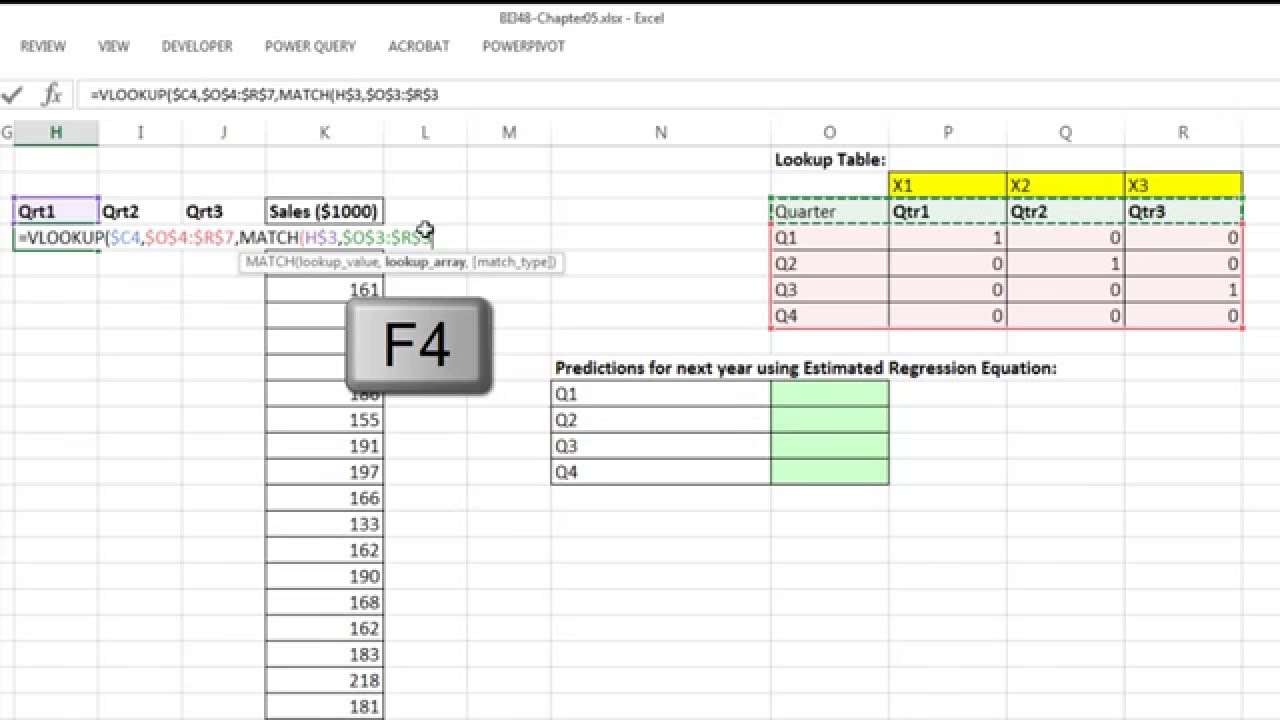
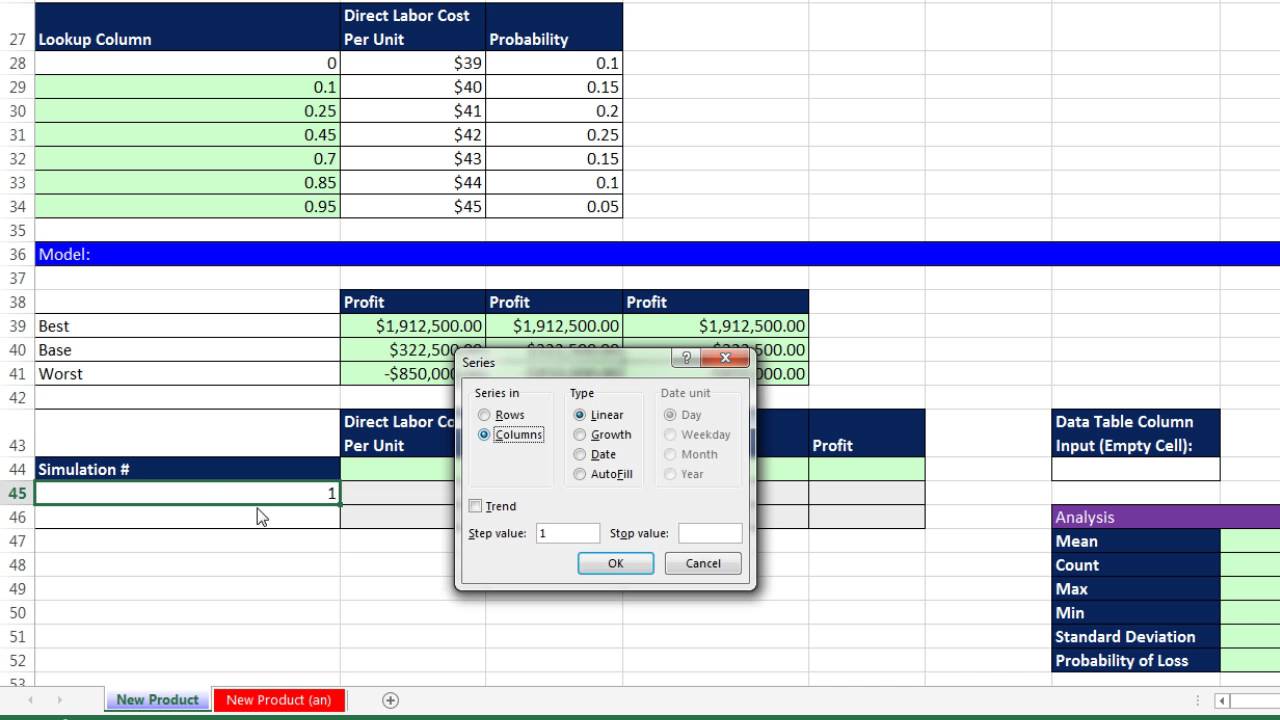
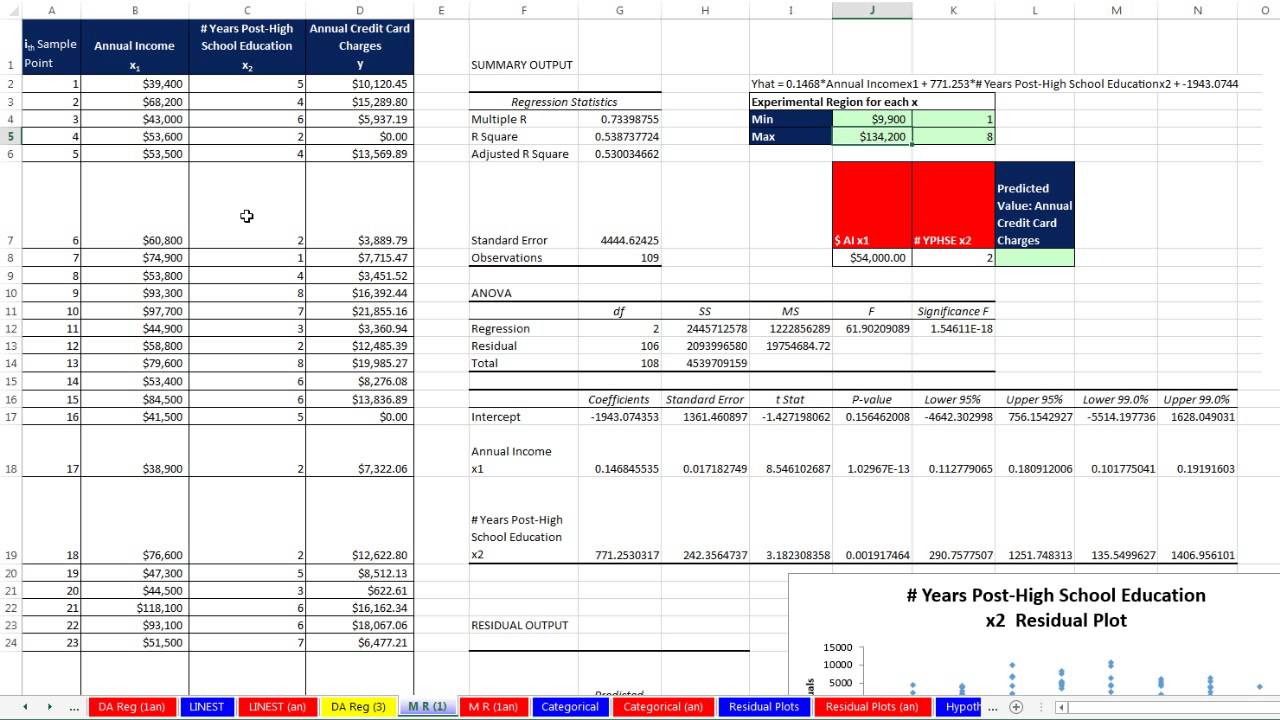
welcome to Highline bi 348 class video number 54 if you want to download this workbook bi 348 chapter 5 and follow along click on the link below the video hey last video we talked about charting a Time series to help us pick the right forecast method now in this video we're going to start on the sheet basic forecast and we're going to talk about different ways to forecast and different ways to measure forecast error now we're actually going to start over on our Powerpoints and you can download this file also forecast is simply predict future values based on past patterns now there's a caveat because forecasting is about the unknown future so although we try to forecast accurately we never know if the patterns we have seen in the past that we are using to make the prediction will hold into the future not only that but you never know what will happen in the future hey a couple famous people Yogi Bara in particular said it's tough to make predictions especially about the future now that's a little bit funny right but but it's true we actually don't know what's going to happen so we're going to do our best we're going to use past data to predict the future but if those patterns from the past don't hold then our predictions are not going to be very good now I want to go to slide 10 to talk about different methods for forecasting we're going to talk about in this video the n na method or most recent averaging of past values moving averages and exponential smoothing we'll see all four in this video and we'll use the same data set and see which one in fact is more accurate and the way we do that is next slide forecast accuracy or forecast error whichever way you want to look at it and we're going to look at four different measures mean forecast error mean absolute error mean Square square error that'll be the main one that we use to compare different methods and then a relative measure called mean absolute percentage error all right let's go over to excel now we're going to use the same data set 12 months that'll be the time variable and then the sales in a th000 bucks we're going to use the same time series for our four different methods and the first one we're going to look at is the naive method or the most recent forecast method and you can see over here we plotted this and this looks like a horizontal or constant time series now it's going to seem strange here because forecasting what is forecasting well we know 12 periods right and we really want to estimate the 13th but once we estimate this 13th we actually can't measure if that's accurate because it's about the future so the way we measure forecast accuracy or forecast eror error is by using our method on a bunch of past values and then measuring what the actual error accuracy is so this is going to seem strange at first but we'll try and get the hang of it now the most recent is very simple for period number two if we were sitting in Period number one and we wanted to forecast the next period we just use this value so the naive method or most recent is hey for period two we're just going to get the value from the past controll enter and copy it down that becomes our forecast now we're going to use this and do a bunch of steps to measure the forecast accuracy or the error but estimating for the next month me month number 13 right here we simply say hey we're going to take month number 12 now if you look over here to our chart you can see that it's pretty choppy right cuz we're using the actual value from last period so in this period even though our value turns out to be 25 our forecast was 30 because we used the value from the last period now in subsequent methods down here our next three methods this forecast will be much less choppy and there will be less forecast error one thing you can say about the most recent if it jumps to a new level of course this method would adjust quickly whereas methods of averaging don't adjust quite as quickly hey let's calculate our fourcast eror and this should seem similar to what we did earlier in the class where we calculated standard deviation like we took particular value minus xar or we calculated errors for linear regression particular value minus the linear regression predicted value well here for forecast error we're going to take the particular value minus our forecast all right so you can see it's positive4 that means we took our actual value subtracted the forecast our forecast is actually under predicting we get a net of four when I copy this down we're going to get some plus and some minus because if it is a random fluctuation around the mean like this then some will be above and some will be below here minus5 means the actual forecast method over predicted now for first measure we simply add up all the forecast errors alt equals and then enter and now we want to calculate a type of average and each one of these measures will be dividing by something now notice we can't divide by the count over here because this is 12 so we need to actually divide by 11 and the way we do that is we say n equals the count so I'm going to say the count of all these and our K is going to be the number of periods at the beginning where we didn't make a forecast and I'm actually going to do this in a very strange way I'm going to use the row function and now I'm only going to click on one cell how many rows are there for cell C4 there's only one now later we'll have multiple periods at the beginning and so we'll simply highlight it and we'll tell us the the formula will tell us how many rows there are even though there's nothing in that cell so of course we're going to get one because there's only one period we didn't make an actual forecast for so n minus K will be our denominator in each one of these calculations here so I'm going to say equals n the count of all the time series minus the number of forecasts we were not able to make and so we get 11 so for our mean forecast error we're going to say hey the total of all the errors divided by our n minus K now there's one big drawback to mean forecast ER of course that is is some values will be above and some values will be below so as you add these they'll tend to be an offset so of course in earlier in the class when we calculated deviations and residuals we always tended to square them our next measure is going to be called mean absolute error or sometimes not in our textbook but in other textbooks they'll say mean average deviation and simply we take the actual error amount and we want the absolute value so we use ABS contrl enter and that tells us the distance from zero now we can add them up there's the total of the absolute value for all of our forecast errors and now we simply take that amount and divide by n minus K now we could actually go over to our PowerPoints for a moment if you want slide number 19 has a formula for this there it is mean forecast error we sum everything up from time equals K remember K was 1 so k + 1 means two so you go from time two all the way to n all of your errors e subt is the variable we use to stand for forecast error and then we divide by n minus K next slide is mean absolute error we do the same summation of our errors except for boop boop we take the absolute value and then divide n minus K back over to excel another measure and the one that we're going to use most often to compare different methods is we're going to start by squaring the error and copying it down then we're going to add it up alt equals and then we're going to take that total of all the squared forecast errors and divide by n minus K and so we get 16. 67 if if we look at our formula over in our PowerPoints on slide 21 there it is the sum from period in our case 2 to n there's the error Square / n minus K back over to excel here so mean square error and mean absolute error these are actual measures a type of average of the error so really these are a measure of errors but the lower both of these are the more accurate the forecast me method would be and what we will do with Mae and MSE is we will compare these two to our other three forecasting method and methods and in particular the mean square error we will compare and whichever one is lowest that's the forecast method that we will use now there's a problem with mean absolute error and mean square error if we were to compare these measures of error or accuracy to a different time series that had a different time period like day or year we couldn't do that so what do we do in that case we create a relative measure so for percentage error I'm simply going to take the forecast error and compare it to the actual value so equals the forecast error divided by hey the actual value controll enter and when I copy this down I'll get some that are negative and some that are positive I'm going to add this up but of course that has the same basic problem there's some offsetting of the pluses and minuses so we will take the absolute value of those percentages ABS controll enter and copy that down now once we have all of the absolute values of the percentages we can add those up alt equals there's the total and for mean absolute percentage a we say equals hey the sum of all the absolute values for the percentages divided by n minus K and that will be a relative measure so now we can compare the accuracy of this forecast method for months to say a forecast method that was day or years now mean square error is a measure we're going to use in particular when comparing different methods so instead of using a formula like this which is looking at the count and the sum and a whole column of forecast error squared and then over here we're actually taking the difference between particular value and forecast for a whole column we want to see how to do that calculation in a single cell and the reason why is often times we have the actual values and the forecast method or maybe various forecast method and so for each Act actual values and forecast method we want to be able to calculate mean square error and we can do that we talked about this in the prere class and earlier in this class anytime you have a series of calculations like that which is Then followed up by this one and then this one you you can start with the very first one and work your way backwards so watch this I'm going to simulate this whole column right here and I'm going to use the sum product function now sum product the product part means multiply the sum part means add we've done this earlier in the class where we took multiple arrays and multiplied and added them but we also noted that if you use just a single array this function sum product can handle array operations without any special keystroke and our single cell calculation will involve an array operation now watch this I'm going to take the entire set of values same number as number of forecasts and notice that's a whole range of values or an array of values then I'm going to do the math operator minus right now as soon as you have not a single cell but an array of values or a range of cells in some operator you're doing an array operation then I'm going to say hey the actual forecasted values and subtract that whole range now if we highlight this and hit the F9 key notice I just simulated the entire column of fourcast Errors four minus four four F minus five there it is four Min - 2 4 minus 5 all the way down so right now I've eliminated that extra column now I'm going to contrl Z what do I do with the errors over here I Square them so I'm going to do my second array operation which is take the result of that subtraction array operation and then carot 2 to square it now it'll do a second array operation squaring all those here I'm just going to click that F9 to look at it and there I've simulated this entire column so 164 1625 164 1625 all the way down contrl z now I can simply to get that value right there close parenthesis and the sum part will add again this is is using the sum product function just because it can handle array operations without any special keystroke if we didn't use Su product we'd have to use the sum function and a special keystroke control shift enter but I can simply enter that and that's the numerator part F2 now I need to do n minus K but I'm going to be smart about this n minus K is simply the count for the number of forecasted values and I'm going to divide and then I'm going to use the count function and I want to count the actual number of forecasts that we made in the first place and that really is the meaning of n minus K now remember the point of this formula is that we wanted ranges to make our final calculation of MSE only from the column with the actual values and the actual forecast values so when I close parentheses and control enter boom there we go all right now we're going to go down and do our next forecasting method and then after we complete all four we'll compare and contrast this is called averaging past values forecast method and what we want is here I need to take the first value when I get down here I need to average 24 and 28 when I get down here I need to take the average of 26 28 and 24 so when I get all the way down to the last one that cell right there will average all of these so instead of doing that manually there's an easy way we can use the average function and a special kind of range now I'm going to click in the very first cell and then type a colon which brings in the cell reference the same cell reference a second time then I'm going to close parentheses now I'm not going to copy it down yet I'm going to put my cursor touching the first cell reference and then hit the F4 key to lock just the first cell reference now notice that the dollar sign is is in front of the 27 but this 27 does not have a dollar sign that means as I copy this formula down that 27 will turn to 28 which will include that one then to 29 which will include that one it's called an expandable range control enter and copy it down and you can go to any cell and hit F2 notice it's expanded and there's that 28 the dollar sign in front of the 27 stops the 2 from moving no dollar sign in front of the 28 means when I hit enter and F2 that moves to a 29 so all the way down any sell you pick that's called an expandable range and that is another way to forecast now if we look at our chart over here we can see we're already getting a smoothing effect the actual forecast because it's not up and down up and down we're probably going to get a much smaller forecast error now let's come over and calculate our forecast equals I'm going to take the actual particular value minus the forast and copy it down I will definitely get some that are positive and some that are negative alt equals to add it up and enter now I come down here and whoops I have to do equals count counting all the values that's the n k equals and I'm still going to do that strange little rows we still haven't seen an example where that's kind of any benefit but that'll give us one here n minus K that's the number of forecasted values all right so now I can come to mean forecast error equals hey there's the total of the forecast errors divided by n minus K again that has a problem because the pluses and minus tend to offset so we're going to use the absolute value function to get the absolute value controll enter copy it down and I'm actually going to take that formula which is adding up the 11 cells above me and copy it over that way I don't have to keep doing alt equals now I can come to mean absolute error equals the total of all the absolute values of the errors divided by n minus K and there's our mean absolute error and you can already see as compared to our naive method it's a lot smaller mean square error I'm going to come here equals forecast error Carro 2 control enter copy it down now I can come here equals the sum of forecast error squar divided by R1 I'm going to do the same array formula as practice we're going to take some product why because it can do array calculations without control shift enter open parentheses I take the actual values the same number of actual values as there are forecast values array operator minus and I highlight all of the forecasted values close parentheses Carro 2 there's our second array operation close parentheses divided by count and I'm going to count the number of forecast values again the idea behind this formula is that we don't want to have to eventually do all these calculations but we want a method for calculating mean Square air only from the original values and our forecasted vales controll enter so we can see mean Square eror 810 compared to 1627 so far that's the method we're going to prefer now if we wanted to calculate our percent error there's the forecast error divided by our actual sales copy it down now I come over here and calculate equals ABS the absolute value copy it down now I can come over here equals the sum of all the absolute values of those percentages and I divide by 11 and there's our relative measure now we can clearly see this forecast method based on our past values has a much smaller mean square error so we would choose this one and our forecast would be equal equals and it's the average of all the past values and so there we go 26. 25 so we have an estimate here of 26.
25 we can see it there our previous method was 29 we can see it there now we want to think about this average here notice we just took all of the values now one disadvantage to doing this is if there is a sudden change in level then this method will be slow to pick it up whereas the recent method will almost instantly pick it up so instead of averaging all of the past values we're going to talk about our third method which is moving average forecast method and it's pretty straightforward we're just going to say we're always going to average the last three values that way if we have a change in level this method will pick it up much more quickly than averaging all the past values would I'm going to start off by equals count all the values and when I hit enter this is where equals rows is going to be a benefit I need to get the information about how many values were missing and I don't want to type the number in so I'm simply going to highlight these three empty cells and rows will say how many rows are there from 51 to 53 there's three of them so now we can calculate equals our n minus r k and that is n that'll be our denominator for all these calculations all right so the forecast it's pretty straightforward we just use the average function and very carefully you don't want to include the one in the current period because this is the one being forecasted we want the last three those are relative cell references as I copy this down it'll always look at the three previous values so when I copy this down you can see at any particular time it's one over and it's got the three above so in the very last period sure enough the three above if we were going to do the actual forecast for period 13 equals average well we're just going to look at the last three and there our forecast would be three now our forecast error equals there's the particular value minus our forecast using moving average when I copy this down alt equals and I'm going to copy this one over right now oh looks like we're getting zero we don't even need to do this calculation but as a template we're going to say hey equals 0 ided 9 now I'm actually going to lock that with the F4 key because this formula as I copy over will always take the whatever the total is from above and divide it by that n minus K so I'm going to drag this over here absolute value equals abs and copy it down and so there I go there is the total already done and there's the division divided by n minus K already done so 2. 66 squared error equals go get our forast error and square it controll enter copy down oh and there's our mean square error of 10 so if we're comparing averaging all the past F averaging just the last three looks like for this particular data set that 810 mean squ error is going to be smaller so we would use averaging all of them now we'll see an example the all these data sets look like they're pretty constant horizontal we'll look at all four methods with a data set that jumps in just a moment now when we want to do our formula for mean square error all in one cell using Su product we want to do same calculation except for notice we're only going to highlight nine of the values and subtract our actual forecasted values car to close parenthesis carot 2 close parentheses and divide by the count of the actual values that have been forecasted there's nine of them and then I'll get exactly the same thing our percent equals the forecast error divided by our actual value I can copy that down equals ABS contrl enter and copy it down now I can come here I'm actually going to copy contrl C and contrl V and of course that one will work so there's our relative measure and we can see here we started here and it looks like it's pretty smooth now it looks like this one's probably a little bit smoother and we can definitely see the error but again this moving average will pick up any changes in levels more quickly than averaging all of the last ones now we want to look at our last method here exponential smoothing and it's a type of weighted average we're actually going to have our first forcast value looking at the most recent but all subsequent forecasts will be a weighted average we'll have what's called a smoothing constant or Alpha right here I have it set at 04 but this number can go from zero to one and it will wait it'll actually wait the past particular value a certain amount and the past forecast a particular amount and what we'll do is we're allowed to change this after we create all these and adjust it until we find the min mean square error so the way this works is equals and I'm going to take the last par particular value and that's a relative cell reference times the weight F4 to lock it plus the past forecast value times and it's the compl of alpha the smoothing factor F4 close parentheses controll enter and copy it down now if we think about this right now what this is saying is is this little bit is saying I'm going to take 40 % of that and this little bit is saying I'm taking 60% of that so I want to change this value and I'm going to start at one and think about that if this smoothing factor is waiting this if I change this to one that means 100% it's exactly like the naive method hey only look at the most recent but as I decrease this it increases the percentage that the past forecast is taking and it will smooth the line so I'm going to change this to and before we change that look over here we see the line it's exactly like our most recent forecast or naive method now when I change this to 08 you can see it sort of starts to smooth out5 you could see these values here and it's smoothing out now if I go to 0 four smoothing out more point two and what I want to do instead of looking at the line and eyeing it I now want to create mean square error and I'm not even going to bother with these columns I'm just going to do our one single cell formula that looks at the actual values and the actual forecast so you ready equals sum product open parentheses I'm going to do the actual particular values exactly the same number as the number of forecast we have minus actual number of forecast close parentheses car two close parentheses that'll give me the total of the square forecast error but I need to divide by the number of actual forecasts I'm going to use count controll enter there's the mean square error and as I change this 0. five whoa it looks like it went up a lot 0.
05 that would be a 5% weight for the last particular value and a 95% for the last forecast no that looks like it's 10 0. 15 15. 2 somewhere around 0.


![Excel to Power BI [Full Course] 📊](https://img.youtube.com/vi/gjnnqsdvAc0/maxresdefault.jpg)
![Build Your First Canvas Power Apps Tutorial [Hands-On Course]](https://img.youtube.com/vi/PEM5f9Xvn4g/maxresdefault.jpg)
