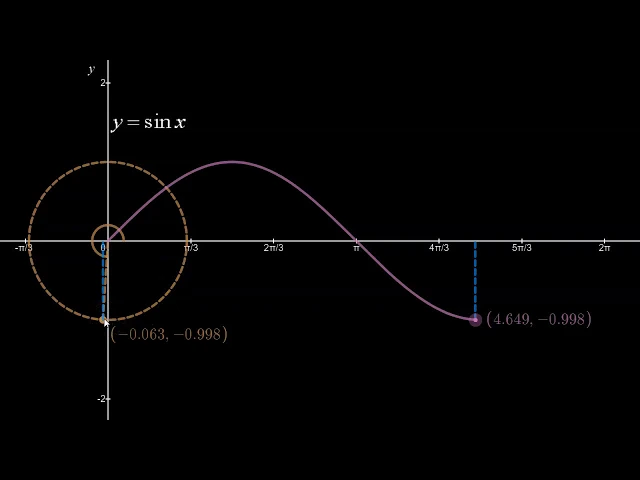
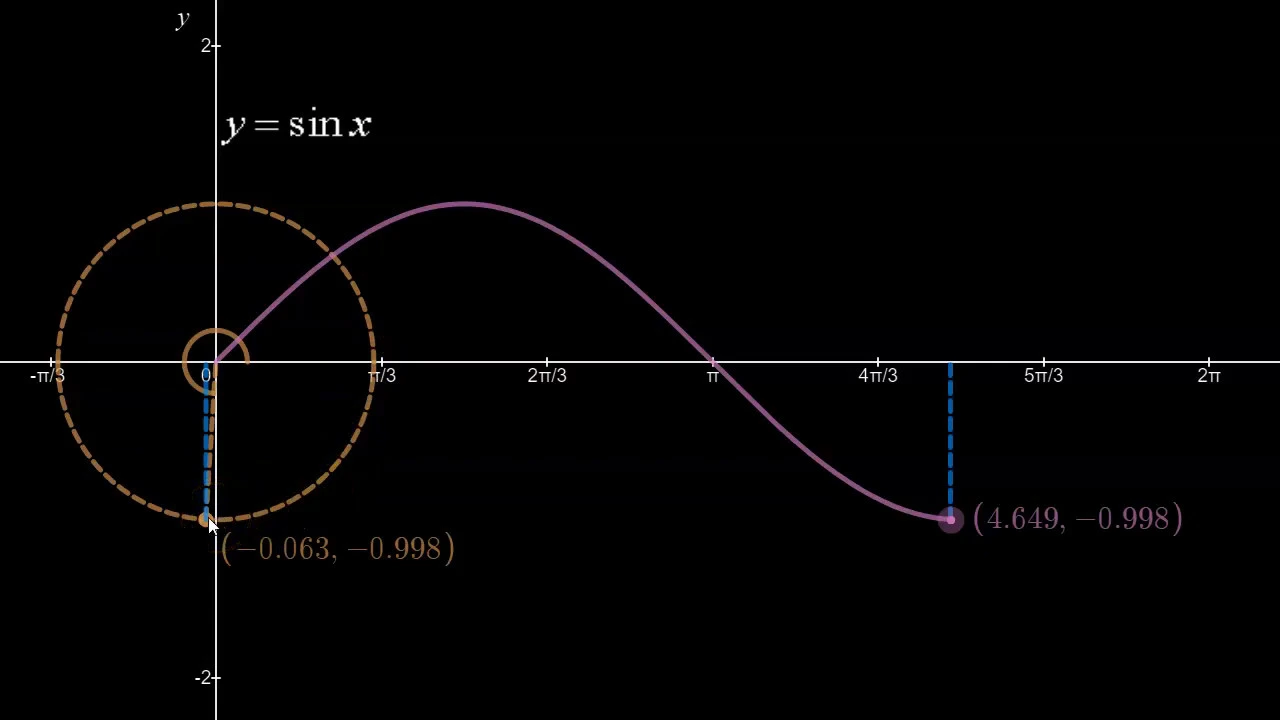
hey everyone in this video we will learn how we can generate the graphs of the sine and cosine functions from a knowledge of the unit circle in this unit circle I can freely rotate the terminal arm about the origin to create different angles in standard position now recall that the cosine of this angle this angle here corresponds to the x coordinate of the point where the terminal arm intersects the circle and the sine of this angle corresponds to the y coordinate of the same point so what would the graph of y equals sine X look
like what I want to do here is to create a graph of the sine of each angle versus the angle so if you were to think about a table that we might use for this graph in the first column we would have different angles say from 0 all the way to 2 pi and in the second column we would have their corresponding sine ratios or in other words y-coordinates okay so let's take a look at what this might look like using the unit circle so when I have an initial angle of 0 radians my sine
of 0 look at the y-coordinate is 0 okay so that's where our graph would start it would start with 0 0 0 radians sine 0 equals 0 okay so let me animate this for a few seconds here okay let me pause right there and let you know what's going on here so what's happened here is I've started to rotate my terminal arm around the unit circle and so the angle in standard position is increasing and as this angle increases so is my sine ratio remember it started at 0 and it's been climbing from 0 all
the way to 0.45 9 right in fact if you think of the sine ratio as the height of this right triangle you know that the sine ratio is just going to keep climbing and climbing and climbing and climbing until it reaches an all-time high of 1 so let's see that happen ok and there it is so it just climbs and climbs and climbs until it reaches an all-time high of 1 and now if you were to predict what the sine ratio what's going to happen to the sine ratio you can see while a it's gonna
come down and not only is it going to come down until I hit 0 but once it hits 0 it's gonna go into the neg and keep diminishing alright so let's take a look at that happening right so sign ratio is decreasing right because the the sine of the angle is decreasing okay until we hit pretty much an all-time low of negative one from there we've only got a quarter turn of the circle left but it's a more optimistic one shall we say because what's happening is we will anticipate that the sine ratio will climb
out of the negatives back to zero right so it's at an all-time low of negative one right now and it's gonna just keep climbing and climbing and climbing just as our pink graph is climbing and climbing and climbing until it reaches zero again okay so now if I were to allow this to continue to graph until let's say four pi let's just see what happens there okay so as I'm rotating around again it seems like I've heard this story before I'm just moving around my sine ratio increases until pi over two and then decreases and
this idea just repeats over and over again okay so I'll pause it right there before it hits four pi because it resets all right and so just by looking at the y-coordinates as we rotate around the unit circle we can see how the graph of y equals sine x is generated okay next let's take a look at the graph of y equals cosine X and for this I'll go back to this tighter window from zero to two pi now this time what we're gonna focus on for cosine is the x coordinate so if we're graphing
y equals cosine X using the unit circle we're basically taking a whole bunch of angles let's say from zero to two pi and then considering what the corresponding cosine would be and then plotting those coordinates right so plotting angle comma cosine ratio all right so what I have here is the beginning at zero our cosine of zero this time is one and so our graph starts at a maximum of one okay remember sine X started at zero zero Kosek starts at zero one the zero meaning the Radian the ankle measure in radians and the y-coordinate
in this case referring to the cosine okay don't get those confused right this is actually the the y-coordinate of the graph of cosine X but of course if you're on the unit circle you know that you're looking for the x-coordinate if you want the cosine okay let's let this run for a little bit okay let's pause right there so what has happened is we've swept through an angle or all of the angles in the first quadrant and so unlike sine where when we do that the sine just keeps increasing and increasing we started at a
maximum of 1 for cosine so the only way to go is down right so as we move this way and I'll show you again that this pink dot helps you write the pink dot is at the one position right now and the pink dot is moving towards zero so obviously cosine is decreasing it's getting smaller and smaller now it's 0.17 and it started at one and then when it hits PI over two it reaches zero and then as we continue into the second quadrant you can see that that pink dot continues to move over the
pink dot really refers to what's happening to cosine so you can look at the pink dot or you can look at what's happening to the x coordinate of the orange the orange point okay so it gets more and more negative and looks like it's going to get even more negative before we're done with this as we move towards negative pi so I'll just let that run to sorry not negative PI but PI and so this is the beginning of our graph we started at one and as we move to PI over two we just decrease
decrease until we hit zero and then as we move to PI we continued to get more and more negative until we hit an all-time low of negative one and now we start climbing out of the negatives right so negative point eight point seven point six point five four three two one zero the pink dot is rushing over to the positive side and right there is about where we finish and so again we reach a maximum of one okay and if I let this run until we hit say about four pi you can see that the
cycle repeats so again watch the x-coordinate the x-coordinate until it hits zero then it's getting more and more negative okay as it as it comes to an all-time low of negative one and then after that it starts climbing out of the negatives reaches zero again goes into the positives and proceeds towards that maximum of one so that's how we use the unit circle to come up with a graph of cosine X now to wrap up this video what I like to do is to show the graphs of sine X and cosine X next to each
other so there's sine X and I will remove the circle whoops okay so I want it to e to see the two of them and notice their similarities and their differences in some sense we can call these graphs siblings because they sort of share the same DNA if you will right 30 they have a lot in common if you consider their maximum points and their minimum points but they are also different and so pay careful attention to some of their properties that they have in common and that also sets them apart