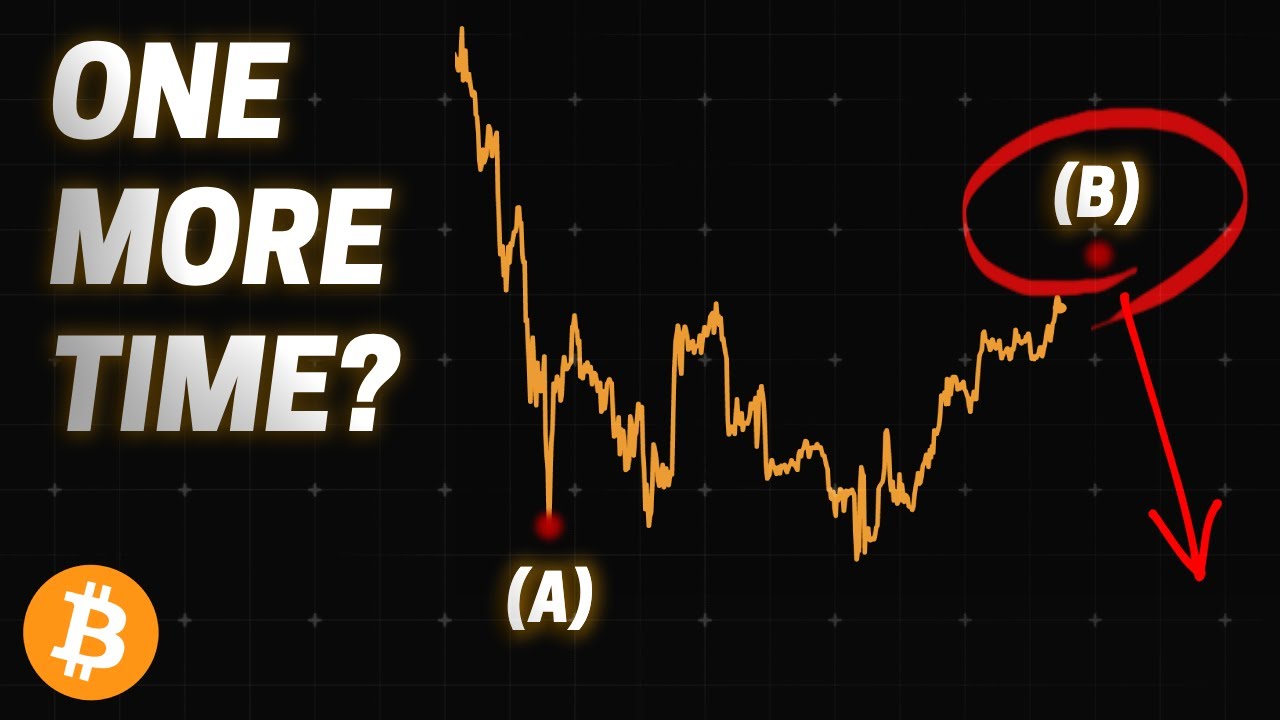
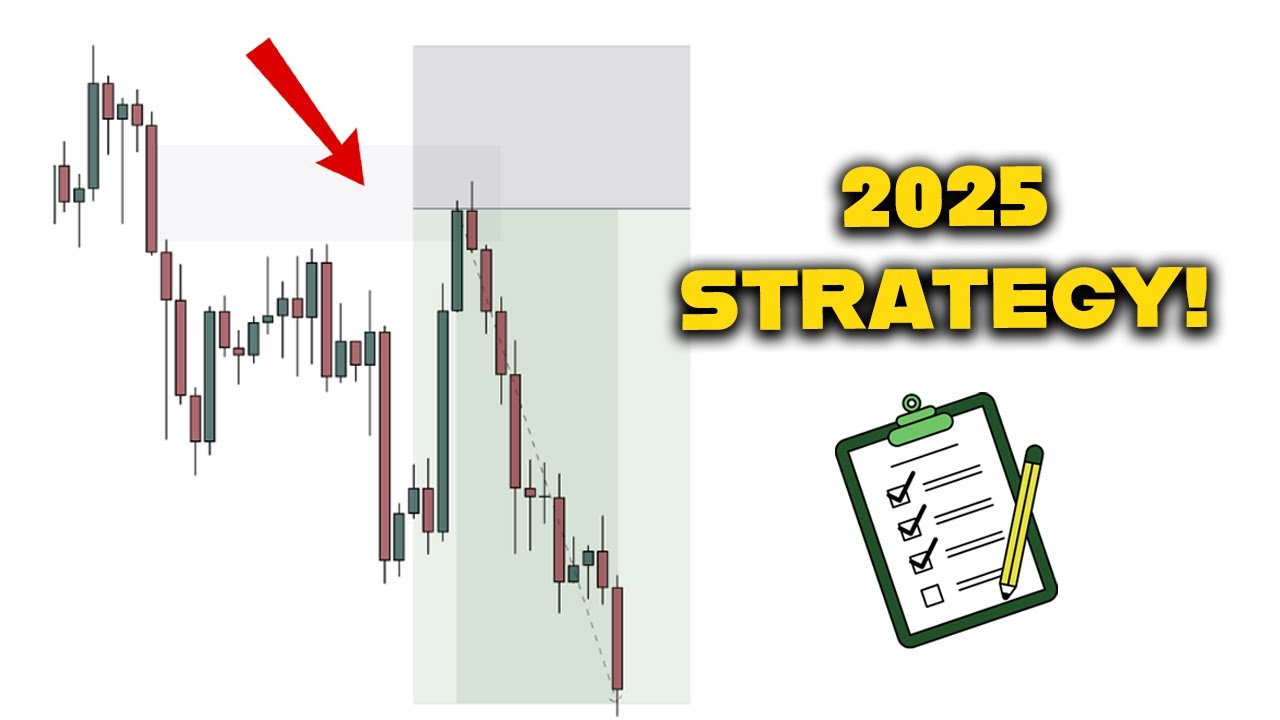
Bitcoin is setting up an epic failure here and in today's video we'll be going over what that means for price and when to essentially expect that as well in terms of timing before we get into that I should let you know that we're actually starting our new year sale for all of the New Year's resolutioners uh today we'll be running it for a week the code is 2025 literally just the numbers 2025 and that will award you 20% off of one uh off of any one of the programs or services in the teachable link in
the description below Quant Prime service actually going to be 25% off which allows you to create test and automate your trades um and that discount will actually be applied to the lifetime of your subscription and a couple of big massive upgrades coming to the Quant Prime and trade like Quant service in fact actually the Quant Prime Service uh it is already in beta form there I'll release a very short video later today kind of explaining it um but some really really cool things coming uh which I'm quite excited about and working on uh in the
background here all right sweet so let's get into the actual Bitcoin charts and what is this failure that we're talking about well Bitcoin put in a head and shoulders formation um which was essentially confirmed as a potential formation with that $100,000 rejective high right here in late December now of course a head and shoulders is typically a bearish reversal formation but as we said on this channel this one's ripe for failure now I did kind of expect it to go a little bit lower here to be fair um to actually like really fake it out
but looks like it is not going to be doing that and more importantly it is very very very very close to confirming the failure here and the failure for a head and shoulders is actually just as useful as uh as as as as a success I suppose because we can do an implied Target for this upon confirmation so uh we'll go over confirmation in a moment but the implied Target would essentially be the same Target except just applied to the right shoulder and that would be pointed up for CME here 119 to 20,000 bucks very
interesting now how would you confirm that this that this pattern has indeed failed and the upside uh Target is legitimate well we need to see Bitcoin close above that right shoulder again for CME that is exactly 101 435 if you do see a daily closure above there failure is confirmed and upside is uh upside is imminent um and as we've been saying on this channel for the past uh week or two now you know Bitcoin very likely to see at minimum for 114,000 bucks before the end of February so I I do look at this
as kind of playing hand inand with that on top of that we have a meta signal setup firing off over here this is this is um a kind of a new one as it is a continuation signal uh which you don't really get too often but I do see that this is coming from a 4H hour time frame and it did fire off right recently at around 999,000 bucks even and first Target would be 100 1,345 second target would be 103,000 and target number three would be 105,000 844 and 54 C by the way uh
of course these have varying degrees of probability to actually be hit Target one for December was uh actually I believe about 64 65% somewhere around there uh in the past it's been a little bit higher closer to 70% Target 2 uh close to about 50% and Target 3 close to about 30% so uh you know do keep your on that of course you are looking at meta signals um and you you know and you want to use this uh service you can check it out for free in the link in the description below and again
you know meta signals you know having these setups kind of just fired off to you well it's like having bumper rails in Bowling it's keeps you on track you won't be getting wrecked because it gives you well perspective areas of interest for a stop loss and then of course probablistic setups for UPS you know in this case upside targets all right now that we've gotten through that I need to make sure I'm right in my notes Here There we go okay yeah so here's the thing Intel Bitcoin does confirm this as a failure again which
which means that we must see a close above 101 435 on CME there is potential for another pull back here I know it sounds crazy I know I've been saying this uh for like the past few days now but it it is going to bother me until Bitcoin actually does confirm a failure I do think it's it's not that I do think it is a potential um to happen and if it does happen you know Bitcoin could easily reject right here come back down maybe set in a higher low somewhere around 95 to 96,000 bucks
so if that did happen I'd still look at that as an opportunity um I do think that this one will resolve to the upside it's more or less a a a question of when I suppose anyways moving on from there I do want to get into a few more tangible signals here um first actually just barely or let me go over here uh first we can see on the two-day time frame there is is hidden bullish evidence that was confirmed on the 2-day RSI and we are potentially going to see that 2-day RSI reclaim the
moving average on this as well why is that significant well because we can actually create a setup from that which I've done over here so this is a super [ __ ] simple super super super super super simple setup um I did post something a little bit uh you know a little bit more optimized in the Quant Prime library for the people who are using that um but of course you know even this in its in in it in its current form you can with a little bit of brain power optimize this uh significantly but
this again super [ __ ] simple setup right here anytime that Bitcoin on the 2-day time frame closes the RSI above the moving average this exponential right here open a long when Bitcoin closes below or sorry when when the RSI closed below the moving average close that long and if you would have done that throughout the the full history of Bitcoin you would have had these results you would have been successful about 35 a half% of the time but a very high profit Factor as you can see um when we go into the into the
performance summary right here we can see the average winning trade returned 40 I'm sure that's because of like the early massive winners and the average losing trade lost an average of 4% so let me actually go into the deep back tester here I want to get more uh you know I guess modern results let's say so I'm going to test that period from 2015 um to let's say should go exactly current as well let me just generate this report we'll wait and of course this is using by the way the Quant Prime service that I
was alluding to earlier but into the actual data we do see that the average winning trade yeah goes down significantly I thought I thought that that looked uh a little bit little bit exaggerated um and the average winning trade did return about 21.5% and the average losing trade losing about 3 spot 6 6% or 3 and a half% almost now also of Interest here when we did see a winning trade on average it took 12 bars when we did see a losing trade typically got closed very very uh very quickly with only three bars until
uh until confirming the loss so in this case Bitcoin has actually or Bitcoin the RSI is technically not crossed above the exponential moving average on a closing basis just yet it will as we can uh backwards forecast from caretakers RSI cross above the EMA signal line above uh with with the daily closure above 9,600 which Bitcoin is trading very close to right now so that that could be confirmed today if that does get confirmed you know I look at this setup I look at this setup over here and I look at the whole picture and
I say okay I continuation before any sort of a pullback until that happens however I do think that there is a potential for a pullback but it is you know there are more things shaping up towards uh you know upside continuation of course this does have you know a relatively low strike rate uh if we actually look at just this period it's a little bit under 34% um but going off of the the projected uh targets well if it does work out if it does work out we would expect somewhere around about 20% from that
entry so let's just assuming that entry would be kind of around here what would 20% look like on top of current price action if if uh if it were to fire off which could fire off as soon as tonight again um well 20% up from there puts Bitcoin where oh that's rather interesting 119,000 didn't we just see that as a potential Target for the confirmation of the inverted Head and Shoulders failure over here yes indeed and again um you know if that does play out we'd expect from the time of confirmation of that setup which
could happen tonight uh 12 bars and this is a two-day time frame so 12 * 2 is what 24 so it's about three three and a half weeks so yeah uh rather interesting right there or that was interesting what do you think I think that was also interesting um anyways my point is that uh you know if if you do see all these things kind of happening together I think that massively increases the likelihood that Bitcoin just you know puts in a [ __ ] Bitcoin ask move from you know from this region on top
of that when we go over here to stochastic momentum we can see the daily time frame for CME has gone for the full reset is now pointed up and will be remaining with upside momentum as as long as Bitcoin is above 95,200 which right now trading almost 5,000 or actually more than 5,000 bucks above that pivot nice not bad the two-day time frame is going to have a chance to turn up today uh if Bitcoin were to close above 101400 again that's by the end of the or sorry actually that's not today that that would
be tomorrow um it will turn up if if that pivot is met in the 3-day time frame is also going to be turning up above 104 but that one is going to update tonight so i' would be very interesting to see where this one is tomorrow if it does upon the new open or sorry if if the momentum pivot upon that new open comes down a lot let's say closer to 100,000 again another good sign that Bitcoin probably does just do a [ __ ] Bitcoin move from here I guess but as I'll continue to
say Intel Bitcoin really does reclaim this high right here um again that right shoulder just above 10 um just above hey whoops I'm on the wrong I'm on the wrong one uh just above exactly 101 435 there is potential for another pullback here potential doesn't mean certainty obviously but it does mean potential um anyways last we'll end on we'll end on this actually couple more things over here um we can see that the weekly hpdr did open below the median after the last week uh had a heroic reclaim of it before that closure so looking
at this right here you know it is going to be an area of interest um you know for for this time frame the weekly which is 101 about 101 uh sorry actually 10 102,000 yeah 102,000 bucks if Bitcoin does close this week above there I mean you're very likely going to see at least a try around the 382 level that gets you to about 116,000 um maybe it even extends up here but uh of course it's a long way it's a long week left to go other than that I'd like to just do a quick
update on the Quant some way bands I know a lot of people have been interested in this if you're a scalping type of Trader looking for well kind of like a done for you strategy to be honest um this could be a good de you can see it's actually had uh some pretty decent scalps over here hasn't traded exactly perfectly but again it is a it is a scalping tool it's not for trending trades um actually we are working on trending trades to go alongside with this but uh but you know similar to meta signals
it keeps you on track it keeps you on track and these have been the results results over the past uh couple years here for the hourly time frame um not bad anyways La actually should I say one last thing okay yeah one last thing okay we're only 20 12 minutes into this um I did want to revisit these Statistics over here because we do expect that January lows if the month is going to close positively if the month is going to close positively come very early on within the month um for all of the positive
closing januaries of which 1 2 3 4 5 6 7 8 we can see that um the low was put in on average around the first around the end of the first week of January again that's if it's a closing a positive closing month um 2014 and 2024 were the only times that we saw it come later than the fourth day of of uh of January so this average is being massively pulled up by those two reads so you know again it doesn't mean that it's impossible but it does mean it's rather likely if Bitcoin
is going to close green that uh that we don't I mean that we see it continue essentially from here and that the lows are already in uh again it's only been two times that we've seen the low come in after the fourth day of January again if it's going to be green obviously if it's going to be red that comes in significantly later like after the third week um so that'd be rather concerning but uh but yeah that would kind of strengthen the case that I'm uh pondering over here that if Bitcoin does have a
pullback it's very unlikely to be a new low it's very likely to be a higher low um but a higher low could come in theoretically around 95,000 bucks and that would be fine anyways that's a good place for me to be leaving off on this video like I said I'll update I'll I'll upload a video a little bit later going over the new upgrades for the Quant Prim and one that is coming for the trade like a Quant service um I'm really [ __ ] excited about it I've been working on it for a little
bit of time now and uh it's it's it's it's good like it's it's [ __ ] good anyways that's where we'll end things as always I want to wish everyone the best the best take care much love and see you hopefully tomorrow