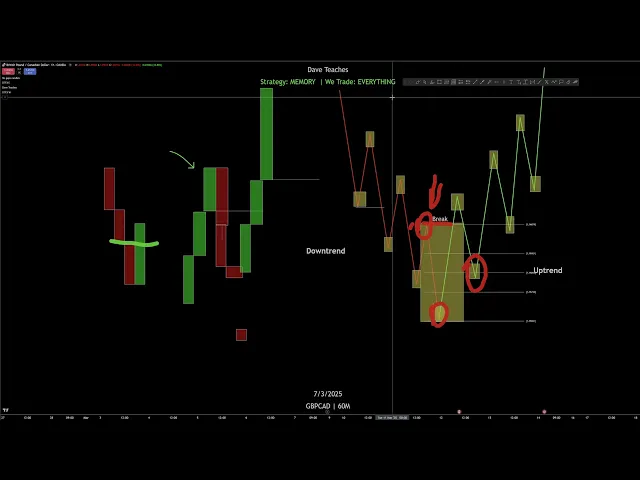
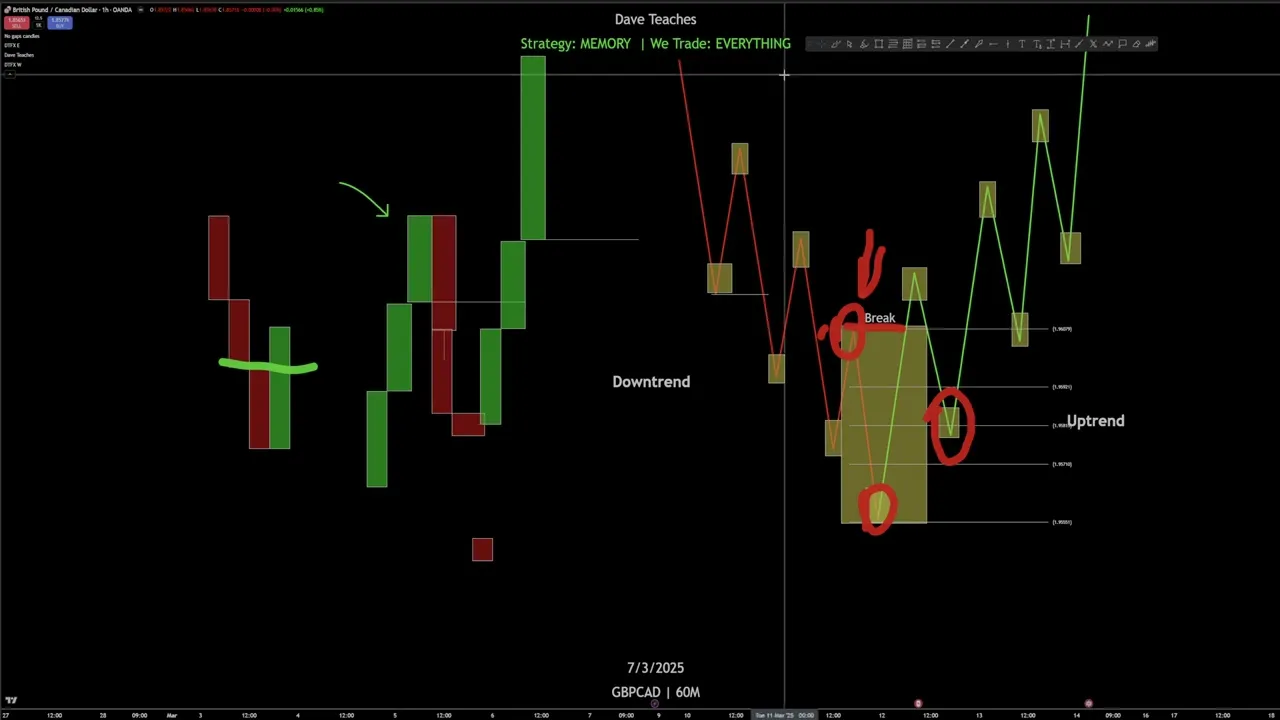
run through quick run through of this is we see that on this side here this is a downtrend right we we see the market in a downtrend and we know this as an uptrend why because the market is going up and the market is going down right very basic things that I hope uh many of you guys in here um learned based on the free course that's on YouTube so the most important part of Market structure for us for us in this this discipline is these Yellow Boxes you see the lows and the highs right
anything that's happening in between really doesn't matter to us what matters to us the most is those Yellow Boxes the boxes that highlight what the high is and what the low is right the reason why they're important is because where they are happening matters more than just them happening alone right the the what what goes on in that box and we're going to explain that in a few but where these highs and lows are placed are often times within what we call zones now zones are within the previous highs and lows so what we see
is in this downtrend we put in a low then we put in a high and what do we end up doing after we put in that high we break back below that low so then we put in another low and then you see another high get put in that's called a lower high because that high is higher than it's it's lower sorry than the previous high so what we have is a a higher a sorry a higher low sorry lower low and then another lower low on the bottom of it we have a lower high
and then another lower high High below it right so we know that price is still going down because it's not creating any highs that are higher than the previous High that's our idea of when price is getting ready to reverse and go to the upside but there's little nuances in that that I'll um explain a little later so um what I mentioned was that these highs and these lows are perfectly placed within previous highs and lows and P P Price Right previous ranges that's what we consider them so that's what we call the that's what
we call zones right we have this Zone what is the Zone well price put in a low it put in a high and then it traded back below that low so our zone is that previous range that we have there right so it's not from the high that's up here to the current low that's down here it's from both the previous highs and lows so we should all already be caught up with that because that was taught in the the um free playlist right so the most important part to us in this entire Dynamic would
be the highs the lows and the break right so where each High happens where each low happens right not not remember I said where it happens right not what's happening there it's where it is happening and I'm going to explain it to you guys like this so if we go over here to the left every high and low that we see inside of here let me move some of this out the way every high and low that we see inside of there starts with this it starts with as we are trading High from this low
that's down below here we put in these bullish candles to send us higher right so what happens at this High here is that we trade below a previous bullish candle right so this has three bullish candles on the way up and then there's a bearish candle that shows up and places us below that bullish candle that's there so now while we are below this bullish candle does that mean that price is ready to go down no because a lot of the times when we get below that that uh bullish candle what you see is more
bullish candles begin to form to take us up again right to take us higher this down move right here is is how lows are placed and when we trade back up above it that's how we know when the market is getting ready to trade higher it begins to trade in the current direction of the trend so a lot of the times when we see the market trading a lot of the times when we see the market trading higher here right we're looking to get involved in an entry on a breakout we want to see price
go higher we want to see price trade up above like this right but what we end up doing is getting caught in chasing that high because we don't know where the low that higher low is going to be placed so when that higher low gets placed that's when we should be looking for opportunities within here to now take price higher it's on that pullback as we call it so as we are trading up above here we see the pullback begin to happen at the top of where this pullback begins to happen that yellow box that
you see up there what's happening is this particular thing to the left that we just drew out we get the closure below the bull bullish candle the body closure below the bullish candle and then we begin to see price resume and trade higher but as we mentioned this low that's here often times is perfectly placed in what we call a zone right so if we go back to our example on the downtrend let me just get rid of this if we go back to our example over here on the downtrend we understand that as price
trades up above the previous lower high and it puts in a higher high because it's higher than the the high to the left that it just broke now we're anticipating price to trade back down now what you might see is people take a Fibonacci right a a standard FIB uh let me just find one here people take a Fibonacci and they'll draw the Fibonacci out here me remove this from the top they'll draw the Fibonacci out and they'll expect price to trade back into what they call the golden zone of the Fibonacci right the 61.8
the 50% you know um the even the 70% they're expecting price to trade back inside of there and then from here they're expecting price to continue now while there are times where price will reach back into this Fibonacci this this Fibonacci level the 61.8 the 50% while we understand that price at times reaches back in there it does not always go back to that 61.8% it does not always go back to the 50% so what we actually use here is when we do get that flip we use this Zone right the previous range as we
discussed the previous range is when price breaks up above that old high and what we take is the high and the low of that old high right that's the both the previous high and low we take that as a zone right here and we place our Fibonacci around that zone right with this F FIB it's the 30 the 50 and the 70 on it so it's three five and 7 or 0.3 0.5 0.7 so we take that and we're anticipating for price to get into that 50% and then we want to see what at that
50% we want to see this right right here we see that price trades up above that old bearish C candle to the left it trades higher than it and it puts in a body above the old bearish candle not a wick so there are sometimes where we see a wick that will trade down below that bearish candle and then you'll have price continue higher right you'll see something like this we'll see price continue higher and trade up like that would this be considered a high to us in what we learn here no that is not
considered a high we have to get the body below the bearish candle sorry the bullish candle in order for it to be considered a high that means that it could be one candle it could even be multiple candles trading below that right you could have a a few candles down here and then we begin to see this this this move uh trading back up again from here right let me just get rid of some of this so it's not as messy what we can see is price stop here and then begin to trade higher up
above like we see over here but what we need to validate this particular High here is a closure below that lets us know that a retracement this retracement right here this this uh box at the top we know that a retracement is potentially getting ready to occur when we get that closure below that candle now that retracement can be of any size that retracement can just go back to this this uh uh 30% that retracement might go to the 50 that retracement might even dig further down into here and Hit That 70 before it actually
trades out again but what we're looking for is if we are bullish and we're expecting price to go higher what we need to pay attention to is price trading back into that range back into that previous range back into the 50% or there are times where it hits that 30 we need to have that so we're not looking to we get this breakout now we're looking to take price long right because then we could end up in a considerable amount of draw down down here before price actually trades up again and there are times where
this candle as it's retracing it may just all go all the way down to the low and guess what's happening there when it trades down to that low all it's doing is breaking the previous low moving back into that range and now while your entry was up above here and you might have no stop loss you should trade with a stop loss I always recommend trading with a stop loss no matter how advanced you are what you end up seeing is price trade lower and now it's creating lower highs and lower lows to the other
side while you were trying to get involved in the breakout or while you were trying to get involved in some imbalance that was inside of here to trade higher what we end up getting was a break lower now there are some things within the uh the mandatory material that you guys have within the mentorship to where you'll have some idea of whether price is going to stop here or whether price is going to go all the way down here right that's in how to trade using the 30 and the 70 right there are little subtleties
that will show up at these areas that are let us know if price is getting ready to trade lower or if price is going to hold here and then move us higher again so that's why it's very important for you guys to uh watch that video but this is the Crux of Market structure how we use it so that means that as we mentioned this here is is what the yellow boxes are to the left right this low here is what the yellow boxes are to the left so at as we trade up here that's
what's happening there right as we put in a low down here that's what's happening there so all it is is validating our pullback right now what is the pullback is the pullback a retracement or is the pullback a continuation all it is is pulling price back to the other the opposite direction that it's slated to go in right that it's intending to go in so when we get a market structure break what we have up here what we have up here on the break is this we close below that bullish candle and no matter how
far down you see us go down here right where we're going to stop often times is inside of that zone but not at only is it inside of the Zone what we need to see is this happen right here we need to see that closure up above that previous candle to let us know that now it's ready to trade higher so this is going to happen in almost all of the zones that you see so as we begin to trade lower what you see over here is there's that previous Zone to the left price Taps
into the zone and continues down here's the same thing the previous Zone to the left price can price hits the previous Zone hits the 30% of it and what does it do it trades down here's the previous Zone to the left and what does price do with this price doesn't respect it now there are times where price can go right into it and trade out right but it fails to put in a new low that failure right there should let you know to get out of that entry because the market is slated to go against
you the market likely is going to break the high of that zone why because this Zone ends up being too weak to put in another low so we end up taking out the high of the zone right when we take out the high of that zone now that is where our flip occurs and what we're looking at when the flip occurs is that that previous range right here so this is where we start drawing out zones as it's trading higher so you have your break right here and then you have another down move and then
we have a break that's here let me um we have another break that's here we have another break that's here right we have another break that's here and every time we break up a Above This High We Are anticipating price to do what we are anticipating price to give us this right here and then move us back into that previous Zone that we have here and when we get back into the previous Zone that we have here what are we anticipating price to do inside of that zone we're anticipating this to happen here ready this
to happen right here so this is what these Yellow Boxes are these Yellow Boxes are the most important part of understanding Market structure it's helping us to time properly when the market is set to go lower and when the market is set to go higher so this is the most important part as I mentioned of this entire Dynamic right letting us know when the pullback is going to occur and what letting us know when the continuation is going to occur now if the market moved as simple as this we would all be you know billionaires
right trillionaires it be so easy right to be able to trade because all we had to do is wait for this closure and then we trade down with it wait for the closure and we trade up with it but the truth is this is how the market actually moves like this so if I can overlay this on the current price action that we have here now it looks a little more difficult sorry a little more difficult to follow right because we see all of these highs and lows in here and now it's not looking like
the simple break up above tap back in and continue now we end up finding ourselves confused with which high and which low is actually the pullback right and this is where you hear people talk about internal highs and lows external highs and lows right now I don't really pay too much attention to internal and external what I more or less look for is Swing count you guys hear me talk about that a lot and as we go further in you'll see why so now this is how it's actually looking in real time this is the
way the market actually looks so before it was a little pretty right oh yeah we can just wait for the closure and then we go back in with it and then we can just wait for the closure again and now we know where to short down but guess what now these Yellow Boxes you see here these Yellow Boxes are happening everywhere so as we mentioned if price moved the way we initially explained it earlier in the video video what we would see is that everyone would be able to enter into the market and become Millionaires
and billionaires right but this is why I consider swing count above everything because when we see this as our measure for whether price is going higher or lower what we have to understand is that this is happening in every single high and low on the one minute on the five minute on the 15 minute and it does not necessarily mean that price is actually ready to reverse remember what I said it matters about where this is happening right so if I can take this yellow box here I could show you guys that this happens everywhere
right almost every high and low we're going to see this same thing occurring every single high and low that's present here so that's a lot of stuff to keep track of it happening here what if I go short here and then it trades up okay what if I go long here and then it goes down below it but then it happens again there and it happens again there and it happens again there and the entire time while I'm thinking that it's bullish and trading higher I'm buying down here because of this criteria over here and
it's just constantly going against me so the solution to that is not to buy every single closure you see but where the closures are happening that's the most important thing that's the low here that closure occurs and then we trade higher you're going to see multiple closures here and here and here and here and here and even here and here and down here and down there again too and there and there and there and there that's going to be happening all the way down to make you think that price is ready to trade higher and
it's not this is going to be happening on the way up and make you think that the price is looking to trade lower and it's not so it's where this occurs that matters for us the most the number one thing you want to make sure is that whenever you're getting into a trade it's in a Zone what did we call zones earlier we call zones the previous up move price previously traded up above and then went back below its former low now it put in a new low right and what we're looking for is price
to trade back into that previous range and here is where we look for this in order to say okay now we're looking for price to trade lower but what actually happens inside of there is that you end up getting something like like this you'll see price trade inside sorry you see price trade inside and put in a high there right and you think it's ready to go down and what will actually happen is it'll trade up again up there and then that when it actually moves the other way right so this particular thing here this
this uh retracement that we're looking for to occur we get the down candle closure we're expecting price to continue down but what actually happens here is it occurs here where it brings us down but then it trades higher again up above and now when it brings us down here it just runs it just leaves gives us no opportunity to get in and and it heads straight back for the low or there are times where it doesn't go straight to the low there are times where it will consolidate inside of here before actually turning around so
this is why with this Dynamic with us closing up above the previous candle to believe that we're retracing or going bullish for us closing below the previous candle and think that we're retracing and going bearish what we have to understand is that this can happen anywhere right where this needs to happen matters more than it happening on its own price can continue to go up and not be inside of a zone at all and do this and then make its way up again as I told you guys earlier price can just put a a wick
through that previous low and then continue to make its way up and just because you see this red candle form and we begin to trade down does not mean that's time to slap in a trade there place my stop behind the engulfing or all the different names that they have out there and then look for price to continue down while that happens sometimes it it doesn't always happen we're looking for where this Dynamic happens in order to set us up to take the trade we're looking to trade and and have the outcome we're looking for
so this is the true nature of the market you'll see this happen there are times where it may just tap here and go straight down there are times where it moves higher and then goes lower there are times where another high can come out of it like that and then actually trade lower what matters the most is that you are in a zone right you in a zone now the homework that you guys get that's going to help you to fine-tune your ability to time this in the zone but the Zone matters the most right
when it comes to timing properly those highs and those lows that we're expecting to occur so again on the way up back on the way down on the way up again on the way down on the way up on the way down we're going to get this particular thing everywhere it does not mean price is ready to go long or price is ready to go short it just gives us some intention on what price could potentially do but there are a few other things that we need to see happening like structure The Narrative of it
that's happening around that some zones do not hold and there's a narrative that price will show us to let us know that the zone is not going to hold then we have zones within zones those are things that we teach with in the free playlist right but we refine those zones within zones to models that we use within the the mentorship so those models are giving us the detail of the zones within that zone that we're able to take trades from and reduce our risk because if you're taking a trade from this this larger Zone
that is here right your stop generally is at the the uh uh sorry your entry is generally at the 30 or at the 50 right and your stop is behind the high or some people place their stop at the 70 there are times where it may go from the 30 there are times where it may reject from the 50 there times where it may come all the way to the 70 right here and that would be where your stop is behind here and then actually make its way back down now the models will give you
an idea of where price is particularly going when it gets back into the Zone but you will learn these things over time and you'll learn how to properly refine your entries to where you don't have to risk the entire Zone that's there you can risk a smaller amount to be a part of a larger move leaving but the very first thing you need to understand is Market structure right these highs and these lows that are being put in right this is something that you need to pay attention to because your trades are always going to
go against you if you're trading against the overall trend in the market this here is the actual downtrend that we see and how it looks and this here is the actual uptrend that we and how it looks so there are times where you may believe believe that the market is getting ready to go short because it traded below a low that was somewhere inside of here and now you're trying to take a short position from here to go down and what does the market do it goes higher up above there there times where you believe
that there's some sort of entry in here to trade higher because some imbalance that might have traded through the high and then price digs further down into that previous Zone back here right and then it actually moves out and trades higher so this is again helping you to find an area to get in or the highest likelihood of where you can get in reduce your risk and then trade in the direction of the trend or counter Trend right there are some counter Trend trades that we end up in because we're not necessarily paying attention to
the higher time frame we're looking at the lower time frame and the lower time frame opportunities and while the lower time frame may give an opportunity of a structure break structure breaking on the lower time frame does not mean that price is reversing right so when we talked about the overlay of this as we are heading down what we can see is the market trades down right and then goes to put in a high an internal High and the market trades down again right so on the one minute we are seeing this High get broken
we are seeing price tap back in to trade higher but that does not mean that it wants to go and take out this high right here because the larger time frame that the red line going inside of there trading down the larger time frame is still bearish right it's still trading down so the little flip that you have inside of here is just allowing you to take part in the retracement to potentially continue down again the only time that you'll see price begin to trade higher and you could have conviction that we're looking to trade
higher is when the higher time frame high is broken right because the higher time frame controls whether the market goes higher or lower the lower time frame just facilitates that move higher or lower so the lower time frame has a specific order flow that it'll follow it has many variations of it that facilitates price going higher or Price going lower sometimes it's through ranges sometimes it won't even be through you know trending price on the lower time frames it can just be by impulses as it's just moving higher we don't get any of this here
right we might end up getting something like this we get a bearish candle here follow followed by a ton of bullish candles going higher like that then more bullish candles here that go higher like that so while we think that the market has to move with these highs and lows that are being created there are times where it won't even create anything substantial to pull back on it may just be impulsing higher because that's the current condition of the market that that's what's currently happening it's just moving with strength moving with speed moving with momentum
there's just a ton of buying that's coming in that no one's really selling out of position or the value of whatever the stock is or the crypto is it's just moving higher but there are times where we have the same thing on price being bearish right you end up having this this High put in and you think that that's a a pullback getting ready to happen and what does the market do the market just continues to trade lower right just continues down and it's just dumping we've seen that in over the last week or so
right will we just continue to see the market dumping lower and lower and out of nowhere we might end up seeing the market do this we might end up seeing it start to push and maybe you know it it pushes a little more right here right starts to push and then what what occurs after now you could have more bearishness step back in and move us lower again like that so while we understand that it can move in pullbacks and continuations right it builds on Market structure trading up it's not all the time that the
market gives us those conditions that it will cleanly build structure as it's trading in the direction that it's trading so the the models the models are created to show us the subtleties of things that we may need to see to where while we might be expecting price to go back into this previous range that's right here what the market may just do is trade back up and stop right here and then move lower right so now it didn't trade into any of the levels that were placed inside of there we put our FIB around there
didn't hit anything in there it just hit something right at the bottom of here and then we saw it trade lower this is going to help us to be able to time better entries but it needs to be rooted in structure because when this happens here this little pullback right here when it occurs and it begins to run in that direction it's still inside of a Zone it just may be a higher time frame Zone that's somewhere back here that it actually hit and started to impulse higher or you might have something here right we
we might have taken out some low right here and this traded back into the zone and then moved down or maybe the low was up here and there was some sort of imbalance that was here that it hit and then it traded into the other direction there's many different variations of how price can tap into something and move away from it and you can find an opportunity on it or you can wait for it to show its intention to continue the trend that it's in while people anticipate the market going up and the market going
down like this there are other times where we have this this range that's here where the market now is not delivering any highs and lows for us it's just actually trading back and forth that range we've already discussed in some of the mentorship videos and as you guys go through the mandatory material section it'll explain that range for you so this is when Market structure is not structuring right it's just trading back and forth between you know two levels that might be there two zones that are there and you don't know whether price is going
higher or lower so when do we consider something a validated High when do we consider a validated low that's these highs and these lows so this low is validated because it showed signs like this here that it's ready to pull back with the closure that happened on the way up right so that's a valid validated low this high is not considered a protected high as of yet until it gets back below this previous low and it needs to be a body closure through there so what do I mean by that so this is the market
moving higher and what we see here is this is the up candle right here right we get a body below the wick of that up candle or the range of that up candle that's there we draw it out a little better we get a body below it here right so now we see pric is continuing down right and what we need to see is a body that trades up above a bearish candle to move higher right but what did we say about that we said that we need to see it happen at a specific level
so while we can get this where we get that closure up above price can go back below again and then trade higher now you might have taken out a position to go long here and you placed your stop behind this low and then it traded down and stopped you out and then actually went the way that you had it going so when you're trading and you're taking entries at the 50% as we met mentioned your stop may very well be at the 70 or your stop may be at the low you might be targeting a
one: one you might be targeting the high or you might be targeting something else that's that's further up above right the way that you reduce your risk inside of this is when we see this occur we put in that high we put in another low and then we trade up above the high right here if your entry was at the 50% of it and we got up above the previous High there before making it to this high this entry here would already be at break even the minute we traded up above this High here that
means that price should not want to continue back to your entry here what we should see is the market trade back into this previous range here and then we should see the market trade higher From Here and Now it's moving back up so you can find an entry here at the 50% or you could wait for the flip that happens there and find an entry here and place your stop behind the low here because this low should be protected or you can buy stop your way into the momentum right by stopping the down candles that
are trading higher that's like this candle above up here that we talked about this would be a buy stock so this would be where you're anticipating price to continue higher you're anticipating price to continue higher and when it trades below that low up here is where you could look to take an entry which your stop not this large but which your stop behind the down candle's low for the market to move higher so the the thing that we look for are the swings because the swings that will simplify it for us we don't have to
pay attention to a lot of the detail that's happening inside of there we'll just wait until price Taps into the previous range of a swing and then we'll anticipate a one to one coming out of the swing or we anticipate price to trade back to the low from from here or back to the high when it Taps into this Zone going higher this is the thing that we're often looking at the swing count we want to see price give us 1 2 3 4 now there's potentially a fifth and a sixth swing that occurs before
price begins to do what now turn the other way and create structure back to the downside right like that but just because we get four swings does not mean that we should start looking for short we should wait until the market shows its hand to us where the market can let us know that it's looking to trade in the opposite direction how do we know the market is is looking to trade in opposite direction we understand that based on the break here right so that means that if we got up here the same thing that
we need to see happen up here would be the break we would need to see price go below it here right and then now begin to trade back down like that this is how we get that break below you see price Taps back into the previous range here and then now it can continues down you see it go back into the previous range again here and now it continues down so that gives us the intention on whether price is looking to continue higher or lower now with the swing count we have to understand that while
it facilitates order flow based on whatever it is that price is looking for it does not necessarily mean that we should be looking to counter for me I stopped trading after three swings I stopped continuing after three swings right trading continuations because there are times where on the third swing I'm trying to take an entry and I've been liquidated I've been stopped out so that's a part of my plan but for you guys and whatever plan you have whatever plan you develop in your own back testing time and based on what you see the most
you should utilize the four to six swings unless you start seeing that there's a possibility that there's something else you could incorporate maybe one less swing maybe one more swing Maybe a range after a particular swing you want to find that yourself and and rely on that when you're trading on your own I'm going to bring you guys to a particular area in price that I was trying to explain earlier in the group and this is where we have pound C right it's a Forex pair this is something that I've been trading over uh the
last couple weeks or so maybe almost a month now I've been looking at this um and I had price trading up to here and I wanted to see price continue down continue down to here because I had a weekly area down there that I was looking for price to go and tap into now monetary policy and you know many other events tend to move the Forex market so anything can happen in monetary policy globally that would end up you know causing your analysis to you know fail that's okay but what we see here is when
we got up here I was telling some of the group in premium was letting them know while we while we are up here and at that area that I was expecting price to reject from I'm not looking for a long I'm sorry a short yet I'm not looking for a short yet because we have not taken out any lows at all price has not given us any type of confirmation to say okay yeah we're ready to go lower we're ready to reject from the little box and squiggly line I have to the left so what
did we end up seeing the market just move higher continueed to trade up above how many swings is that I'm already counting 51 swings as we're making our way up but I'm not looking to take a single entry going the opposite direction unless I understand that it's a counter Trend right I'm I'm at Liberty to take those but I need to to trade it as a counter Trend I'm taking profit as a scalp it's not going to be a move that I'm holding to look for any low to get put in because it's not giving
me any confirmation whatsoever to take the trade going back the other way so as we mentioned here we talked about how the highs and the lows right here's a high here's a high here and we put in this low what did we end up doing after we took out the high we traded back into the previous range here and then you see us continue back into the previous range we continue right back into the previous range I see price Wicked below that low so that's not a that's not structure broken sometimes we can just trade
down take a low by a wick and then continue higher but it traded down and then continued higher back into the Zone continued higher back into the Zone continued higher and now we get this impulse here that is it's not going back to zone right now it's just trading straight up this swing count here and US continuing to trade higher just lets me know that the higher time frame is at play I can't continue to count these swings and hope one of the swings are going to reverse what I actually have to do is go
to the higher time frame and see what's going on on the higher time frame so if we go to the Daily what we see is this this is just nothing but remember what I said those green candles that can just continue up those red candles that can just continue down this is nothing but that we see based on the daily time frame just a ton of green candles making its way up like I said it Wicks below the low trades higher right but then what the market now moves back the other way because it tapped
into the higher time frame Zone that's there I told you this is always coming out of something to the left on the higher time frame but what does it do after put a new series of red candles and then just nothing but green candles on the way up it's just continually making its way up so why would I think that my little hourly candles in here my 15minute zones in here my 15minute my hourly swing count is going to matter if this is a higher time frame move at Play That Swing count should let you
know if price is not turning that the higher time frame move is is occurring and when you get that higher time frame move occurring you want to wait until something on the higher time frame is taken in order for you to consider counter trending this doeses not tell you that up here is where the market is going to go back down and now take out this low you need to see some consolidating that's happening up here to support the market now turning in the other direction the consolidating is letting you know that the buying has
ran out and now the market likely is shifting to the other side that's what happened up here we had the consolidating that was occurring up here and then it shifted to the other side right we had the consolidating that was occurring up here and then it shifted to the other side so this is what I want you guys to understand with just the basics of Market structure is that you can have zones that price continues to create and not turn around at all you just have to understand that that's when the higher time frame ends
up being in control control so when we see that higher time frame in control we have to let that higher time frame move play out we cannot try to be a hero and and turn price around with our panty lot thinking that price has to respect the drawing that we put there it does not have to so now we're up here right and because I understand this is a higher time frame move playing out what I would have to do is go back here and look at what potentially is happening up here which would lead
me to what the weekly or the monthly so now these candles are looking a little better they're looking you know not as much fuzziness that was occurring in there right not the the little tiny swings that's making its way up it's not a lot of noise now that's been silenced so what we're actually looking for is we see this here right there we get that closure below and this is just the same thing as the Zone that's up here so now there's a possibility that I understand that that price could potentially go to 1.89 n00
on pound CAD before finding some resistance to turn around so what does that mean for me over here that means that even if price dips back the other way I'm looking to continue long until it's met its Target the Target could potentially be that 30% the target could potentially be the high that's right there it could be looking to sweep that Wick tap into the 50 and then trade the other way you could Target the one to one on the zones now I have from here at 195 all the way to 181 to possibly find
shorts on the downside leading to where I believe the short Target could be so this is the Crux of what barket structure is the dtfs way and how we find Opportunities now over time you guys are going to learn how to incorporate models with this you guys are going to learn how to be able to properly time some moves where you can buy stop and scalp a little bit off of it and pay yourself as your learning to continue to refine what it is that you're doing and master it right but it's baby steps so
the very first thing that I told you guys to consider the most important thing is your swing count and why is that because you're going to see closures happening everywhere but if you're trading in the direction of the swings being made it's a lot easier for you to be on the right side of the market or it's a lot easier for you to anticipate a potential reversal that's occurring if you have your swing count in view so many of the videos that you guys go and watch in the libraries you'll hear me say when I
come on okay guys how many swings do we have here let me just count and see what swings we got and then I'll make a decision based on that or if I don't see a decision as of yet or maybe there swing count has not matured yet I'll wait until that does happen will there be times realistically where you're waiting for another swing to occur and then price just breaks and goes the other way without you yes absolutely but you can't fallo into that you have to make sure that you have a plan for when
this the third swing isn't formed the fourth and SW fifth swing doesn't come in price only gives you two swings and actually reverse you just need to go up a higher time frame and see what's potentially happening so this this is going to help you guys to add some stability to your trading and you know give you guys those dreams that that you have when you when you first started doing this right it's going to revive that resuscitate that but it's all on you and your plan and your discipline and your ability to execute based
on your rules that is the thing that's going to save you that and that alone not me not any signals that I give not what somebody else is doing it's all on you no matter what happens to you in life if it's good if it's bad it's you take the blame and move on right build back better right or or whatever they said you want to make sure that you you make yourself great again whatever slogan you want to use for your life and your future right reinvent yourself but make sure that you do it
within structure and within rules and within a plan so this is Market structure as we know it