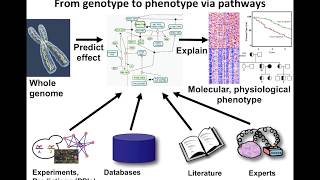
[Music] hi guys welcome back to my channel i'm so happy to see you all here so today i'm going to talk about a highly requested topic that is uh weighted gene coexpression network analysis also known as awaited correlation network analysis uh in this video we'll be talking about the idea behind this analysis um various steps that are involved when performing this analysis when does it make sense to use this approach and we lastly will go over some good practices while performing this analysis uh this video is not a demonstration video but it is more towards a conceptual aside where we will be focusing on understanding the idea and working behind this approach so i'll be making another video where i will be demonstrating how to perform this analysis which will be uh coming up in the following weeks uh but in this video we will be mainly be talking about the idea behind this approach let us say there is an experimental drug which is being tested for a certain type of cancer and it has been found that cells from tumors extracted from patients having that particular type of cancer do not respond to the drug therapy which means the drug do not effectively kill the cancer cells and because the cancer cells are not eradicated the tumor comes back so essentially what we're interested is to observe the systemic level changes the changes that are happening in the cell that contributes to resistance to the therapy essentially what we would like is to understand what pathways are involved and in order to identify the pathways we would essentially want to go one level deeper and identify the genes which are involved in pathways that causes the resistance to the drug now to study the changes in a cell in response to therapy there are various levels one can study the system level response at the genomics level at the transcriptomics level or at the proteomics level now talking about the transcriptomic response there are various methods used to quantify the transcritomic response in a cell and these are qrt pcr microarray and rnac so basically they measure the gene expression in a cell and what we get is a gene expression matrix now using this gene expression matrix we can employ various computational methods to understand or identify biomarkers or candidate genes or a list of genes that could give us an idea on what pathways must be involved and that must be contributing resistance to the cell methods like differential gene expression analysis and function enrichment analysis cannot reveal connections between the genes they only give us an idea on what are the genes that are expressed or um are enriched in one con in one group of cells or in one condition versus the other but there is no information among how these genes are connected amongst each other and hence coexpression network analysis is a method that gives us more information on how genes are correlating to each other and that can give us an idea on what genes must be functionally related so the basic idea behind weighted gene coexpression network analysis is that genes with similar expression patterns are functionally associated so let us break that down when i say genes with similar expression patterns i mean um genes that are correlated what does um that mean what does uh what does it mean to have to be like two genes for two genes to be correlated so when the expression of one gene goes up the expression of the other gene goes up as well when the expression of one gene goes down the expression of the other gene goes down as well that that means that they have similar expression patterns and now coming to the second part of it they are functionally associated so when these genes have similar expression patterns it means that they are functionally associated meaning that they are part of the same complex or they are involved in the same pathway or regulatory mechanism or they may influence each other or may be influenced by the same underlying mechanism and this will be more clear when i give you an example in the next slide so quick recap we have all studied central dogma at some point in our life and we have been taught that dna is transcribed into rna and rna gets translated into protein so here is a gene regulatory network and here gene 1 gets transcribed into mrna1 and mrna1 is translated into protein 1. now protein 1 is required for gene 2 to be transcribed so it basically binds to the promoter region to gene 2 and transcribes gene 2 to mrna 2 which is translated into protein 2. now protein 1 and protein 2 are required to transcribe gene 3 so it basically binds to the both of these proteins bind to the promoter region of gene 3 which is transcribed into mrna 3 and protein 3.
so high expression of gene 1 meaning more mrna 1 transcript which means more protein 1 in the environment and more protein 1 which means that it will result in more mrna 2 being transcribed from gene 2 which means that higher expression of gene 2 which will result in more protein 2 in the environment and since we have high protein 1 and protein 2 in the environment this will result into more uh number of mrna 3 being transcribed from gene 3 which means higher expression for gene 3 which will ultimately result in the high protein 3 in the environment so gene 1 gene 2 and gene 3 have coordinated expression meaning that if the expression of gene 1 goes up the expression of gene 2 and gene 3 also goes up if the expression of gene 1 goes down it will also result in lower expression gene 2 and gene 3. so similar gene expression patterns between these three genes indicate that they are functionally associated and here we can see that they are involved in a gene regulatory network where gene 1 regulates the expression of gene 2 and gene 1 and gene 2 regulates the expression of gene 3.