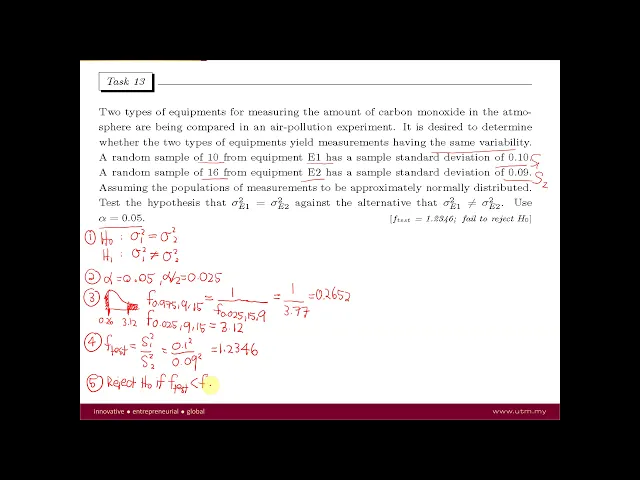
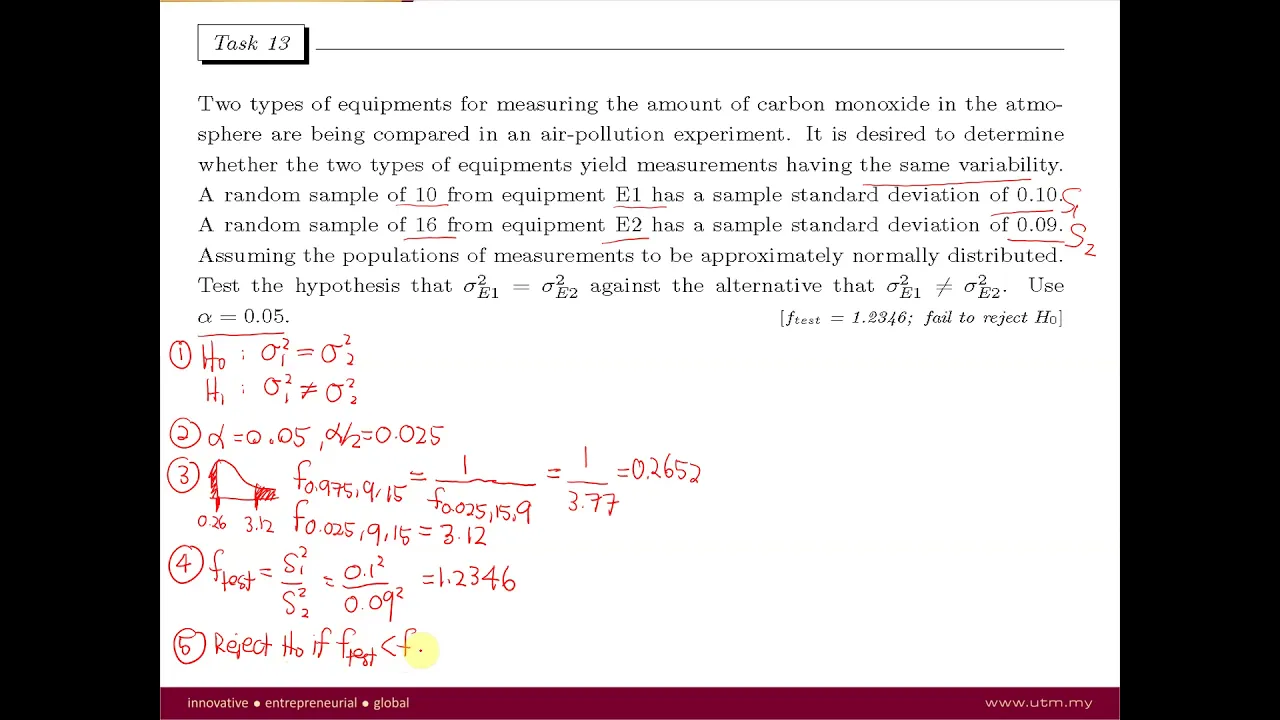
okay now in this video I will explain on the hypothesis testing for the ratio of two variances okay so basically the test statistics for the ratio of two variances is given by the f-distribution equals to ask 1 square over s 2 square and for F distribution you will have two degree of freedom which is V 1 and V 2 so V 1 is equals to n wine - wine and V 2 is equals to n 2 minus 1 okay further now for the alternative hypothesis as usual we'll have three cases one is Sigma square one not equal to Sigma square 2 the second case is when Sigma square 1 is less than Sigma square 2 and the last one is when Sigma Square 1 more than Sigma square 2 and for the rejection region when you have to cite it like this for the first case so the first one is okay if you have to say that then the graph will be like this right so this is the rejection region on the left and this one will be on the right so this one will be this value on the left ok the rejection region on the left and this one will be the rejection region on the right so for this one F 1 minus alpha over 2 V 1 minus V 1 and V 2 we know that we cannot find this value in the statistical table right so you have to use the formula what is the formula F 1 minus alpha over 2 we have V 1 V 2 is equals to 1 over when over f alpha over to the v1 and v2 will change place right so v2 v1 so this is the formula to find this value okay same goes with this one right but for this value you can directly get from the table okay remember for degree of freedom we start with v1 and v2 okay now let's go to test that team right interested in okay you have two types of equipments for measuring the amount of carbon monoxide in the atmosphere I've been compared in an evolution experiment it is desired to determine whether the two types of equipments yield measurements having the same variability so we want to know whether the variability is the same owner a random sample of 10 from equipment a wine has a sample standard deviation of 0. 1 so this zero point one is ss1 okay a random sample of 16 from equipment e 2 has a standard sample standard deviation of 0. 09 so 0.
09 is s 2 assuming that the population of measurement to be approximately normally distributed the hypothesis that Sigma Square 1 equal to Sigma squared 2 against the alternative of Sigma square Y not equal to Sigma squared to use alpha 0. 05 right so you have already given you are given the hypothesis so firstly now an alternative hypothesis Sigma square one equals to Sigma square - another one is Sigma square one not equal to Sigma square - okay the second step alpha equals to 0. 05 so this is your graph not equal to so you have to say that one is decide not one is this side alright so I'll find it to be divided by two so 0.
025 okay so for this one for the first one it is for the f 0. 975 v1 and v2 okay and for the second rejection region which is this one the value is f 0. 025 v1 v2 okay so this F 0.
025 V 1 is 1 V 1 is 9 right so this is 9 this is 15 so same goes with this one so this is 915 yep so for the okay we go for the first one first okay so f 0. 975 you cannot get from the table so you have to use this formula 1 over F 0. 025 the V 1 and V 2 you interchange so here will be 15 first then you go for 9 all right so f 0.
025 from the table 0. 025 15 and 9 it is equal to 1 over three point seven seven so this equals to one divided by three point seven seven equal zero point two six five two okay and for this next for the second venue F zero point zero two five nine fifteen is three point one two okay so basically this is zero point so this is zero point something 0. 26 here 3.