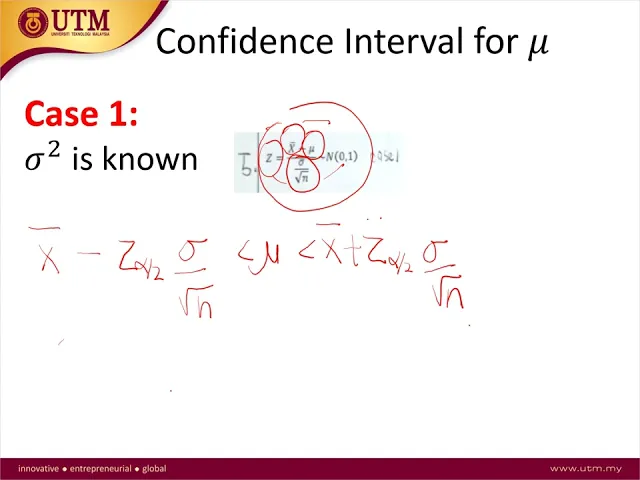
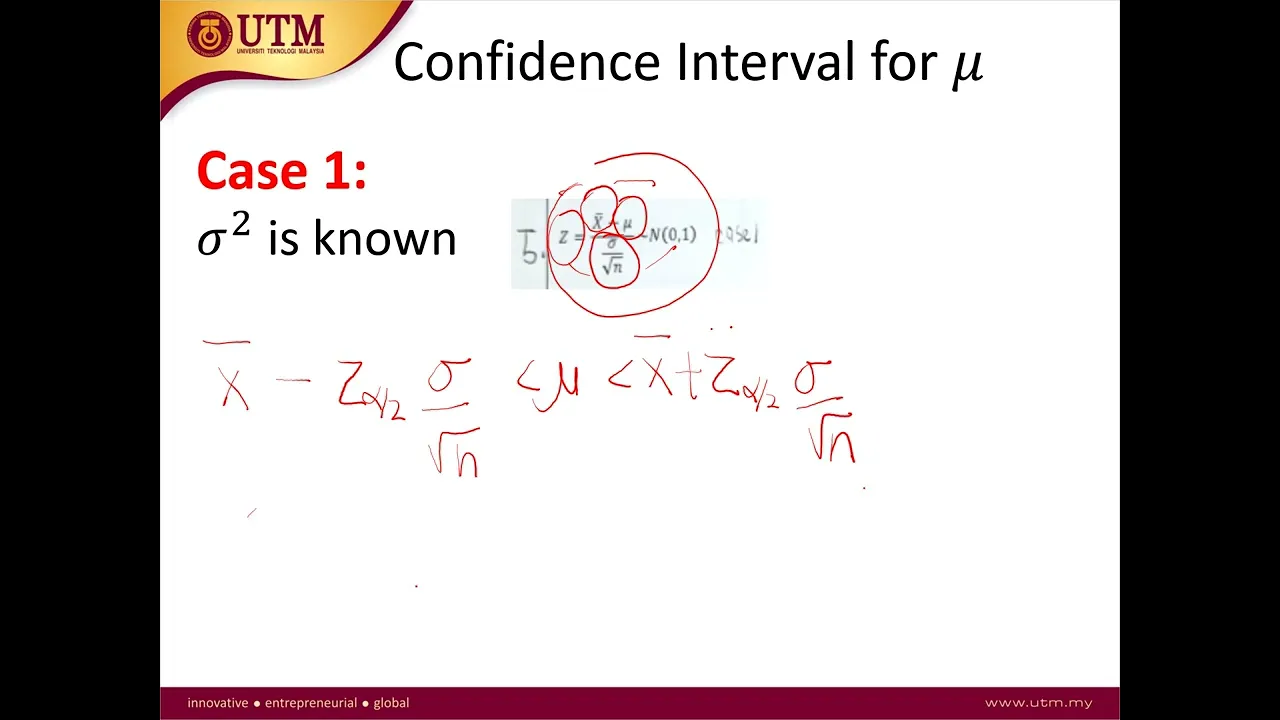
and good day everyone so in this video okay I'll explain on chapter three which is the parameter estimation so these are the outlines for chapter three so you will learn about the terminology the point estimate and the interval estimates as well as the confidence interval for mean okay you have a single mean and difference of two means for proportion also single and difference of two proportion and also on the variance and the ratio of two variances okay so in this chapter there is no more for you to find the probability okay probability is in chapter 1 and chapter two so in this chapter you will learn how to construct the confidence interval okay so this is the terminology or this uh the statistical term used in this chapter okay estimated is defined as the sample statistic used to estimate the population parameter okay estimate is the value assigned to population parameter Point estimate is the value of sample statistics used to estimate the population parameter and also the confidence interval is an interval okay an interval that is constructed around the point estimate okay that is associated with the level of confidence based on based on the procedures in constructing it so for confidence interval uh you're gonna have an interval with the lower limit and upper limit okay lower limit and also upper limit all right so in engineering okay um we always use um we always need the confidence interval to estimate certain things for example the mean breakdown voltage of diodes for example okay um we need to estimate okay we need to estimate because we don't know the population we we are unable to estimate uh we are unable to calculate the population so that's why we need to estimate it okay we need to estimate based on Sample that we have all right so you will need to estimate sometimes the mean breakdown voltage of diodes the standard deviation of inside diameters of certain plastic pipes the proportion of defective items okay and so on so forth right so these are the use of confidence interval in engineering okay so um when we don't know the uh parameter let's say we don't know the value of mean the variance or we don't know the value of proportion so we need to estimate it and uh the point estimate for mean is uh X bar the point estimate for variance is s square and B for the proportion so this is the point estimate when we have sample okay in Sample X bar represents the mean right s Square represent the variance and P small P represent the proportion okay okay for the interval estimate generally a hundred hundred times one minus Alpha percent confidence interval for the true parameter means this one okay so let's say [Music] um let's say I have a the confidence interval for a ring diameter is uh from 50 for the mean diameter 50 to 51. okay this is 0. 98 so 0.
98 is the probability okay so from this statement I can say that I'm 98 okay I Am 98 confidence that the mean for ring diameter is between 50 and 51 centimeter for example okay so or maybe um the the probability can be changed okay based on your analysis okay or maybe 90 I just calculate for 90 So based on this statement I can say that I'm 90 sure only 90 as compared to just now 98 it's a bit High okay so this one is just 90 percent sure or 90 confidence that the mean of the Ring diameter is between 50 to 51 uh like that okay so for this chapter okay for this chapter you will learn three parameter right mean okay proportion and also variance all right so for today's class um I will explain on this mean and a single mean and difference of two means okay which will be divided into two part like this this is the first part this is the second part okay so you see here we have three uh three keys for single mean when Sigma square is known Sigma square is population at the variance right population variance okay so population variance is known population variance is unknown but the end is more than or equals to 30 and the last case is when population balance is unknown also but the end is less than 30 okay okay all right so uh like I mentioned just now we have three cases one is population variance is known um the rest is unknown but one is when n is large which is more than or equal to 30 another one is small when it is less than 30 okay so this is uh this is the confidence interval this is how to construct the confidence interval but um we will be based on your statistical table to construct the confidence interval okay now I want you to refer to your statistical table page two okay page okay in page two you have this this page right okay this is on sampling estimation and hypothesis testing so you have all you have the formulas for all um sampling the estimation formula Okay so I'm sorry my my my page my statistical table here is a bit mess okay uh because I got um put some notes here okay so uh you have so many formula here so the first four the first four formula is for chapter two okay chapter two for sampling distribution okay if you still remember okay we have uh uh sampling for mean and proportion okay uh the first four chapter is chapter two and for the first Formula is chapter two and then formula number five six and seven this is number seven six five six and seven for single mean and the rest is for different set of two means which you will learn in the second part okay so formula number five six and seven now I'll Focus so formula number five you see formula number five Z equals to X bar minus mu over Sigma over square root of n okay this is case one Z equals to X bar minus mu over s over square of n this is case 2 okay both formula follows n n stands for normal distribution okay but formula number seven you see formula number seven it is T equals to x square sorry X bar minus mu over s over square of n okay and it fold it does not follows normal as the two formulas previously but it follows T ah T distribution is uh the distribution has certainty distribution okay so uh this 3D distribution I've introduced you in chapter two if you still remember okay the end of chapter I have introduced you to T distribution Chi Square distribution and F distribution so this is the use of T distribution here okay so if you still remember just now okay just now we have three cases one is population variance is known okay Sigma Square known this is the first case second case when it is unknown Sigma Square unknown K by n is greater than or equals to 30 and the third case when it is unknown also but n is less than 30 right okay so you see when n is greater than or equals to 30 it will follow normal distribution but when it is less than 30 it will follow T distribution okay T distribution is used when n is small all right okay so the first case how to construct the confidence interval the first case uh we use this formula you have Z equals to X bar minus mu over Sigma over square root of n okay so firstly our Target is on the mean right the mean okay so the mean will be in the middle okay we have up lower limit and upper limit all right and here is z okay exact so we use Z distribution okay when we use this distribution and we have both sides lower limit and upper limit we have two-sided okay two-sided limit so uh for that you know right we have Alpha okay this will be Alpha over 2 Alpha over 2. okay Alpha because uh okay uh Alpha over 2 because we have to say that one is lower limit when it's upper limit so you have to divide by two okay and then from this formula you bring this the the denominator to both sides okay you bring just bring to both sides you have Sigma over square root of n this one also Sigma over square root of n okay and then next is X bar so X bar you move to both sides as well so here will be X bar X bar okay here will be minus here will be plus so if you can see here we already have the the the formula to construct the confidence interval for lower limit and upper limit so lower limit is X bar minus z alpha over 2 uh Sigma over square root of N and for the upper limit is X bar plus z alpha over 2 times Sigma over square of n or okay or you can write s x bar plus minus z alpha over 2 Sigma over square of n okay you can write your formula this way the first way or the second way and uh you also can calculate uh by using both quesla okay okay so the second case when Sigma square is unknown and N is large which is more than or equals to 13. okay you have this formula formula number six so let's try to construct the confidence interval we are focusing on the mean mean okay so here you have mean all right and you have Zach here Alpha over 2 z alpha over 2 the denominator you bring to both sides s over square root of n s over square root of N and lastly is the X X bar X bar one is minus another one is plus so this is your formula for confidence interval or you can just write as X bar plus minus set Alpha over 2 s over square root of n okay the difference between case 1 and case 2 is that um for case one the sigma square is known if the sigma square is known then you have to use Sigma here as this one Sigma this one Sigma if it is known okay but now case two is unknown so I know we have to estimate using S we are using as instead of Sigma because we don't know the value of Sigma we only know the value of s okay okay case 3 is when Sigma square is unknown and N is less than 30 we use T distribution okay T distribution for from formula number seven so the same okay the same um this is T I get the alpha over 2 okay if you see here we have n minus 1 n minus 1 is the degree of freedom means we need to find the degree of Freedom before we could find the value in the table okay and uh Alpha over 2 and then you have n minus 1 here n minus 1 okay and then the denominator you bring to both sides so you have S over square of n times s over square root of N and then X bar class X bar minus okay or the other way you can write as X bar plus minus t Alpha over 2 and minus 1 times s over square root of n okay so this is the formula right now okay now let's uh look at example 3.
1 from your textbook okay from the textbook you just look at the question okay don't look at the solution yet all right so comprehensive strength of a concrete is normally distributed with standard deviation of 2. 18 times 10 to the power of 5 plus curve a sample of 16 specimens has been randomly selected which give the sample mean of 2. 49978 times 10 to the power 7.
construct a 95 confidence interval on the mean compressive strength okay we need to construct the confidence interval for the mean okay for the mean means the one in the middle the our Focus will be on the mean okay okay so you see the first sentence you see the first sentence it gives you the value of standard deviation so this standard deviation is the population standard deviation or the sample standard deviation it is the population standard deviation because the value of standard deviation does not belongs to any sample size okay it is a sentence that represents all strength of concrete okay so this standard deviation is Sigma means here our Sigma square is known okay Sigma square is known because it does not belongs to any sample so the next sentence a sample of 16 specimens give you the sample mean of this much okay so this is X bar because this value belongs to the sample of 16. okay this belongs to the sample of 16 specimens so this is your X bar not me not mu okay all right and then you have to construct a 95 okay remember I said in previous slide uh we are 98 sure we are 98 confidence um So based on this we need to find our confidence for 95 confidence ah okay we need to find the interval for 95 confidence okay so in this case this is case number one uh case number one okay so later you say like how how they solve the quest uh this question okay now I'm going to go to task 1. okay so for task one a random sample of 16 compact cars tested for fuel consumption give a mean of 12.
5 kilometer per hour with standard deviation kilometer per liter with a standard deviation of 0. 83 kilometer per liter okay so assuming that the fuel consumption in kilometer per liter for all compact cars have a normal distribution construct a 99 confidence interval for the population mean or fuel consumption for compact cars all right so now you have to take out whatever information that you have from the question okay so you have n equals to 16 okay we have only one uh random variable on the right okay n is equals to 16 mean is 12. 5 so this mean is from population mean or sample mean this is the sample mean okay why sample mean because this mean belongs to these 16 cars okay 16 cards gave a mean of 12.
5 so this is sample 12. 5 and standard deviation of 0. 83 assuming okay normal distribution construct 99 okay you have this 99 confidence interval right so from this 99 uh 100 minus 99 is one percent so one percent you change it to not uh to probability you will get up for equals to 0.
01 so this is your Alpha okay so for this question okay to answer to construct the confidence interval you need to know which case is this question okay so um for to in order to identify the case okay you need to know whether population variance is given or not so population variance in this question is not given so Sigma Square unknown okay so if unknown it's it's where the case two Orchestra okay and then you look at the N the N is small or big the N is 16 16 is less than 30. so less than 30 it is case three okay case three is when you need to use T distribution the formula is T equals to X bar minus mu over s over square of n okay so the alpha here is 0. 01 so Alpha over 2 is 0.
005 right okay so you know that we need T distribution um we need to know the value of T distribution okay so never mind we construct the confidence interval first so from this formula okay from this formula um it is mu right mu and then T Alpha over 2 n minus 1 the alpha over 2 and then times s over square of n times s over square root of N and then X bar minus X bar plus okay so this is your formula okay so you substitute everything inside okay you have X BAR value you get the value of s and n but you don't have the value of T Alpha over 2 so we need to find the value of the alpha over 2 from your table okay so now please turn to three h are 35 page 35 40 distribution critical value for T distribution okay so you need to find for Alpha over 2 which is 0. 005 so 0. 005 is there but on the First Column you have V right so V is the degree of Freedom okay so you need to know what is n minus 1 based on the formula right so T Alpha over 2 and minus 1.
equals to T 0. 05 sorry 0. 005 0.
005 and minus 1 is 15. okay you just search from the table two point nine four seven okay so 2. 947 so you substitute everything okay so um this one is 12.
5 minus 2. 947 times s is 0. 83 over square root of 16 view same okay so when you calculate you get the value of 1 1.
885 mu 13115 so this is the value from your calculator so basically we can say that we are 99 confidence that the means for fuel consumption for compact cars is in between 11. 885 and 13. 115 okay so that's how to interpret this confidence interval all right okay the next question is on this diameter okay still cooperation produced iron rings that are supplied to Arab core limited very limited okay uh these strings are supposed to have a diameter of 60 cm the machine that makes this ring does not produce each ring with a diameter of exactly 16 surely because um there will be uh plus minus right the area Okay the diameter of each ring various slightly it is known that when the machine is working properly the mesh the Rings made on this machine have a mean diameter of 60 cm the quality control Department takes a random sample of 35 such rings every week calculates the mean of the diameter for these rings and make a 99 confidence interval for the population mean okay so this is just a situation so if either the lower limit of this confidence interval is less than 90 and 59.
938 CM or upper limit of this confidence interval is greater than 60. 063 CM the machine is stopped and adjusted okay a reasons of reason of such sample of a 35 Rings produced a mean diameter of 60. 038 centimeter with a standard deviation of 0.
15 centimeter based on this sample can you conclude that the machine need adjustment So based on what you you read the machine will need adjustment when the confidence interval is uh less than 59. 938 and more than 60. 063 so this knit adjustment this one knee adjustment Okay so um you need to find the confidence interval and to you need to make sure that the lower limit upper limit of your confidence interval is it between this in interval or outside the interval okay all right next okay let's try to answer this question again so your end here is 35 okay just now need adjustment when less than 59.
938 or more than 60. 063 right okay so n is 35 and then X bar is 60. 038 and standard deviation is 0.
15 and then Alpha is 0. 01 okay so Alpha over 2 is 0. 005 okay so based on this question we don't we don't know the population variance Sigma Square unknown okay by n is greater than or equal to 30.
so this is case number two okay case number two all right so case number two the formula is z equals to X bar minus mu over s over square of n okay so our confidence interval is uh our formula for confidence interval is this one X bar minus z alpha over 2 s over square root of n X bar X bar plus z alpha over 2 s over square root of n okay so you have you have X bar you have S you have n right okay we need to use to search for z alpha forward which is 0. 005 okay so zero point zero zero five is two point five seven five eight okay so you substitute everything inside the formula 60. 038 uh plus minus 2.
5758 times 0. 15 over square root of 35 okay so you will get okay you do the calculation you will get 59. 9727 and also 60.
1033 again so I will write the uh the lower limit and upper limit in the interval like this okay so this represent the lower limit this represents the upper limit okay so now let's see whether the machine need adjustment or not all right so our lower limit is 59. 9727 which is inside this uh interval right so the machine does not need adjustment for the lower limit for the upper limit it is 60. 1033 so 1033 is more than 60.