Most traders know the feeling of shorting because it's gone up too much, only to realize later it was the fourth or [music] fifth green session in a row. Session bias quietly stacks up, and if you're not tracking it, you're trading blind to one of the simplest market edges. [music] Session streaks fixes that.
Instead of guessing, it automatically tracks every bullish and bearish session, paints them on your chart, and tells you exactly how long the current streak [music] has been running. In this video, we'll show how it works and how you can start using it for free. Before we look at the visuals, let's talk about what we actually mean by session streaks.
A session is simply a defined trading period like a day on indices or a London or New York session on intraday charts. Each one closes either bullish or bearish. On their own, single sessions don't tell us much.
But when they start to stack in the same direction, they reveal something powerful. Persistence. A string of bullish sessions often signals sustained buying pressure, while repeated red sessions point to consistent selling.
These streaks can act as context for everything else you do. Whether you're fading extremes, trading reversals, or [music] looking for trend continuations. The problem is counting and drawing these zones manually is slow and easy to mess up.
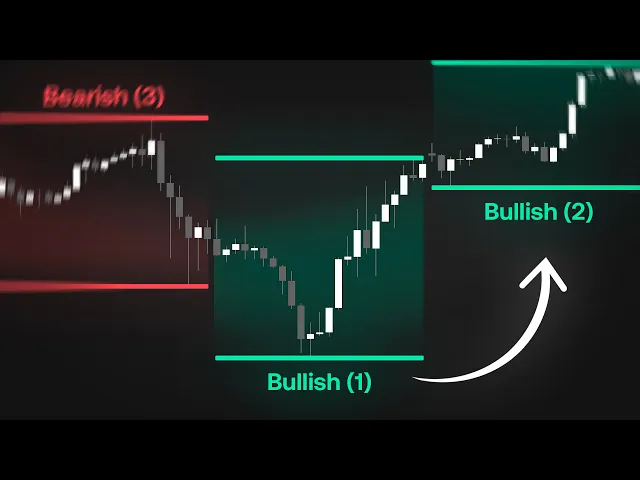
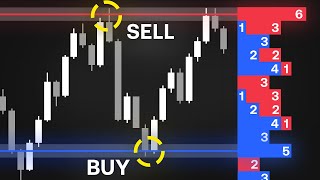
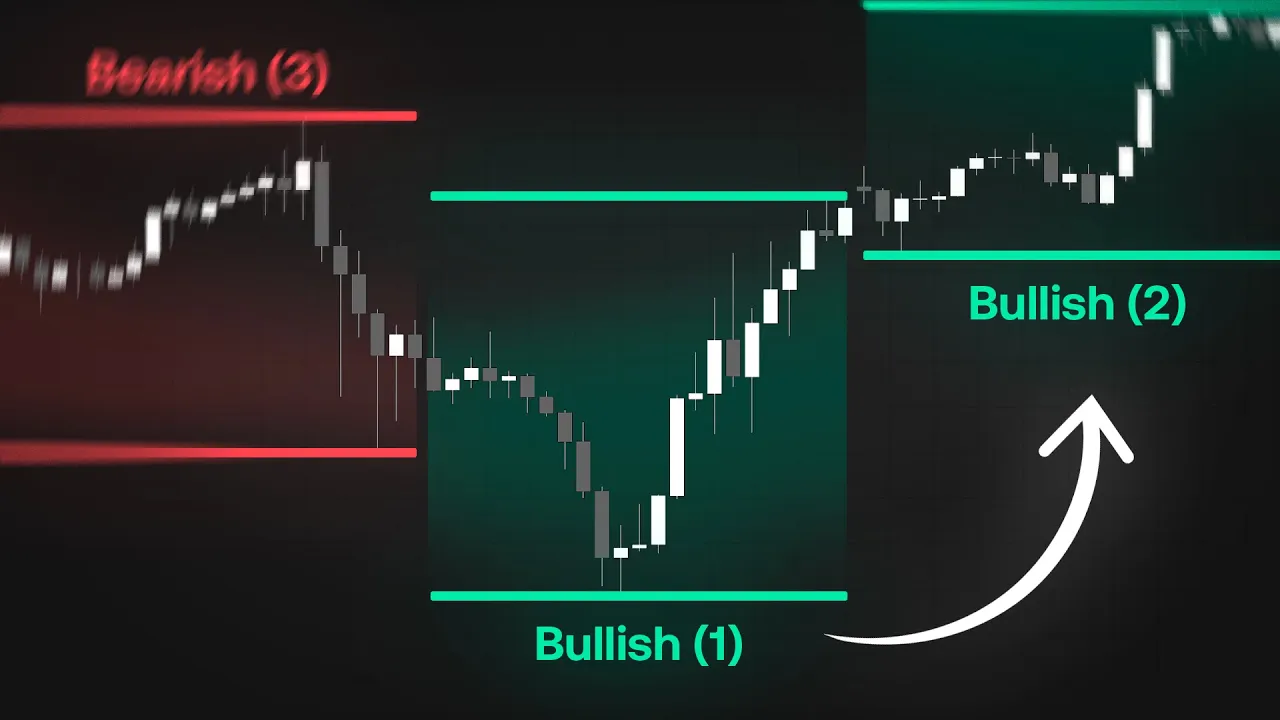
This is exactly what the session streaks indicator automates. When you first add session streaks to your chart, your naked price action instantly [music] gets wrapped in clean blocks of color. Each block represents a complete session.
Bullish and bearish sessions are [music] shaded in your chosen tone with a soft gradient that fills the entire range from the session low to the high. Along the top and bottom of each block, you'll see horizontal lines marking those extremes, giving you readymade intraday support and [music] resistance. Right in the middle of every block, the indicator prints a label like bullish three or bearish two.
That number is the key. It tells you how many sessions in a row price has closed with that bias. As the streak continues, the count updates in real time so you always know whether you're trading into a fresh move or a stretched late stage run.
Going into the settings of the indicator, you'll find only a few options, keeping the tool simple and fast. Under the dashboard section, you can toggle the onchart dashboard and choose its position on the screen, as well as the display size so it matches your layout. The dashboard itself shows the current streak, plus statistics like how many bullish and bearish runs have occurred, [music] along with their median and most common lengths.
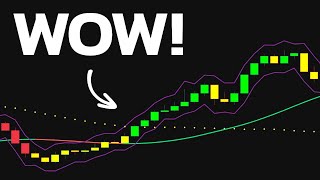
Under style, you can customize the bullish and bearish colors. Adjust transparency to either blend the zones into the background or make them pop. And choose between a horizontal or vertical gradient fill.
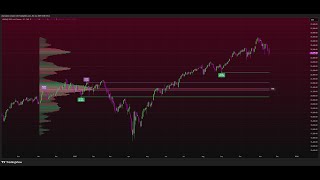
With a vertical fill, the colors of each session will switch to a more solid coloring theme where bearish sessions will look more red, while bullish sessions will look more green. Together, [music] these controls let you tailor how dominant you want the streaks to appear relative to your candles without changing the underlying logic of the indicator. In this example, we're looking at GBP JPY on the five-minute time frame, one of the most volatile pairs in Forex.
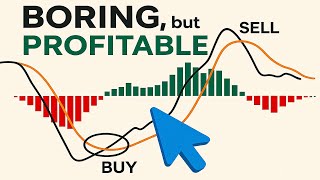
At first glance, price is clearly trending downward, and our session streaks indicator prints a clean 3 [music] session bearish streak. This already tells us that momentum is stacked to the downside. [music] But we don't take trades just because the streak is extended.
We need confirmation, and that's where the oscillator matrix comes in. The oscillator matrix is one of the best tools for detecting true market tops and bottoms. It's incredibly sensitive to shift points [music] in momentum, and its divergence signals often appear before major reversals happen.
At this point, we're entering the fourth session, [music] and we can see something important. Price pushes slightly higher, but the oscillator matrix refuses [music] to follow. Instead, it prints a clear bearish divergence, an early warning that bullish exhaustion is kicking [music] in.
From here, the setup becomes straightforward. We take the trade as price rolls over using the high that formed during the divergence as our invalidation point. Our stop is kept tight just 0.
5% above the divergence high while our target aligns with the lower boundary [music] of the previous bearish session. The result is a clean high probability setup with nearly a 1:3 riskto-reward ratio. This is the power of combining session streaks with the oscillator matrix.
The streak gives us directional context while the divergence provides precision timing, allowing us to catch exhaustion [music] at the very top of the move with confidence. And that's session streaks. A simple but surprisingly powerful way to see when markets are quietly building up pressure through consecutive bullish or bearish sessions.
Instead of guessing whether a move is extended or still early, you can read the streaks directly on the chart and use them as context for every [music] trade you take. You can start using session streaks right now for free inside the Luxalgo library at luxalgo. com.
And if you want to stack even more edge on top of it, pair it with the oscillator matrix toolkit for confirmation. All available for 30 days risk-free. Trade with the trend, respect the streaks, manage your risk, and we'll see you in the next one.