hey guys this video is going to be an advanced tutorial about algorithmic price delivery in institutional Market swings today we are simplifying the market makers buying and selling models in smart money Concepts understanding these models will not only help you grasp how major moves happen in the market but also assist you in being on the right side of the market so guys if that's something you're interested in as always please hit the like button to help us make more videos like this and subscribe to our Channel if you're new see you after the intro and
[Music] disclaimer now we all know that supply and demand is the factor that determines the price on the chart but there is another concept that affects the price movement which is the algor almic price delivery algorithmic price delivery involves engineered Market movements to optimize trade execution and enhance liquidity through strategic trading activities that may exploit or trap unsuspecting Traders these institutional activities are not solely aimed at trapping retail Traders but also involve trapping other institutions this is because retail Traders typically constitute a smaller percentage compared to institutional Traders and central banks in in the Foreign
Exchange Market the majority of trading volume often originates from institutional participants therefore the institutions are after hunting each other these institutions have different strategies Capital time frames and other factors that make their actions distinct from one another contrary to Common belief Banks engage in trading not necessarily for direct profit or loss but primarily for exchange purposes it's crucial to understand that bank trading differs from individual retail trading where profit and loss are more immediate and direct now what's the market maker model in institutional price swings to answer this question let's first clarify some Concepts you've
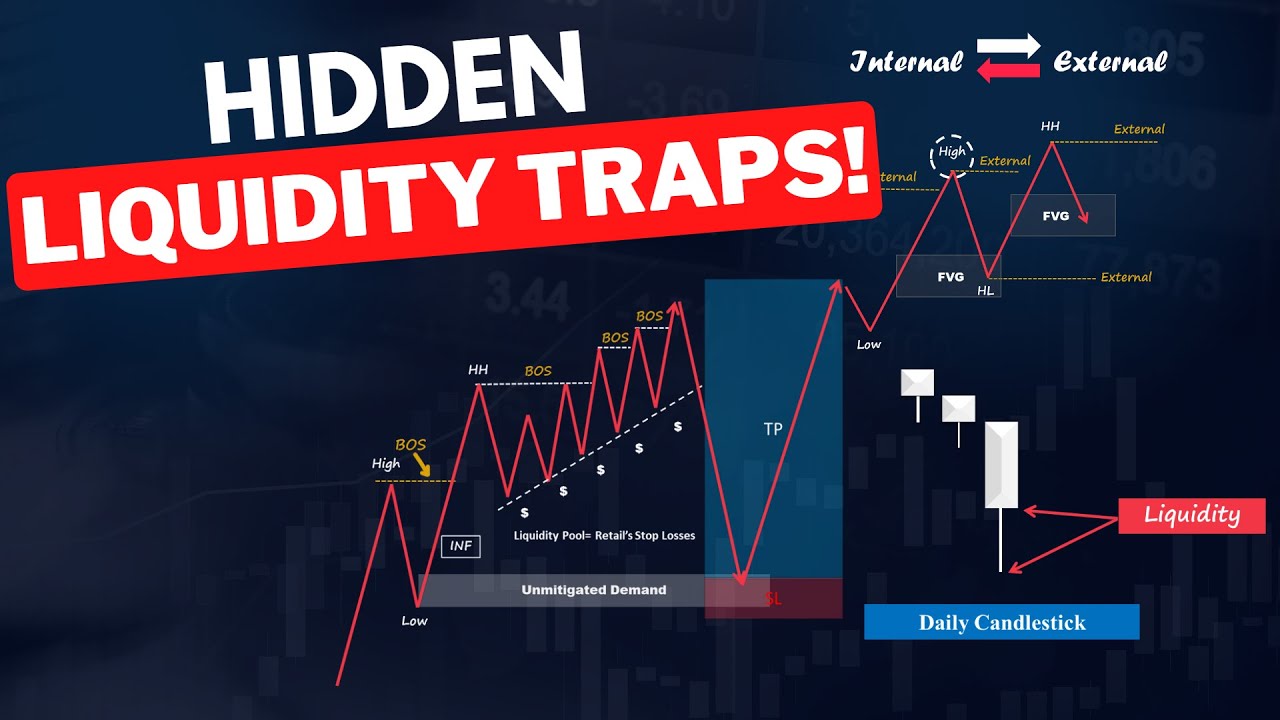
likely heard that liquidity is a key factor influencing price movements but where does this liquidity exist it's not just located above swing highs or below swing lows at every price point in the market there is a substantial amount of liquidity however the specific liquidity we're referring to is of the stop-loss variety there are two types of liquidity in the market buy side and sell side liquidity above a high or a group of highs represents buy side liquidity when the price approaches this level the bearish Traders will go short or they will protect their previously opened
short positions on the other hand the breakout Traders will go long if the price breaks through this level the animated movement that aimed to grab this liquidity is called the buy side delivery it's running High to engage the liquidity above these relative equal highs the algorithmic price delivery has engaged the liquidity by trapping Traders on both sides and then the smart money would go short now let's apply the same concept to the bearish scenario liquidity below a low or a group of lows represents sell-side liquidity like the bullish scenario when the price approaches this level
the bullish Traders will go long or they will protect their previously opened long positions on the other hand the breakout Traders will go short if the price breaks through this level the animated movement that aimed to grab this liquidity is called the sell-side delivery the algorithmic price delivery has engaged the liquidity by trapping Traders on both sides and then the smart money would go long to engage the buy side liquidity now on the actual chart here we have the euro dollar on the 15-minute time frame the first thing we want to check is where we
are in terms of the trading session and hour this giant candle is the start of the London session which is one of the most liquid periods of the day for the euro dollar now based on what we discussed earlier this area of equal highs represents the buy side liquidity the traders that got short here have their stop losses placed somewhere above these equal highs so a runup Above This high would attack the stop losses and engage the buy stops which are the buy side liquidity subsequently this area of equal lows represents the sell-side liquidity if
the price Taps into this area Traders will go short and place their stop losses somewhere below this Wick so a rundown below this low would attack the stop losses and engage the cell stops which are the sells side liquidity right now the overall Market bias is bullish the institutional price delivery has the power to affect the price but it cannot change the overall order FL low now let's see what would happen here a sell-side delivery engages the liquidity below this low and then the market runs up to engage the buy side liquidity the most advanced
trading scenario would be to sell along with the sell-side delivery and to buy along with the buy side delivery however it would not be an easy task at all trading is about the future price movements and the nature of the future is unpredictable it's impossible to Define every single possible scenario but through time and practice you will realize that some repetitive patterns happen in the market over and over again now here the market went down for two primary reasons one it goes down to engage sell stops which is sell-side liquidity or it goes down to
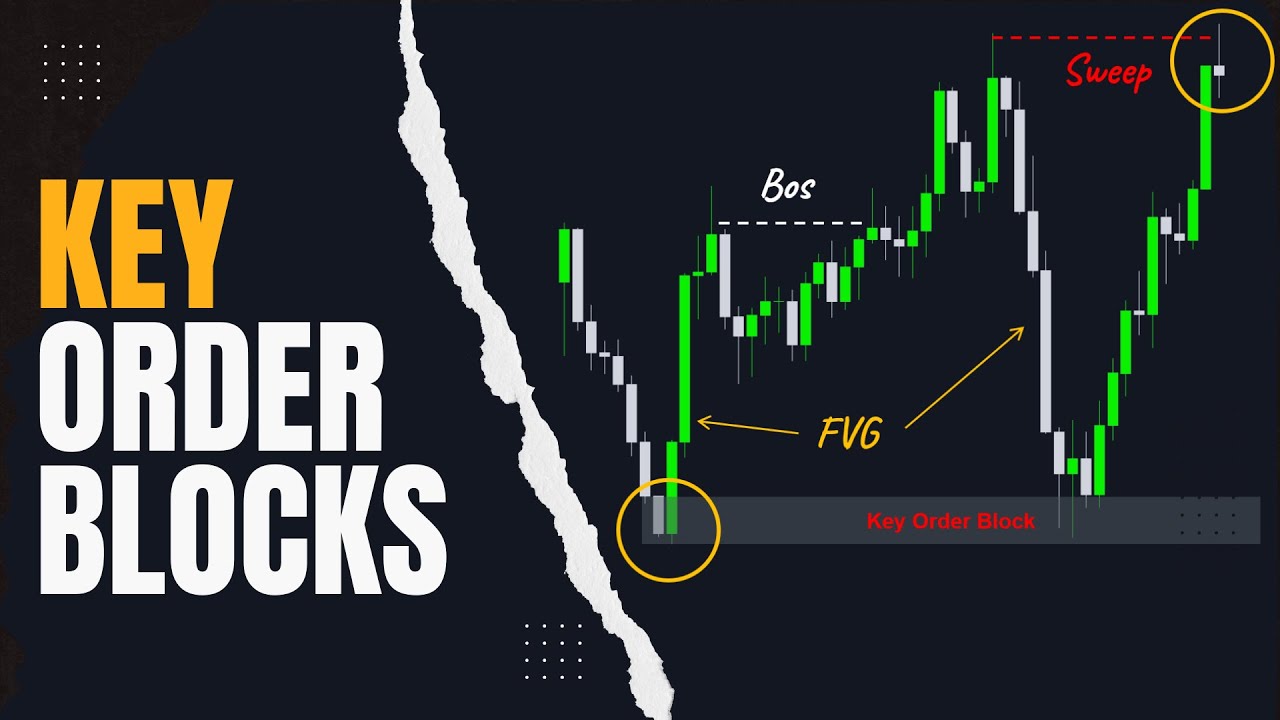
an inefficiency if we look at the left side we can notice this area of fair value Gap we have this small segment of price action where the previous candle High stops here and then the next candle opens immediately and and pushes higher and when the next candle trades the Wicks leave a gapped area behind this separation between these candles is what we call a fair value Gap when a large amount of money enters the market and creates an imbalance between the buyers and sellers the fair value Gap patterns form between the candles creating a phase
of inefficiency when these areas form on the chart the market rallies to these predetermined levels because the market has to trade back this area to patch over the inefficiency here so if we get back to the time before the movement happened what do we have here we have a buy side imbalance which means the buyer has strongly overcome the sellers and we have sell-side inefficiency which means that the price should refill this inefficient area to restore the balance also we have this area of equal lows which contains lots of sell-side liquidity so basically we had
a sell-side delivery engaging the sells side liquidity which is stop losses and sell stops below this level rejecting the fvg area and then we have a buy side delivery that targets the buy side liquidity which is the buy stops above these equal highs now this is the basic explanation of the market algorithm that produces the fluctuations and not because of the buying and selling pressure now the next thing you need to know is that the market tends to move away from the level that recently has been liquidity swept on the contrary it tends to move
towards the level that contains the liquidity imagine that this line chart is the market movements when the market sentiment is bullish the sell-side liquidities are more important than the buy side liquidity because sweeping the liquidity below these lows signals possible bullish continuation and an opportunity to Long align with the dominant Trend however if we have something like this on the chart with a confirmed change in character this liquidity Zone becomes our potential Target because once again the price is absorbed to liquidity levels then there is a higher chance for the price to continue pushing higher
if we get a liquidity sweep pattern at this level and the price fails to break and trade below this Zone and then our targets would be the buy side liquidity zones we can take multiple order block entries along the way if the price continues pushing higher now you should have a basic understanding of how the algorithmic price delivery makes the market fluctuations towards the liquidity zones on the chart we said that after the liquidity sweep pattern formations the market will move away towards the liquidity zones on the other side so let me show you how
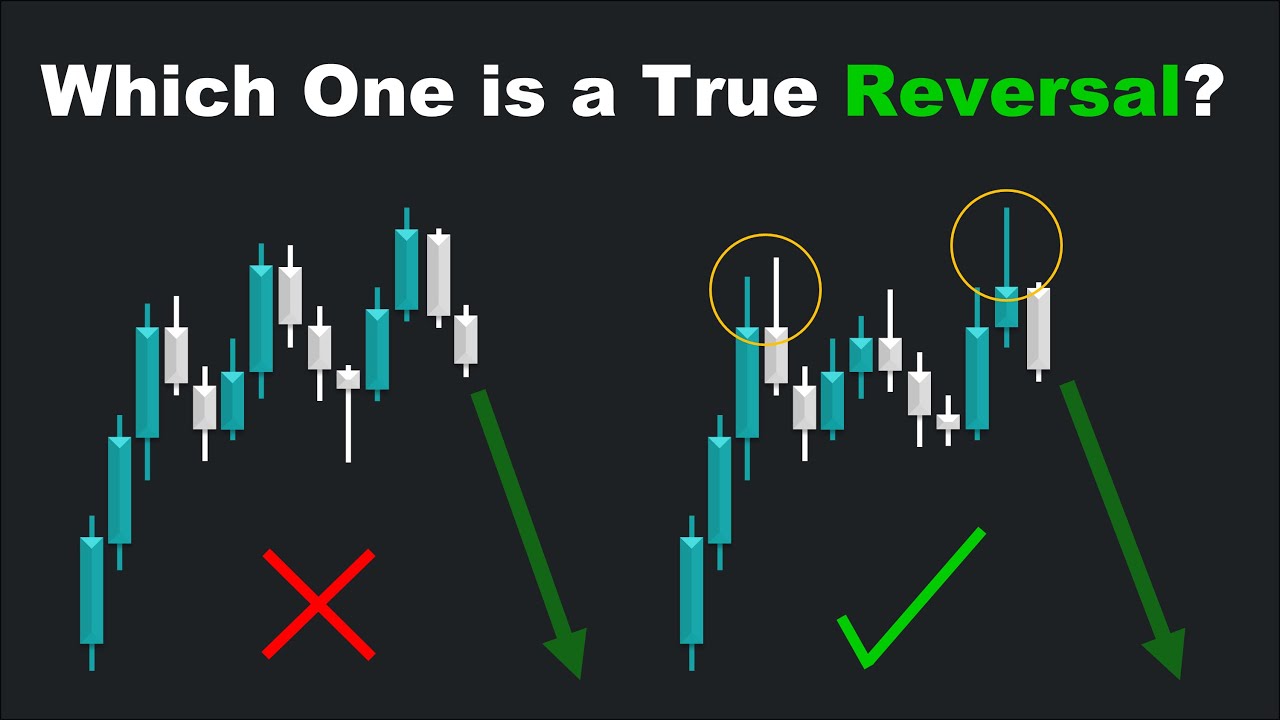
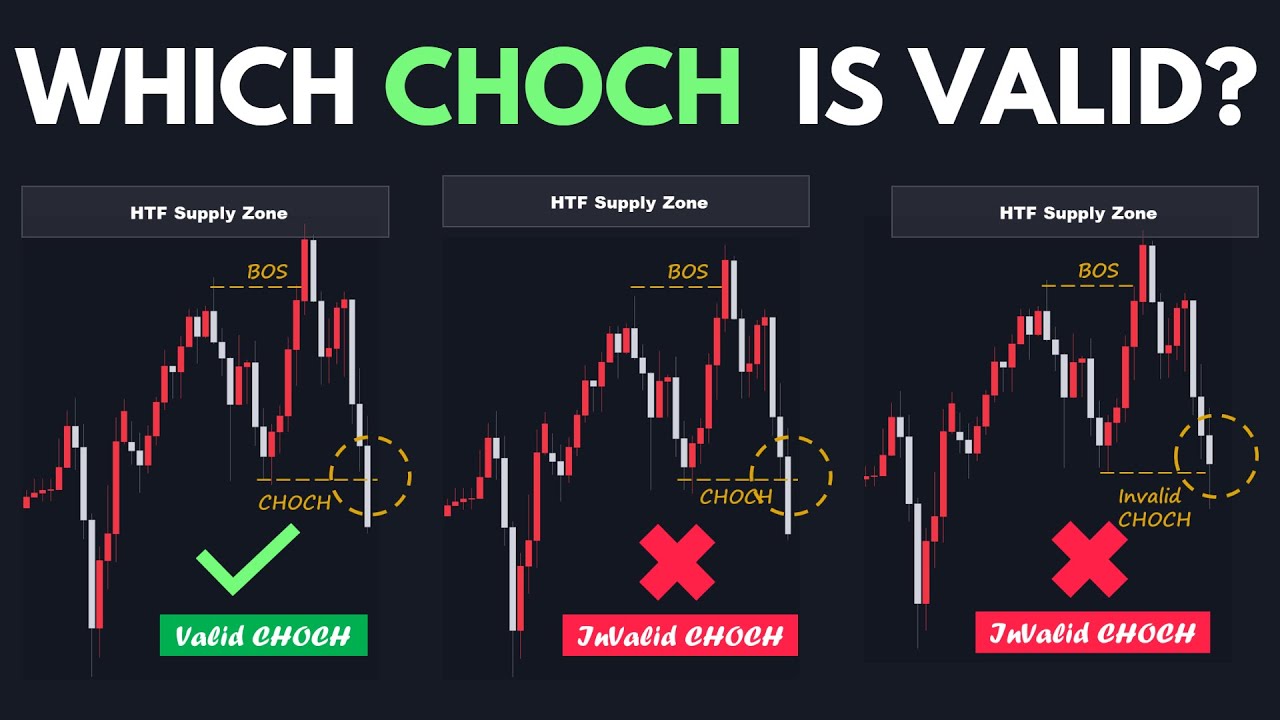
a valid liquidity sweep pattern and reversal occur on the chart imagine that below the lowest point of this Wick is where the liquidity exists so in a valid liquidity sweep pattern we want to witness a wick breakthrough at this level and immediately close above the range or we can only have one candle stick close below this line and then the next candle should immediately close back inside the range now this is an early sign that we might witness a temporary reversal at least to this Supply level in front of the price if the price manages
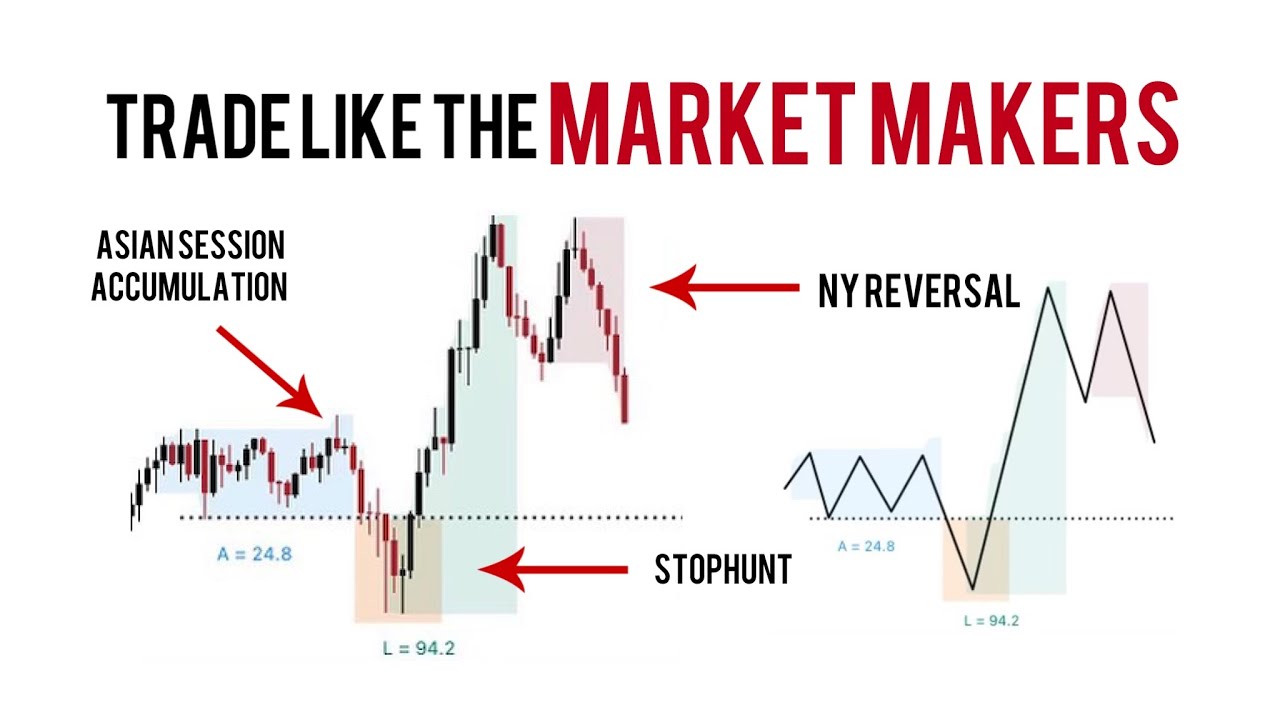
to break and close above the supply area we would have a change of character which confirms that the downtrend is over and a true reversal is coming so combining the change of character concept with the liquidity sweep pattern will give us a perfect insight into future movements now let me show you some practical examples on the real chart to demonstrate how we analyze the price action when trading opportunities arise here we have the euro dollar on the 15 minutes chart this is the price movements in the Asian session and right now we are at the
beginning of the London session which is when we will look for trading opportunities the market sentiment is bearish so there is a higher chance for the price to continue pushing downwards but according to the market maker model and what we have thought in this video here are two common scenarios in the first scenario the price will tend to grab the buy side liquidity that the Asian session has produced and then move towards the sell-side liquidity Zone on the contrary if the price is likely to reverse it grabs the sell-side liquidity below these lows and then
starts pushing upwards towards engaging the buy side liquidity now let's see what will happen based on what we discussed earlier here we have two liquidity sweep pattern formations we had a run below these equal lows to engage the sell-side liquidity following we had run above these equal highs to engage the buy side liquidity then the market made a sharp move towards the downside along with the dominant downtrend and created a fair value Gap area now we have buy side inefficiency and everything signals possible downside continuation so we can take short trades if the price makes
a pullback using multiple entry setups depending on your trading plan here we have gold on the 1hour chart let's ident ID ify the buy side and sell-side liquidity zones on the chart here at the top this triple top contains tons of liquidity and at the bottom these equal lows are our sell-side liquidity area we also have this area of fair value gap which means we have buy side imbalance and sell side inefficiency so we anticipate that the price will patch this area however right now we don't have a clear bias of Which side will price
move so let's see what the price would do next here we have this bearish candle that closed below these equal lows and then the price immediately got back inside the range so we have a valid liquidity sweep pattern below these equal lows based on the market Maker's model now that the price has swept the sell-side liquidity we anticipate a movement toward the buy side liquidity Above This high so let's zoom into the 15minute chart and look for trading opportunities here on the 15 minutes chart this is the same liquid liquidity sweep pattern and this area
is our buy side liquidity to Target before placing any trade we need a change of character to confirm the reversal for the short-term downtrend and then we look for opening long positions change of character appears when we get a break and close Above This level now here's the trading setup we use for this entry first we need a movement that creates the fair value Gap area and break of structure then we wait for the price to return to this area open a long position and close the stop below that Gap area when you're trading for
real expect ups and downs the trick to being a winner is to be disciplined and stick to your rules you'll face losses but if you stay focused and follow your plan you'll come out on top discipline means not letting your feelings drive your decisions and always learning your trading rules are like a shield protecting you from the crazy Market in live trading being disciplined and sticking to your plan is how you win in the long run so guys that's it for this video I hope this video provided value to you if it did please go
ahead and smash the like button to show your support and if you're new here consider subscribing to our Channel see you in the next episode