Okay folks and we are here the last structure the teaching of the ICT mentorship can you believe we're here all right so ICT short-term top-down analysis four hours to five minutes okay let me press it again by saying this is my personal approach so everything that you've been taught This is how I actually employ it from a four hour down to a five minute time frame focus on this presentation is to determine the impact of the four-hour perspective on a given asset or more fit identify directional bias with a high time frame intraday four hour
chart classify the PDA raised accurately to assist in key levels complete and institutional analysis on a four hour basis Okay so the beginning of my analysis when you start on a four hour chart working our way down into lower time frames the first thing that's in my mind is the day of the week that we're trading okay in other words what day of the week are we on preferably this is going to be a weekend analysis and I'm going to be looking at the likelihood of Us opening up on Sunday watching where we trade see
what there's any if there's a gap if it's in A rush to get somewhere right away at the beginning of the week but typically I'm going to be watching what's going on Monday to see what Tuesday and Wednesday can bring for once that one kill before we go any further though all monthly weekly and daily analysis is included when viewing the four hour perspective after I determine the day of the week and what type of profiles and templates that may exist for that particular day I'm going to be looking at ipta and defining it in
true day so I want to be making sure I'm only focusing on setups inside of the parameters that make up true day as talk to you in the mentorship and then I'm going to be looking at specific times of the day and these are your kill zones that's the one that open New York open London close and Asia now I'm going to be including the Central Bank dealers range So I'm going to be incorporating that range in price looking for the consolidations in there and I'll be looking for standard deviations to align with potential highs
and lows of the day I'm going to be incorporating the Asian range so I'll be looking for again standard deviations there as well and now the flout I'll be including the deviations on the flout which is basically the Asian range And Central Bank dealers range time limited to combined that total range high and low I'll be looking for standard deviations for that and we'll talk more about that when we get into deeper discussion for this presentation okay intraday profiles what do the intraday models suggest in terms of price action are we gonna have a down
day with an up due to swing first in London or is it going to be a quiet London and a run in New York so I'm going to be uh referring to potential intraday profiles I'm going to be doing my PD arrays to qualify my key levels for targets and entries and I'll be including average daily range projections as well to help me facilitate the daily highs and lows on the day and all of these insights in addition to the analysis ideas I've had transposed From the monthly weekly and daily I take what I see
on the four hour and I carry that over into the intraday charts now here's where we have to decide what we're going to be doing are we going to drop down from a four hour to a 60 Minute chart are we going to drop down to a 30 minute chart a 15 minute chart a five minute chart even a one minute chart I didn't include because I don't like one minute charts but you need to decide where you're going to go from Four hour so I don't want to push you into a mode and say
it has to be this way because there's obviously many different ways to look at time 60 Minutes is a decent time frame to drop down into but it's still gonna have to be refined a little bit more I like to go down from a four hour down to a 30 minute or 15 personally and then further refine it for a five minute if I can get my entries and executions off on the five minute that's Great but I'm usually looking for the setups to confirm entries on 15 minute minimum the best is to get it
down until five minute but I don't always have the luxury of getting into a five minute chart to refine it but if I do I'm going to certainly try to do that but from four hour down to the next time frame I'll leave that up to you because there's got to be some measure of Personalized approach in other words you got to be able to make it work for you and the reason why it's got to be flexible is because the time frames below four hour may be muddy on the 60 Minute chart but maybe
a lot more clear with gaps and such on the 15 minute or five minute chart so it's important that you know when we drop down from a four hour what we're doing is we're looking for a time frame that produces fair value gaps That's the key so you may not see a fair value Gap going down into a one-hour chart but it may exist on a 15 minute time frame so that way you can pick your PD arrays relative to gaps bullish order blocks Breakers of that nature but you'll be able to see it when
there's lower time frames because they can become more spotty the higher time frame is going to smooth out price the lower time frames are going to create those little pockets of illiquidity where it Needs to be refinished and refined okay day of the week using the previous daily weekly and monthly analysis I look for reasons to trade in that higher time frame directional bias and if I'm bearish from the higher time frame I look for shorts on Mondays Tuesdays and Wednesdays if I'm bullish from the higher time frame I look for Longs on Mondays Tuesdays
and Wednesdays now if I'm expecting a Monday Tuesday or Wednesday influence and it does not materialize I look for the late week scenarios on Thursday and Friday to come into fruition the other words if we have weekly templates or if I have daily uh templates that I expect to see unfold in price action or Market I'm watching if I don't see what I anticipate as a bullish move or bearish move on Monday Tuesday or Wednesday say I got it wrong or it doesn't materialize whatsoever then I'm Going to be focusing on Thursday and Friday templates
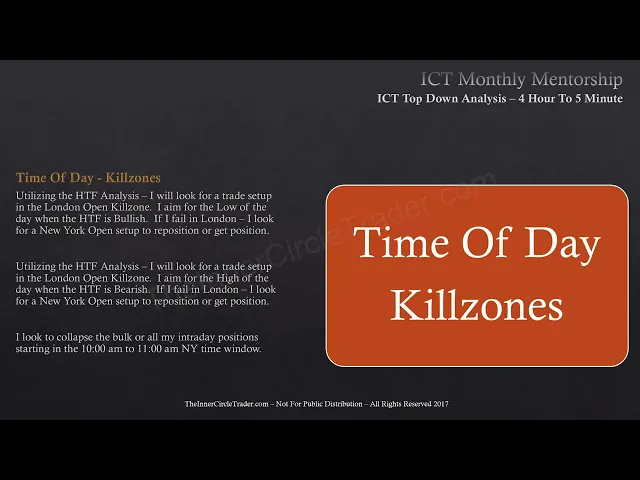
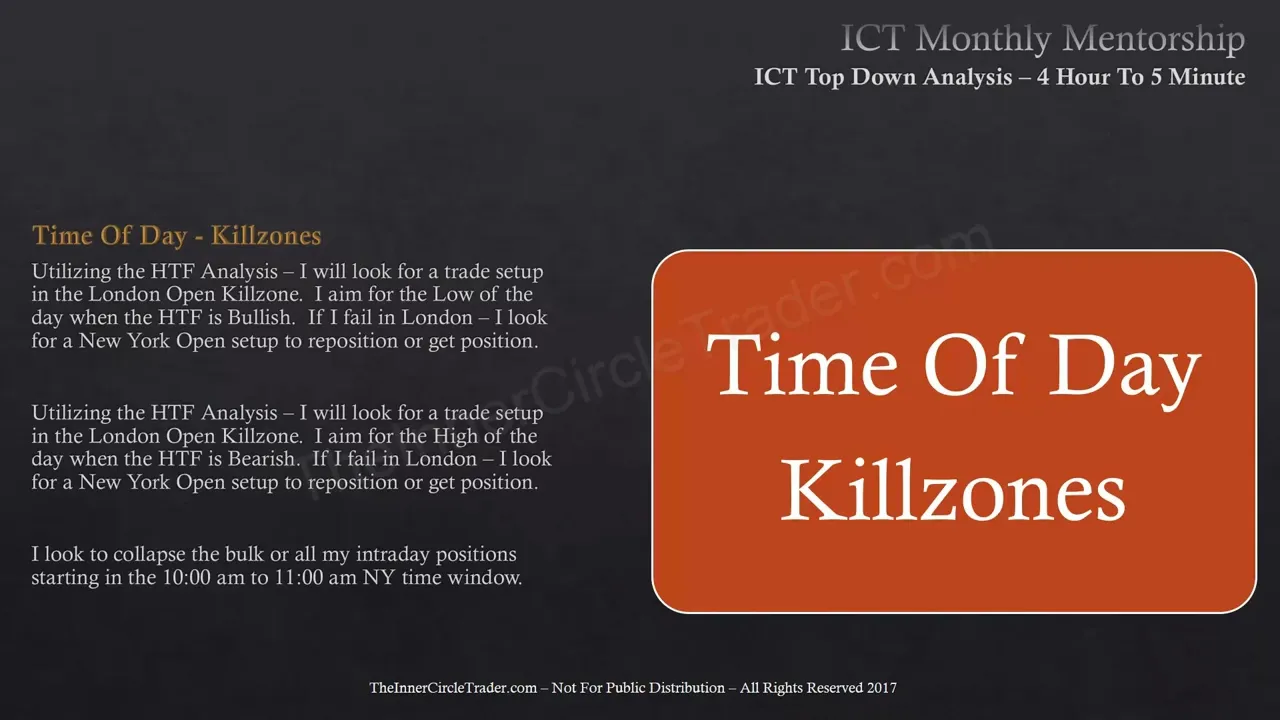
and what type of weekly profile that may align as well using the economic calendar if the true day now I look for setups from the higher time frame analysis within the hours of defined by true day now the bulk of the daily volume will be between 3 AM and 10 a.m New York time I want to either position myself correctly ahead of this window or during the first half of it After New York open I have to lower my expectations and be content with smaller objectives intraday time of day kill zones utilizing the higher time
frame analysis I will look for a trade setup in the London open Kill Zone I aim for the low of the day when the higher time frame is bullish if I fail in London I look for a New York open setup to reposition or get a new position Utilizing the higher time frame analysis I will look for a trade setup in the London open Kill Zone I aim for the high of the day when the higher time frame is bearish if I fail in London I look for a New York open setup to reposition or
get a position one I Look to collapse the bulk or all of my intraday positions starting at the 10 o'clock to 11 o'clock in the morning New York time window that's profit taking or the beginnings of lemon close Central Bank dealers range deviations now when the higher time frame analysis suggests that I should be bullish I will use one two or three negative standard deviations in other words going down the Central Bank dealers range for long entries I look for 15 to 60 Minute discount arrays that overlap with the standard deviations to determine which I
will frame my entry on When the higher time frame analysis suggests that I should be bearish I will use plus one plus two or plus three standard deviations of the Central Bank dealers range for short entries I look for 15 to 60 Minute premium arrays to overlap with these standard deviations to determine which one I will frame my entry on so what I'm looking for is standard deviations in the form of one two or three Higher when I want to go short but I'm not just simply selling short on one standard deviation or two standard
deviations or three standard deviants deviations up I'm looking for a premium array if I'm bearish I want a 60 Minute time frame that will overlap with that same standard deviation so it's a matter of blending I don't just indiscriminately add one or two deviations and say okay I'm going to go short there I'm looking for a 60 Minute Less than four hour or a 15 minute premium array it may be a fair value Gap it may be an old height needs to run back above for stops so there's a turtle suit but it overlaps with
the Central Bank dealer's range deviation that's the key you want to blend those things together and again it's all about the pdra Matrix if you don't use that or understand it you're not going to be consistent with my stuff it's simple as that Okay the Asian range if my higher time frame analysis is bullish I will look to enter Longs below the Asian Range High preferably under the low if my higher time frame analysis is bearish I will look to enter shorts above the Asian range low preferably above the Asian Range High now let me
rephrase that see we understand each other perfectly if I'm bullish The best scenario is to Go long below the Asian range low but as long as I'm below the Asian Range High I'll still take what I consider high probability longs if I'm bearish I preferably want to go short above the Asian Range High but as long as I'm trading short above the Asian range low it's still defined as a high probability scenario now if I'm bullish I expect Asian Range High to be retested for entry as support or adding to open positions for long If
I'm bearish and I expect Asian range low to be retested for entry short or adding to an open position for short Holdings in other words if I have a low that I've bought at and the Asian Range High comes back down into retracement and hits the Asian Range High many times it'll do that and then expect accelerate and expand towards the New York open sometimes throwing in New York open the Asian Range High when it's been bullish Will be retreated to and retested as support and then it'll rally again going into London close or many
times into the next day or following the same thing is I said in opposite terms for when it's bearish if you're looking for if I'm looking for an opportunity to go short and the market has already moved down away from the Asian range during New York it can rally back up into the Asian range low and retest that and that could be another Opportunity for me to get short or add to an existing position for the daily range projections I look for standard deviations in the Asian range to overlap with those that are seen in
the Central Bank dealers range for the low and high of the day so in other words what I'm saying here is Central Bank dealers range and Asian range confluences when they get really close to a level and it lines up with a PD array chances are You're probably going to be now very close to the high or low of the day all right some of you been dying for this one flout and you've probably been expecting some PhD level presentation but it's not that hard the south is the Central Bank dealers range and the Asian
range combined that's that whole time window the highest high and the lowest low in the in the form of the wick and in the form Of the bodies of the candles so go back and look at the lesson I talked about in this mentorship but if I am bullish I look for overlapping in the total range of the Central Bank dealers range and Asian range that has been divided in half and this makes one standard deviation so in other words if the range that starts in Central Bank dealer's range opening all the way to Asian
Range close at midnight New York time whatever the highest high and whatever the lowest Lowest say that is 40 Pips half of that range is 20. 20 Pips is the standard deviation for flow and I go from the center point go up one that's one standard deviation two three four so on those standard deviations it's half of the range that makes up essential Bank dealers range and Asian range in terms of time find the highest high and the lowest low divide that range in in half project that up Only half of the range that makes
the standard deviation it's not the full range high to low looking for Confluence is a flout standard deviations and Central Bank dealers range and Asian range with discount arrays on the 60 to 15 minute is ideal for entries if I'm bearish I look for overlapping in the total range of the Central Bank dealers range in Asian range that has been divided in Half as one standard deviation looking for Confluence is a flat standard deviation and Central Bank dealers range and Asian range with premium arrays on a 60 Minute to 15 minute is ideal for entries
so I already know you're going to be asking for examples of this and I'm going to show you some next week when we finish up the month of August but flout is only half of the total range and you start nesting them out lower and lower and Lower now flout can be many standard deviations there isn't a rule-based idea like there is for Central Bank dealers range or Asian range agent range can go up one or two standard deviations and create a hive or down one or two standard deviations create a low of the day
flout can be many standard deviations that have to keep being applied and added to as the daily range goes up you keep adding another level of flout when We start approaching Extremes in the day and into high premium levels on the 60 Minute or 15 minute time frame then we're close to London close then you're probably going to be real close to the actual low or high of the day intraday profiles when I'm bearish I look for high today in London and when I'm bullish I look for low of the day in London when I'm
bearish in the four hour has not yet traded to a discount array I Expect New York open to continue lower when I'm bullish and the four hour has not yet traded to a premium array I expect New York open to continue higher a lot of questions I get is how do I know there's going to be a New York session reversal if it trades to a four hour premium array it's probably going to be a market reversal in New York and it's going to come lower if it's been trading down and it trades down Into
a four hour discount array during the New York session there's probably a high probability that's going to create a New York Market reversal as long as that has not happened or has yet to happen chances are the New York session will be a continuation there of of the higher time frame momentum and bias in institutional order flow and until that happens the London and New York will be in agreement in terms of Direction If you want more information if you need to be refreshered go back to April's content and it gives you more specifics about
intraday profiles okay then I note the key price levels and once I determine a portion of Market structure I want to use for my trade ideas in other words I'm defining a range either I'm going to operate as internal range liquidity or I'm not going to be working off external range liquidity I calibrate those levels from the PD array Matrix to the nearest 10 level or five level and we've already seen this slide three other times so I'm not going to go into great detail and then finally I look at the average daily range projections
and I use a five day average daily range to help me determine possible intraday range extremes for the single day that I'm Trading now if I'm bullish I look for the market To trade to the average daily Range High now if this average daily Range High is broken I use the Fibonacci on the average daily range high and low and I use that as a projection for 127 extension and 162 extensions as targets by themselves they're nothing but I look for a premium array when I'm looking for average daily Range High when it's broken I
look for 127 to line up with a premium Ray on a 60 Minute or 15 minute time frame or 162 extension to overlap With a 60 Minute or 15 minute premium array and the reverse is said when I'm bearish if I am bearish I look for the market to trade to the average daily range low and if the average daily range is broken and goes well beyond the average earrings low I use the FIB on the average daily range high and low for a 127 or a 162 percent extension for downside targets by themselves they
don't mean anything But they have to overlap with a discount array on a 15 or 60 Minute time frame blending those things together and incorporating Central Bank dealers range standard deviations Asian range standard deviations and flout standard deviations you'll get many times within 10 Pips of the daily high in the low that's the reason why I want to get out 10 Pips before because I may be wrong in my projections on where the high and the Low may form and preferably if I'm long I'm trying to calculate where that high is going to be at
I want to be out definitely in the direction it's moving will I hold for the last couple Pips no every time I've done that either frustrated me because I never got to where I wanted it to go or it fell short so these are all projections projections are not absolutions the standard deviations are assisting they are not Guaranteeing okay they're not panaceas over time you're going to see they have very good results in terms of helping you determine where the level is but as you can see there's a multiple of varying standard deviations that can
come from the flout Central Bank dealer's range and agent range it's the blending of all three and then using and average daily range and if it breaks on the average daily range it means you got a big range today how Much of a big range day you got to start going back and looking at those standard deviations on Central Bank dealers range flout and Asian range to overlap with as you keep building them up on bullish days are adding them down when it's bearish looking for the respective premium or discount array on the 15 or
60 Minute time frame when they arrive at an overlap or converge you're usually within 10 Pips of a variance between that and that's why I want to be getting Out early I don't mind getting out and leaving the last 25 30 Pips on the table I don't care as long as I'm getting consistent range expansions and I'm able to get a nice piece of it that's all I care about I've been doing this for a very long time I've never been perfect I've never gotten to the actual High every single time I've done it or
getting out the low every single time I've done it and every time I've tried to be that consistent or That accurate it's always hurt me so I want to be getting out as long as the Train's moving in that direction and I get out I'm going in the right direction you can't go wrong with taking profits whether demo or life all right patterns for consideration now obviously I've taught from the context of a condition which is a higher time frame directional bias and then the stage what sets your trade up what's it look like okay
then you execute Execution is talked about in the mentorship on where we get in and get out whether we're buying on limits or selling on limits or living living orders or Market orders um it's been talked about and explained to you uh it's not my point to give you entry techniques because that's already been covered the main thing is where's the setups because once you understand where the Market's going and you understand the setup the entry stuff is Easy so as a technical Trader we only need one setup or one pattern to trade on now
a lot of tools have been taught to you something that you're probably head swirling around like what am I supposed to do next these lessons have provided you how I actually use it by step by step approach what I do conceptually now each one of these things I've given you in terms of what I Look to do has been explained in Greater detail in previous Lessons so it would be stupid for me to waste your time and mind to go and rehash all that again because the first complaint I would have if it was me
I'd say well aren't you just repeating what you said no I'm telling you in the order of the very specific detail of the order of how I do each thing then go back to the mentorship and everything that I taught you it's all there this is the order that I do it now once I go through that whole list of things in the order That I've taught so far in August content in all four teachings up till now at some point you will arrive at all those conditions in green and it says that you have
to look for a trade or a setup now I'm going to teach you the two setups that I trade I don't do anything else I don't look for any other patterns I don't try to work on any other information this is all that I look for Now again I'm saying this to tell you that this is how I internalize and how I look to execute in the marketplace it is not an invitation for you to do this and never experiment never test ideas or um inspiration that you get by looking at certain things like I've
looked at several different approaches to trading this past week with you on live sessions and we went through a couple different Things we looked at the the scenario with the euro dollar and eventually panned out we looked for scenarios in the Japanese Yen it panned out we looked for a market move in gold which we'll look at before we close this session out and it panned out so you only need one pattern and the importance of sticking to that one pattern is Paramount because if you try to change or do more than one thing in
the beginning you're not going to be Able to measure consistency and you're not going to be able to build your confidence which is necessary to sticking to it there's going to be periods when it doesn't work or you do it wrong and that's normal it's nothing to be ashamed of it's nothing to be afraid of you're going to screw it up which is the reason why I teach in a demo it gives you the permission to mess it up it gives me the permission To mess it up as your teacher okay because it's going to
harm nobody it's not going to hurt me monetarily it's not going to hurt you monetarily no Financial damage can happen and you can't get emotional about making money in a demo because it's not real spendable money so that's the environment you need to learn in so over the next couple of slides I'm going to actually share with you the actual things that I look for how my Mind interprets price and these are my go-to patterns you're going to see that they're not overly complicated you're going to recognize them right away you're going to see oh
yeah I've seen them when we talked about it you're going to know right away that I'm not doing a whole lot I don't have a slew of all these different things now I can see ICT Stingers I can see reflection patterns I can see overall patterns all those Things that I've talked about in free tutorials and on YouTube and all that stuff I could see all those things there and I can see them and I let them pass I talk about oh it could do this and it could do that but I'm not executing on
them the things that I execute on either in demo in teaching and or that I do in my live trades these are the patterns I hunt this is what I'm looking to do now again please understand that I am not trying to press you into the mold that ICT patterns only don't think that you have to do these patterns to be able to be successful because there's other ways to use the information I've provided you and your setups may be slightly different than what I'm showing you here but these are the Hallmarks to how I
internalize and analyze the markets and when I'm right I attribute to these patterns so I'll share a few with you in the coming slides to illustrate the simple Yet effective approach and how it can be only searching for one setup for speculation in your demo account practice these are by no means the only possible patterns for use in the mentorship I include my personal favorites and a few others to stimulate your interest and inspiration all right the first one is an ICT bullish pattern number one okay and the condition is the higher Time frame has
to be bullish and the stage or the setup is price is going to bounce off of a higher time frame discount array an Impulse swing creates a fair value Gap near the swing low a short-term low forms in Market structure and fails to Rally higher after equal highs or a higher high is formed price will eventually drop down into the fair value Gap and under the short-term Low forming after the impulse price swing forms cell stops are triggered smart money uses offset accumulation to pair long entries with the sell stop rate for a discount entry
everything is explained here in this picture you've seen this happen many many times in the mentorship of outlined this and we saw many times where either I participated and it didn't work out or I participated and it worked out or I Outlined it I didn't do a demo trade and it actually panned out so you've seen all aspects of it where it didn't work where it did work and when I called it and didn't participate and it worked out in terms of price action this to me this is my fair value play or optimal trade
entry this is the actual optimal train entry in great detail that wasn't explained when I was on the forums back in 2010 so when I came out On the scene everybody was simply looking for 62 to 79 traceant levels to get into ICT optimal trade entries pulling a fib from the low up to the impulse swing after it tries to make an attempt to Rally higher then when it drops down the optimal trade entry either 62 70.5 or 79 retracement levels that overlapping with a fair value Gap a short-term low where the sell stops will
be residing and back into a bullish order block you have four things going For you four you have four confluences if you have that with higher time frame bullishness you have a lead pipe cinch doozy if it's going to go up it's going to go up really strong on this because you have four things going for you it's not a guarantee it's not guaranteed to go up but I have learned in my own analysis my study that this is the criteria that works more than any other there's many times where it'll rally up And then
retrace and there is no short-term low in between if there isn't it's not as high probability but when I see this this is the one I want to be trading when I'm doing fair value buys or in this case optimal trade entry this is a internal range liquidity range expansion trade so in other words it creates a range from the low at the order block up to the impulse swing and starts to retrace while it's retracing inside that range that's internal range Liquidity going long inside that range with the expectation that it's going to expand
outside of it and I'm going to be targeting external range liquidity okay the second one is the ICT bullish pattern number two and I don't have any names for these except for just simply a fair value and now this is a turtle suit or external range liquidity again the condition on the hard time frame is going to be bullish and the stage or setup is this price will bounce Prior to a predetermined or anticipated higher time frame discount array price drops lower into the anticipated higher time frame discounted rate at a later time and raids
sell stops in the form of a liquidity pool sell stops are triggered smart money uses offset accumulation to pair long entries with cell stop raid discount entry ICT version of turtle soup now when you look at uh Street smarts book where I got the inspiration for This pattern it doesn't matter out like this it just gives you here's a low it goes down below the low buy it there and that's a little myopic in my opinion there's got to be some other understandings and this is how I look at it if I internalize the likelihood
of the price coming down to eight well let's call it a support level okay but it's going to be a discount array whatever that discount array is that I'm really wanting to buy at if the price Stops just short of it or above it and it just hangs around and hovers or it starts to move up a little bit it gives the false bottom a fake low I won't buy that I'm gonna wait and see if they're gonna run down and kill those early Bulls because the when the creates that short-term low ahead of the
level I want to be buying at everyone that bought it is going to have their stop loss in the formula sell stock right below that short-term low And I know that if it's going to down if it's going to go down to that lower time frame discount array not lower time frame but lower in terms of terms of price you know it's going lower than it has already it reaches into a Deeper Discount I should say it that way I'm gonna wait for it and this is where patience pays because you're impatient because you don't
know what you're looking for I'm patient many times in Price trading because I know what I'm looking for now I may be impatient with people's uh inpatients and wanting to learn this but I am absolutely very patient when it comes to looking for what I'm uh trading off of in price I know what I'm specifically looking for which is why I don't get emotional in in my analysis I don't get emotional in my trading because I'm looking for specific things and if I don't get it I won't act in This case I want to see
a low form ahead of a anticipated level in terms of a discount so say there's a fair value Gap that I expect to see fill and price comes down but it doesn't quite get there and starts to Rally a little bit I'm going to wait and see if they use that as a sucker play and then run one more time lower when they do I know those cell stops are going to be triggered that's sell side Liquidity hitting the marketplace in the form of sellers at the market smart money will accumulate that and offset accumulate
those stops I buy down there at the discounted rate because now I have a better feeling that price should rally because it's taking out stops it went to my logical discount array and this is turtle soup this is when turtle soup Works if you could go back and watch any work that Linda does uh Linda rashke what she Teaches this pattern in her book with Larry Connors if you can get any um work off of YouTube on her I used to be able to watch some videos where she talked about it she didn't she didn't
build any more detail outside of what was shared in the book but when you look at that and you apply what I just explained here it takes the pattern to a whole different level and the bullish pattern number three Which is just basically the same pattern I just showing you but in the event that I did not get that entry down there on the Turtle suit which is the reason why I tell you don't worry about it don't regret it don't sit there and beat yourself about it if you can't get that level down there
fine this is the pattern that I use I wait for price to Rally through the short term high and now that short-term High becomes a bullish breaker When price trades back down to the breaker I'm going to use that as my entry because I know that that stop run at the lower low price should not come back down there so there won't most usually isn't going to be a retracement down into a order block where the buy level is so there may be a down closed candle down there obviously in many instances many folks will
look for price to trade back down there and get to that order block that's going to Be below the breaker it's already been down there and it's done its work so price is going to support around that bullish breaker so I'm going to look at that level as my entry point now in that impulse leg from where it says buy level up to the high and it pulls back down into the missed entry or pyramiding that impulse leg right inside that upper portion of it as it trades from the bullish breaker There's going to be
a portion of price action in a lower time frame so this is a say this is a four hour chart or an hourly chart in this portion of the range here that's going to be a lower internal range liquidity or optimal trade entry you won't see it like this but on a lower time frame it'll be an optimal trade entry and it'll trade into a lower time frame bull shorter block or a lower time frame discount array like a fair Value Gap and then price will expand but you overlap with that bullish breaker seen here
now this is a pattern that is universal every pattern I'm showing you is universal it can be seen only monthly a weekly a daily a four hour one hour 30 minute 15 minute two minute chart one minute chart it's Universal this is what I trade off of so if I see this pattern on a higher time frame then I start reducing it down and looking for the fractal of it Just in a small time frame so then I look for that either as a new position entry because I missed the first one or if I
went long down on that lower run on Cell stops or turtle soup entry if I got that one on if I want to add to that position in pyramid say I bought two down in the low end say I want to add another I can do it now when it trades to that bullish breaker so I can now pyramid there or say I'm Hefty And I've got a pretty good size on say I got 20 contracts or 20 Lots on at the low end on the turtle soup long I can add 10 now at that
higher buy level off the bullish breaker and feel confident that it's not going to go down into that internal range liquidity because it's already done its work running the stops so it's not going to be an optimal trade entry from the buy level the lower level of the discount array it's not going to retrace down Into some discount rate there because it's already ran the stops and it's going to want to move quickly away from that area and start pricing for premium now I've covered essentially just two patterns it's the external range liquidity or turtle
soup or internal Rings liquidity which is optimal trade entry I've shown you how if I got it wrong on the turtle soup and I miss it I can now use the bullish breaker to get in sync With it so I have a contingency plan for both patterns it's either going to be an internal range liquidity optimal trade entry Fair Value Place what that is or it's going to be external range liquidity run or basically it's Turtle suit if I missed a turtle soup then I'm going to wait for it to go to a bullish breaker
that's it it's the same two patterns but just being applied in a very specific Detailed way of doing it if I don't see price doing these three things I don't do anything I don't do anything if I can't see it in price then I don't touch it period if it doesn't look this clear to me in price I do not trade now what does that mean for you the same whatever your pattern is if you don't see it in price you don't trade because it won't give you the context to operate in you got to
know where your Risk is you know you have to know where a price is going and all this is is the setup this is not targeting targeting is what we just covered in the beginning of this uh presentation where we went down into from four hour into average daily range projections all those things get you to your Target because I cannot give you a recipe that gives you every scenario this is in this answers everything it's going to be advert daily range plus three standard deviations of Central Bank dealers range and five of Asian range
and 14 of flout that's what you're wanting I know that's what you want and that's what I wanted but I've soon learned early on in my career that there's no recipe for that you have to blend these things and keep working that's why it's hard because it's not just simply Plug and Play everybody thinks they're gonna be able to plug in my Concepts and automate them they're not going to there's too many Variables you have to think you have to be able to think about what you're looking for and how they overlap you're never going
to be able to automate all my things it won't happen and that's why I don't think that anyone ever taught has been able to do it either and I've talked to some really really educated people I've talked to quants I've talked to you know algorithmic guys and believe me they have tried to do very much what you're Probably thinking right now I'm going to go through this mentorship and I'm going to create a an automatic Trader you know you're going to get some kind of EA developed from it no you might be able to get
a concept here and there automated but you're never going to automate the whole process it won't work like that now because I have these three specific criterias I'm looking for but it's just only two patterns I have A buy program a cell program and I have if I get it wrong program what I'm looking for think about that I have a concept that gets me long gets me short and I have a concept that if I miss an opportunity on one pattern it gives me a contingency plan now these are the buy side and I
kind of spoke ahead of myself there because we haven't really gone through the sell side stuff so let's go to the next one And I can build on that same comment I just made the case of ICT bearish pattern number one and the condition is obviously higher time frame is bearish and the stage or pattern is this price bounces off of a higher time frame premium array an Impulse swing creates a fair value Gap near the swing High a short-term High forms in the market structure and fails to drop lower after Equal lows or a
lower low is formed price rallies up into the fair value Gap and above a short-term High forming after the impulse swing forms buy stocks are triggered smart money uses offset distribution to pair short entries with buy stop rate premium entry all right so again this is another fair value trade or optimal trade entry if you see a bullish order block and a fair value Gap as price trades Away there's going to be ideally a short-term high in the time frame you're looking for in this pattern price will try to go lower or fail to go
lower and then rally back above that short-term High closing in the fair value Gap trading back up to the bullish order block and that cell cell level is where optimal trade entry would be after the buy stops are ran out on a Previous short-term High if you use the high the order block or whatever the highest high is at that swing High down to the lower swing that failed to go much lower before it come back and hit the fair value Gap that's your impulse swing and the retracement back up to the sell side level
or entry is the bare shorter block so the pattern Just In Reverse of what we saw the ICT bullish pattern number one is I'm selling short At a bearish order block I'm looking at a bearish order block which is a bullish up close candle near a high price gaps down only sell side delivery and price a fair value Gap then it creates a short term High just underneath the fair value Gap which defines the the support of the fair value Gap and then price tries to make attempt to go lower or Fails to go lower
it doesn't make a difference to me but rallies back up above that short-term High once it closes the fair value Gap and hits the bearish order block that's your cell after this buy stops are triggered by liquidity is going to hit the market smart money is going to sell into that pair up their orders and the market expands going down to the lower end so you would be seeking some discount as A objective this is my favorite bearish pattern and this is bearish pattern number two and again the condition is higher time frame bearish the
stages or setup is price is going to bounce prior to a higher time frame premium array in other words you're expecting the price to come up a little bit higher but it just falls short of it now everyone else is going to get frustrated and chase price when it Starts to drop not you not me not anybody in this mentorship we're going to wait for price to Rally higher into the anticipated higher time frame premium array and raids the buy stock liquidity pool buy stocks are going to be triggered smart money uses offset distribution to
pair short entries with buy stop raid it's a premium entry ICT classic turtle soup entry now again this is just the opposite of What I showed as pattern number two when it's bullish it's just basically a turtle soup cell but all of the things that I'm looking for that make it a turtle suit see everyone used to ask how do you know it's gonna stop when it goes above the old high because you have to know the PD array Matrix for that time frame you're looking at where are the PD arrays what's the higher time
frame obviously we're in a Bearish market environments when we're looking for this so I'll give you a scenario let's assume for a moment this is London it's been going lower it's now Wednesday we have a high then we started to drop down and it started rallying back up okay we run through that high at London open there's your turtle soup entry it runs out by stops price didn't trade up to a premium rate enough of a deep Enough retracement for you that you really want the key off of maybe it's on a four hour chart
that you see this on and you can anticipate that expansion down the whole four hour unfolding based on what you see here but it's going to occur during London or it could happen in New York say London is consolidation and there's a news event that comes out in the 8 30 uh New York open price runs up on that news hits that Premium rate and then you can sell short there and then get in sync with a nice day trade or many times New York if it's reversing it can be a little bit longer term
of a move okay ICT bearish pattern number three it's on the same idea that we're looking for the turtle soup but we're going to say for uh argument's sake that we were not or I was not able to get positioned on that run above the buy stops so that run above that short-term High tripping Out buy stops reaching the premium array that price was like and we were anticipating price to trade up to but didn't do it on its first attempt then it finally trades up to it that's where I want to sell but let's
Place devil's advocate for a moment and say I couldn't get it on and price trades down through the breaker once the breaker is traded back up to I can look to sell short there because my confidence level is very strong because The breaker has done its job it ran the buy stops and price will not want to give them opportunity to go back up to that level and don't think at this moment there's going to be an optimal trade entry near where it says the cell level the higher premium array that high down to the
low prior to the secondary cell level that won't be a range that needs to be retraced back to a lot of folks get that's you know screwed up thinking that they're going To have that Range close in and get a retracement they won't go that deep usually it's the breaker that stops IT that's why I want to sell there now if I was fortunate enough to get short at the higher premium array I can look at that bearish breaker as an opportunity to Pyramid so if I went short 10 at the higher premium array now
I can sell short five at the bearish breaker in pyramid my position so now I've covered again All three of the Bush and all three of the bearish patterns but again it's primarily just two patterns internal range liquidity optimal trade entry trading back to Fair values all that is or external range liquidity turtle soup running out stops and fading that move you can see now without understanding The pdra Matrix and understanding how we work from a higher time frame down to a lower time frame with those same ideas And using institutional order flow and Market
structure you will never be consistent with my Concepts that's why folks that have gone through the tutorials they get frustrated because it's lacking clear definitive rule-based ideas and I did that intentionally all those tutorials are out there to see if I can get someone else to duplicate what I was able to do nobody has done it even in the mentorship they have not done it So looking at what we've covered we've gone through a whole spectrum of different things that is a very fresh view on technical analysis a lot of things look similar to everyone
outside the group looks like supplying the man in Maine looks like Wyckoff to me looks like Elliot waved to me not just kidding nothing looks like Ellie leaving here but there's similarities because obviously we're looking at one thing or another it's support or resistance the Problem is where is support if it's so easy we can draw a line underneath a low okay that's that should be all there is but it's not that easy is it what support level are you going to buy at because if you look at all these different time frames which one's
going to matter well use a higher time frame sure even then you got problems you have to deal with falling short of the level or going beyond the level how much of it are you Going to allow and what you do with that information so when we look at Price we refine it from an Institutional standpoint knowing that our demo account or our Live account is going to have slightly skewed pricing so from an intraday standpoint we could look at a a range of maybe 10 to 15 Pips off of interbank pricing and that's why
that's a little bit more risk in in terms of day trading because You're already building in this range or spread that you don't even know about unless you understand that the interbank level pricing isn't what we get quoted through our broker they add another premium on top of that okay so there's a spread on top of the spread so that makes it difficult and they can work that spread in their favor it can open it up to take your stop when you get near a low or an old high because That's where your stop is
like everybody else is and they won't let that spread help you when it's beneficial for you and you know what I mean by that if you've been trading with live funds so it's amazing how you don't see that problem when you're doing demo but as soon as you get a live account you'll see the spread effect then so here we have that situation this reversed with the bullish pattern number three We want to be using that bearish breaker as either a pyramiding entry or a secondary entry or this is our best opportunity to trade in
this current market structure and don't expect that that premium array cell level and the low prior to that retrace back to the breaker that range down don't anticipate that being closed in or retreated back to for Optimum trade entry because to do so you're completely avoiding and ignoring the bearish breaker that's Staring you right in your face so when I go through charts the first thing I'm looking for in all my time frames is where are the breakers because once I understand that that gives me Immediate context of work within now I can still screw
it up and you see me do it a couple times using the breaker in live session but when I'm wrong it gives me immediate feedback and then I can get in sync with the marketplace again so losing just Gives you a premium Insight don't try to fight that you can't you cannot win that battle you're going to lose you're going to lose in demo you're going to lose some live funds don't fight that take the information it gives you as a premium in terms of insight now we're going to go over to the gold market
and I'm going to recap something that saves me the trouble of going into the case studies and also gives me an application of what you've been taught In the mentorship I told you this move was going to take place I told you what to expect and during the live session you guys that were there live when I prompted you you all pretty much about 80 of you had immediately targeted where the setup was going to be at soon as I prompted you so that to me is encouraging as a teacher as your Mentor you're able
to take the information I'm giving you it's been translated in a manner where you can understand it and Then you can see it without me pointing to it since once I'd actually pointed to it everybody said oh yeah yeah that's that's where it was and 80 already knew at least by response in the live sessions uh commentary when you guys can send me a question most of you about 80 we're all saying the same thing as a good a gold market you'll see what I mean so let's go over there into the charts and we'll
close this session out Okay folks we have the gold market this is a four hour chart and this past week when we did live sessions I gave you a very clear easy condition stage execution format for using the information I've taught you this entire 12 months and I was asked to do gold and we went through the monthly and we went through the daily and I'll let you watch the recordings this week it was actually done on August 23rd so if you can watch That recording it's usually um found around the one hour and 30
minute Mark of part two if I'm not mistaken part two one hour and 30 minutes uh you'll hear me go over the breakdown on gold so we're going to look at the gold market here and at the time of the recording we were looking for the outline of it being bullish So I'm going to frame here's the beginning of the 23rd and we were outlining the fact that the market has to trade lower for us to pick up a discount array and we had a low here and we had a low here so we're going
to outline this here we have a low here and we have to see price trade down to a discount we can't trade it going long while it's Going up on our four hour if our time frame is looking for a discount so we have to wait for the trade lower so we're going to go down to an hourly chart and use this reference point right here go down to an hourly okay and so now on an hourly chart we have this low and now we have this Gap right here only the buy side was offered
here no sell Side delivery was offered here so we're going to put our horizontal line here okay so we have only an area or range where buy side was offered so between one uh 1280 and 12 78 okay two handles only buy site offered prior to this Gap what's the next downside discount array it's this High here so if price was given up all this range went lower the First one it comes to is going to be this swing High or this swing High we're going to use this swing high it's the higher it's a
swing High because it has a lower high to the left and lower high to the right and the next one below that would be here so it would be discount now right here then though discounted right here then the order Block in here all moving away and below that fair value Gap so we're using PD array Matrix here and now we're going to use this our stop would have to be below this level so we're going to make this red and we're going to thicken it up a little bit but not with that wing we'll
put it right here so we identify a discount array we're trying to buy at and we protect it with a stop below the Next discount array which is here so our stop needs to be below 12 76. and this whole candle it's low it's a little bit below that so in this instance we have to go below it so the candle we create the premium one it's all one candle we don't want to see it Spike down through that so the next discount array would be this one here so its high is 12.75 so I
would refine my stop level to this It's got to be 12.75 and below so we could be a buyer down here if it comes down and fills the Gap and our protective stop has to be below 12.75 so we'll use 1274 game protector start entry is in here it would be a run on cell stops and trading on external range liquidity for this low but internal range liquidity for this low to this high So we have to be a buyer at discount and we're going to look to pair that up with a premium array so
we have to see it trade down below this low there will be an external range liquidity run and we could couple that with an internal range liquidity run here so we have a low up to high and you see me do this in the live session and that gives us optimal straight entry right down here 's the 70.5 level 79 tracement level and our Stock's going to be have to be below that but the fair value Gap is here so we have this area 62. down to seven ninth right here and The Sweet Spot of
that is here so we're going to say this is the actual entry with the overlap of 70.5 because it could spread just past the the gap or we can do 78 and that closes the gap and we may allow the spreading to the 70.5 level or Sweet Spot optimal trade entry so we're looking to go long at uh 12.78 and stop is 12.74. and we'll be looking for any premium array but we have to look at it after the market starts to trade down so here's our low we wanted to see it go down into
the fair value Gap but it didn't do that so what did it do it Stopped short now we're rallying up are we buying it here no we're not price goes up closer than a fair value Gap here right in here and let's see if it starts to sell off trades down and then sells off trades back up into short-term High the whole time we have the plan of buying down here 's the fair value Gap so we're going to take this and just scoot this on over here a little bit and there you go take
that and the stop level here okay and price hits 12.90 in here bare shorter block runs a short term High right in here it spikes up first runs the highs runs these highs Trades down into the gap so we go long at 12.78 protect us stop 1274 never hit pick up a discount array buying sell stops below these lows and here price rallies up immediately back up and this is where we're sitting at now so now looking at price if we miss this opportunity like some of you most likely did We can now use the
breaker to get long now the question is is where is the breaker we have this high prior to this low we have this in here but it's not as defined and it's this one here is lower than this one and we've traded above this high so now what I would err on is I would say these candles here are going to be the breaker So as long as we're buying inside this range extended in time this could be a good area to be a buyer for gold so we could see it pick up and rally
again using what I've taught you in this example here we talked about this in advance so my last question it literally took me minutes to explain and show it to you and outline it and all the things we went through for these four teachings seems like a lot And it seems like it would take you forever to go through it doesn't you watch me go through the charts and then within minutes I've already got a I've already got an idea what I want to do where I think price is going to go how it should
react and it's this is one more example I gave it to you in the end this week I give it to you the Euro we missed uh two runs on but eventually Euro gave it to us and on Friday so The long and short it is you have all the components to make your own trading plan with what's been taught to you I've given you mine I've showed you mine and I've held back nothing I promise you there's no secret nothing I've given you everything I know as it relates to how I look at Forex
how I work in this demo account show you where it's going to go beforehand and you see when it fails now when it's right it's really really accurate when it's wrong it's wrong it's Nothing I can say about it it is what it is I told you up front I can't be perfect you're never going to be perfect so give yourself permission to be so you don't want to have all that weight on your shoulders thinking that you have to know everything you don't you need to be right once in a while and be more
right than you are wrong if you are able to do that your career is brilliant ahead of you and I can't wait to hear all your stories and what You do is success now this does not by any means complete art mentorship content because there's a lot of subtle little nuances I'm going to talk about the final week of our live sessions and recordings I got a handful of topical studies I want to throw at you too and I'm going to give you the the stock one on the last trading day because I want to
go through how I go through the IBD to pick out the stocks I like and then I'll end it with the Greeks on options because it goes together in one teaching and I'll give you a short synopsis on the top down for bonds and short synopsis top down on s p and the Commodities there will be a respective topical studies each day next week and they'll be short and sweet so um I've had so much fun teaching this stuff to you guys it's been a lot of work it's been very very draining in terms of
the energy that's needed to do It I had to deal with some people in the beginning that are no longer with us thankfully but I'm confident I'm 100 confident that if you put the work into what I've shown you how I outlined it where to look for the information when to look for the information and what its use is I promise everything that you've ever aspired to do as a Trader and how you want to operate in technicals and price You have it now there's no speed bumps okay that turn into brick walls it's brick
walls have been reduced to speed bumps now there's no mountain in front of you you have everything to your advantage that I didn't have shown you everything that has worked for me when I can do analysis and I can pick the market moves all those things that lend well to me doing that you've been taught There's no secret teaching in 2018 or in the future there's no book being written by me that didn't get include anything it is as I promised everything that I know and that I do in technicals I've taught you all the
other asset classes and everything I know about them I wish there was more I wish I could keep digging deeper and finding you know new ways to uh you know expound on all this stuff but you have reached the end and you have basically got to everything That makes ICT ICT except for the topical studies and a few little things I want to talk about as we close this month out you all have it now so it's been my pleasure to be your Mentor I'm so thankful for the ones that have held out and really
put in the work and time that's necessary but you still have a lot of time and a lot of work ahead of you you have your own model to build based on all this information and it's Limitless it absolutely is Limitless and I cannot wait to hear back from each one of you telling me what you did with it how you formed your plan and how you're trading with it so until the future I wish you good luck and good Trading