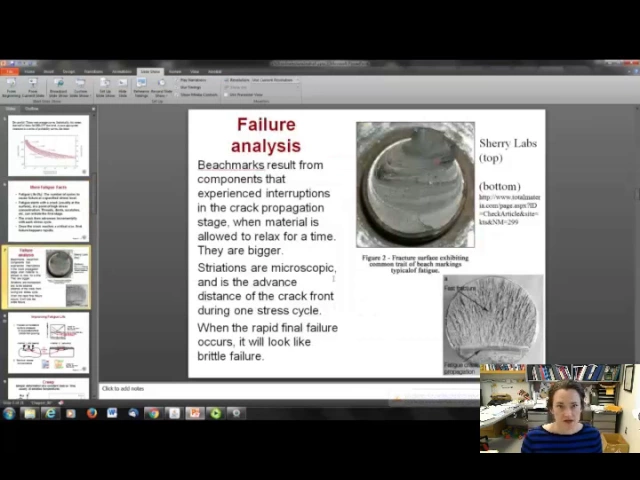
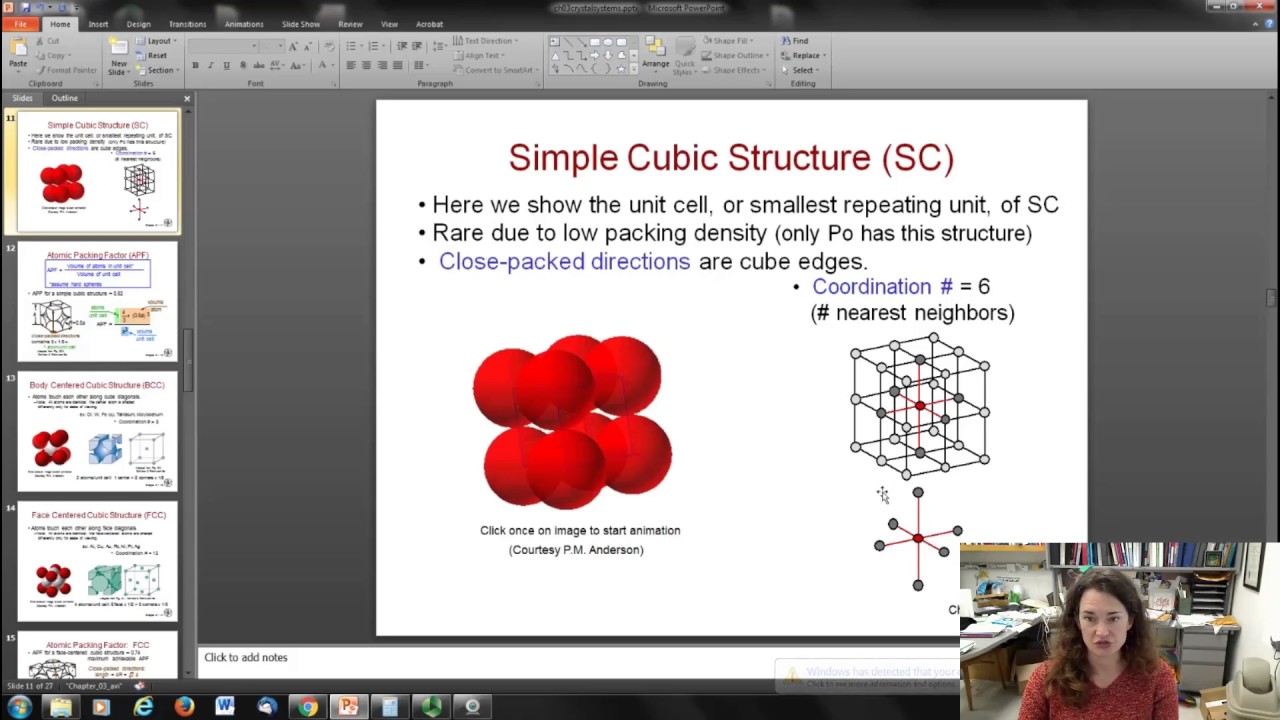
hi so we're going to talk about fatigue and creep and failure due to these mechanisms today so first to Define fatigue fatigue is defined as a form of failure that occurs in structures that are sub subjected to a dynamic and fluctuating stress so you might imagine um a bridge with cars driving repeatedly over it so the number of cars on the bridge at any given time might vary it might be bouncy a little bit if it's a flexible Bridge so you can imagine something like that the thing about fatigue is that Parts can fail even though the maximum stress that the part might be subjected to is much less than the yield stress that you might measure in a tensil testing machine um it's actually responsible for about 90% of uh life failures mechanical engineering failures of parts and the bad part is that it can occur suddenly and with and without warning just like a a brittle fracture um in fact the fracture is brittle in nature if you examine it using fractography you can see that the surface looks like a brittle fracture surface for for part of the surface at least um so here in this picture there was an interesting failure study done by Sherry Labs the link is given below if you'd like to read the full study but the gist of it is these studs are bolts were used to hold on the Wheel to a big mining truck and of course the wheel just fell straight off um one day after the parts had been in service for a long time they wanted to know what went on it turns out that the the bolts that they were using were okay for the service that they were being put to but they were in installed incorrectly and that's why they failed um but they failed after a certain amount of use um and just all of a sudden without warning so they were interested in doing the failure study you can see here if you look at the bolts and remember what it looked like when we did those tensile tests um these do look a lot like brittle fracture so you see these abrupt kind of um Parts where you you have little to no necking and when we zoom in and look at the parts later we'll see what the fracture surface actually looks like um but a lot of it will look like a brittle brittle surface now you can simulate fatigue of course if you know that your part is going to be subjected to fatigue you would like to test the part and see how it's going to perform in service and so they've designed many machines um uh fatigue testing apparatuses that um Can can do this for you so a schematic of it is shown here basically you have something that flexes the part back and forth and rotates the part through so that it gets flexed in multiple directions um and then it can do that for as many cycles as you like um basically what they do is they subject it to this sort of beautiful sinusoidal stress now in reality in service the stress might not be that beautiful in sinos soidal it might be much more erratic um but machines do the best they can to simulate that stress and what they do is they set this stress parameter here you can change the mean or average stress and you can change the stress amplitude you can change the frequency of the um oscillations of the stress and then you just run it to failure you wait until the part breaks and you do that for multiple scenarios on the same type of material so that you can get a feel for how that part will perform under a cyclic applied stress of course you want to replicate the actual conditions of service as closely as possible here's some images of Some Testing apparatus that I found online um basically the tester will subject a specimen to a stress amplitude that's on the order of 2third of the tensile strength and then what you do is plot the number of Cycles to failure versus the stress so here's a a couple images of those plots so here um what's plotted in this case is the stress amplitude you could change it you could change it to the mean stress you could plot whatever parameter you're interested in regarding the stress on the y axis and then on the x- axis you plot n which is the number of Cycles to failure okay and so this is a logarithmic plot with Cycles to failure here um there's basically two types of fatigue behavior that are seen commonly one type of fatigue behavior is seen for many different Steels that's the one up here at top with this curve and then on the bottom curve you see that for a lot of non feris Alloys um and we'll talk about those two scenarios so for these two different scenarios here well for both of them actually higher stress is actually going to give a lower number of Cycles to failure that's why the curve goes up as it approaches and equals uh low numbers okay it goes up there it with your stress amplitude Okay so the part will fail at a lower number of Cycles if you subject it to a higher stress not really surprising there okay so um next what you see with some Steels with many Steels is that for for these Steels as long as you keep the stress below what's termed a safe level the part won't fail on you okay um so you have to keep it at a low stress and then what you are is you're in this safe region here if because the Curve will flatten out um as it approaches high high numbers of Cycles so as long as you keep it below that stress amplitude then the part will perform um well okay that's a Steel type Behavior but for some materials um there is no fatigue limit when you approach that limit that flat out uh that flattening part of the curve there that's called the fatigue limit but for some materials non- feris Alloys there is no fatigue um limit in those cases they often specify a fatigue strength instead and the fatigue stress uh strength is the stress level for failure at a specified number of Cycles so you say well I would like my part to perform for X number of years before I recommend replacement so what's my fatigue strength at that and then you design your part um so that it will have the specified fatigue strength that you want for the number of Cycles to failure that you want okay okay now you have to be really careful because those curves that I showed were actually average curves and statistically what that means is that half of them are going to fail below that level if you if that's your mean curve then half of them are going to fail below that a more appropriate treatment might be a series of probability curves um and so if you go on and you become a materials engineer material scientist I would hope that you would do this sort of thing okay and plot plot uh a a parameter and then stay in the safe limit even for the low probabilities of failure now um another important parameter that sometimes gets cited is the fatigue life and the fatigue life is the number of Cycles to cause failure at a specified stress level so you specify the stress level and then you see how long it is till the person has to change that part out basically um fatigue when it starts it happens in three stages it usually starts off with a crack or a scratch or something like that so you have a a defect in your surface it could be the threading on your bolt it could be dent in your surface a scratch a rusted spot whatever and then at that point at that defect a crack will form okay and this usually happens at the surface and then in the second stage that crack that's formed will advance incrementally with each stress cycle so every stress cycle the crack will move a little further and a little further and a little further when it's reached a certain point some critical size then the final failure will happen like that and that's why we say that you know fatigue failure happens without warning because if you don't know the crack is there all of a sudden the part will just fail one day and you've got yourself what looks like a brittle fracture failure now there's people that do these analyses like the um example that we showed earlier and then you can look at the fracture surface and see what's going on there's certain characteristic things that they see um in these fatigue parts so first of all this is an image of one of those bolts that failed on that we showed on that very first slide and it's exhibiting something called a beachmark it's also sometimes called growth rings or uh clam shells um but anyway it shows this kind of characteristic layering look kind of like a tree ring or a go growth ring um and what happens there is the crack is advancing but then um and it's being subjected to stress but then the part is taken out of service for some time maybe everybody goes home for the night or maybe maybe the part is on a bridge and um there's not too many cars in the bridge that late at night or whatever okay so it's allowed to relax a little bit and then it's subjected to the stress again allowed to relax a little bit subjective relax and this forms a uh very distinct looking pattern that people have learned to recognize as being a sign of fatigue failure um they're bigger they're visible to the naked eye or with just a simple little handheld lens now there's also if you look at the part under an electron microscope or a high power M microscope you can see what are known as striations inside these Beach marks and the striations are microscopic and it shows you the advance of the crack front during just one stress cycle and looks like little ripples all right now down here in the lower right hand corner is a um a part from a totally different website that I've cited here and what that looks like it'll show you the crack formed it initiated down here at the bottom and then you have your kind of beachmark looking pattern down here until the crack Advanced far enough the flaw Advanced far enough that boom you've got your brittle fracture failure and this is what that surface looks like okay so um so you can figure out a lot from that fractography now since most of these um defects the cracks start at the surface anything that you can do to strengthen the surface is a good thing okay so you can do what's called shot peening which introduces um uh defects at the surface um hardening strain hardening um you can caror it you can alloy it in other words alloing will strengthen apart and you can also remove those stress concentrators um if you have very small radi of curvature very sharp corners or anything like that on your part then your fatigue will want to set in there so anything that you can do to make the radius of curvature larger would be good um so that's also a good thing to think about okay so that's fatigue and fatigue life now let's talk about creep there's some parts that aren't necessarily subjected to cyclic loads with a stress that varies in time but there may be a loadbearing type thing they're supposed to hold a long tense ESS for a long time and it's not cyclic in nature just really heavy all the time for example those parts are subjected to creep okay oftentimes these parts um say for example if it's in a jet engine or something like that this also happens at elevated temperatures the part gets really hot in service so if you have kind of a constant load over time at an elevated temperature your part is subjected to creep okay so there's there's three stages of creep first of all when you first place the part in service um the very first day or whatever first few days this is called primary creep and in that you have first of all an instantaneous deformation the part will deform the instant that you put it in service by some amount it'll get all stretched out and then um the slope here this instantaneous deformation the slope will decrease with time until it reaches the steady state which is the secondary part they believe that this DEC decrease in the slope with time of the strain on the part which is called The Creep strain that decrease in the slope is due to strain hardening so the part the metal is actually getting tougher in service then it reaches a plateau where the strained hardening is actually battling with the recovery phase for the part because remember the part is being subjected to heat and then you have what looks pretty much like a flat straight slope there okay um and then that stage is called secondary creep the um the slope of that here we're plotting creep strain versus time of service okay so the slope of the secondary curve is really important because the part spends most of its life in that secondary um time frame it spends most of that time in the secondary stage the primary stage doesn't take very long and neither does the tertiary maybe just a few days for each of them the secondary strain um rate curve can can last for years so that slope right there is very important and we'll talk more about that and then finally it exits the secondary creep and enters the tertiary creep phase and then the slope actually increases with time until the part finally ruptures um so you want to stay away from that creep as you can imagine has a temperature dependence the hotter your part the more um the more your creep strain rate will be um the faster the creep will occur for Metals it becomes important mostly at G than 40% of the melting temperature then it really takes off okay so that's something to bear in mind okay so let's talk more about that secondary creep regime okay your steady state creep rate is actually constant at a given temperature and stress you're at that point where the strain hardening is balanced by recovery and you've got that constant looking slope okay so given a temperature okay your your exponential dependenc of your temperature is here so you have the activation energy for the creep and as long as that temperature is held constant this exponential term here is constant it's e to the minus Q over RT um and that's the activation energy for the creep there that q and then there's your temperature okay now um your strain rate is the strain which remember is the change in length over the length so that's the definition of strain and a strain rate is how much strain happens per per unit time okay so that's your strain rate Epsilon dot then you have a material constant in here of course it's going to be bit different depending on what your material is and then you have your applied stress um times raised to the power of n your stress exponent okay now if you do a log plot of these things then they look like straight lines okay um so your strain rate increases with increasing temperature and increasing stress don't worry too much about the units on K they're really strange okay um but it's basically just a fit parameter that you would you would get from the fit for a particular material that you would have okay so let me do an example problem for you so that you can see what some of these creep problems look like I actually have about three examples here to go through so this is um a steel alloy okay s590 alloy and it 750 mm long initially and it's exposed to a tensile stress of 80 megapascals at 815 de Celsius and so using this these plots what we're going to do is determine the elongation after 5,000 hours um assuming that the instantaneous and primary creep um elongation is 1. 5 millimeters so these curves here show the secondary creep um Behavior and the instantaneous and primary creep El a are given to you basically as 1. 5 mm so you just need to figure out the secondary part and add it onto the primary all right so what we can do is we know that the part was subjected to 80 megapascals at 815 C so I can look at um my plot here and read off for 80 megapascals um from the 815 C curve which is that red curve here and see what the um the the creep rate is at that value So reading that off the plot I get 4 * 10- 6 inverse hours again the units are a little strange on these things um just Just Go With It okay so here's my steady stra um steady state creep rate that's my Epsilon Dot and then what I can do is it asks me for 5,000 hours so I can multiply my creep rate by my time so I have 5,000 times 4 * 10- 6 and I get 0.
02 okay so that's my creep rate uh so that'll give me my creep If I multiply my creep rate by my time I get my creep and that's equal to remember the uh strain which is the change in length over the length which is the change in length over the initial length of 750 millimeters okay so that means I can solve for my elongation and it's 15 millimeters and that's for my secondary stage if I add that to the primary creep I get 16. 5 millimeters of elongation of that part hopefully that helps okay here's another question all right these are all taken from your book if the log of the creep rate is plotted versus the log of the stress um as it was previously a straight line should result with a slope of n okay so using the figure determine n for the s59 Alloy at 925 Dees C that's shown here in the orange curve okay so we're assuming that the temperature is held constant so that exponential term eus Q RT that's a constant value okay so for this this curve it's just shown here and it's some value and so we're assuming here that Epsilon dot is equal to K Sigma to the N okay so um what I'm going to do is I'm just going to choose two data points off this line and figure out my slope of that line and from that I can figure out what my value of n is so the two data points that I chose are the ones that kind of crossed over one of these grid Lanes two cross grid l lines here um and so the two data points that I chose were 10 Theus 4 and 60 megap pascals it looked like it intersected there and one inverse hour or one hour and 200 megapascals so I chose those two data points now if you look at what the log log plot would be if I take the log of both sides of this equation I get log of my creep rate equals log of K plus n log Sigma and then what's plotted here though is the stress on the y a axis okay so my slope then would not be n it would be one over N I rearranged my equation here to show that so I have 1 over n log of my creep rate equals minus one over n log of K this just becomes my intercept so it's unimportant to me for my slope calculation and then that's equal to the log of Sigma okay so if I want to solve for just my slope that'll give me my value of one over n here so I plug in for my two data points my change and my y y would be log of 200 minus log of 60 and then the change in the X would be the log of 1 minus the log of 10us 4 well if it's a log base 10 then the log of one is just one right and then I have minus minus 4 okay because the log of 10us 4 is minus 4 and then when I do that I get 0146 and that's equal to one over N I solve for n i get 9. 6 so it's basically 10 right okay so here um next question estimate the activation energy for creep for the s590 alloy using the stress data at 300 megap pascals and temperatures of 650c and 730c assume n is independent of temperature okay so in my example here I've got my equation for my creep rate Epsilon dot is equal to K Sig VN e minus Q over RT so that's my assumption there and yet again what I'm going to do is I'm going to use my two data points um and here my two data points are for the 300 megapascal data okay so I have two data points 300 megap pascals and if I look at that um my creep rates um for those 200 Mega 300 megap pascals if I look at that that intersection of the data then I get creep rates of 10us 4 inverse hours and - 2 inverse hours for 650 and 730 C which were the temperature cited now K andn are those constant those material constants that don't change because this is for the same material all these curves are for the same material the s590 alloy so those can be assumed to be the same and sigma is given as 300 megap pascals for both so from this I've got basically two equations and two unknowns right um I know my um my values my creep rate I know my values of my temperature I don't know my K Sigma to the n Bits but since I have two equations I can just subtract those two equations and then that constant drops out so I end up with the log a natural log of 10- 4us the natural log of 10- 2 = q r * 1 over 13 - 1 923 okay and I solve this equation and I get my Q there um plugging in for the known value of my gas constant are 8.