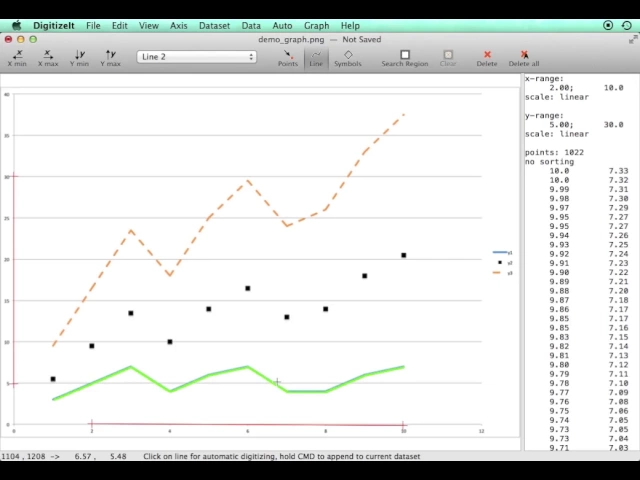
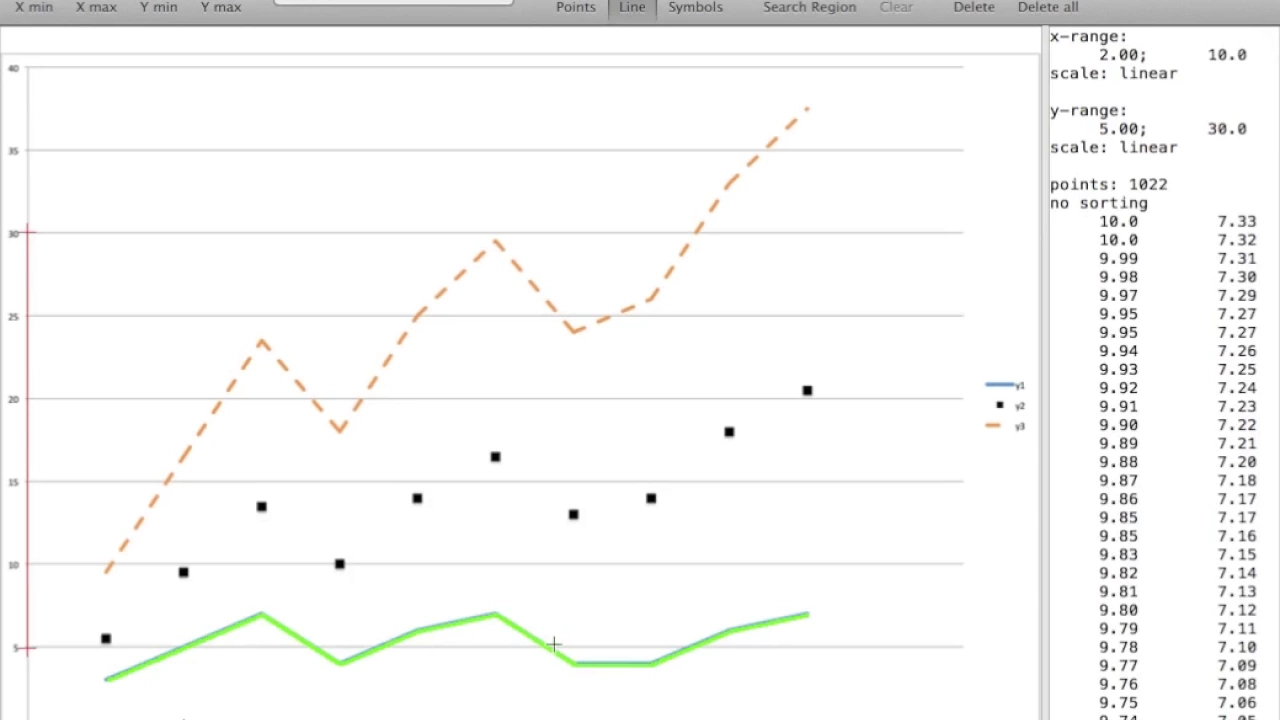
hello I want to give you a quick demo how to work with digitize it first I'm importing a graph can mean any of these image formats or you can simply capture a screenshot from anything that's currently displaying on the screen the first thing I need to do now is define an access system by clicking on two points on each axis now we're ready to go you digitizing tools a point-and-click tool an automatic line digitizer and an automatic symbol finder I will start digitizing the blue line using the line finder just click on any segment of
the blue line the rest of the lines found automatically as you can see on the right hand side it found roughly 1000 points I'm now using the line finder tool to digitize the dashed orange line in case of a dashed line it's possible that not all segments are found in the first attempt in this case you can simply click on one of the remaining segments while holding down command on Mac or ctrl on Windows and the rest of the points will be automatically appended to the first part of the line I can now use the
simple finder tool to check the remaining black data points by clicking up on one of the data points it's able to automatically recognize the other ones if they imagine shape and color in case you're only interested in part of a line you can use a search region tool drag a rectangle around part of the line you are interested in and then use the line finder and it will only detect the part of the line that is inside the search region that you defined now we have a couple of data sets line two was a blue
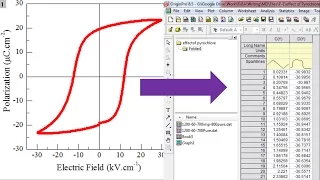
line line three is the orange line we have some symbols and line five is part of the orange line that is with inside the search region we can export the data by choosing Xbox to ASCII now let's have a look how the data looks like it's a CSV file that can be opened by Excel for example or a text editor or many other applications here's how it looks like X and y values separated by a comma thanks for watching