Curiosity is such an important part of any data collection and it plays such an important role into what you decide to look at. When I feel curious, I have this sense of openness, like all of my eyes and ears and all my senses are so open to learn more. It's a beautiful feeling.
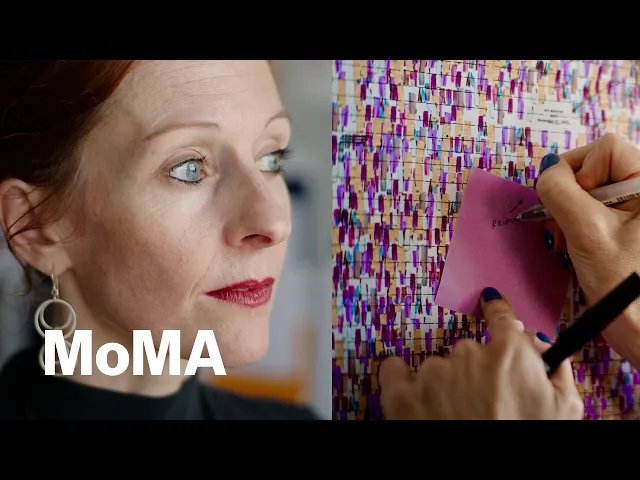
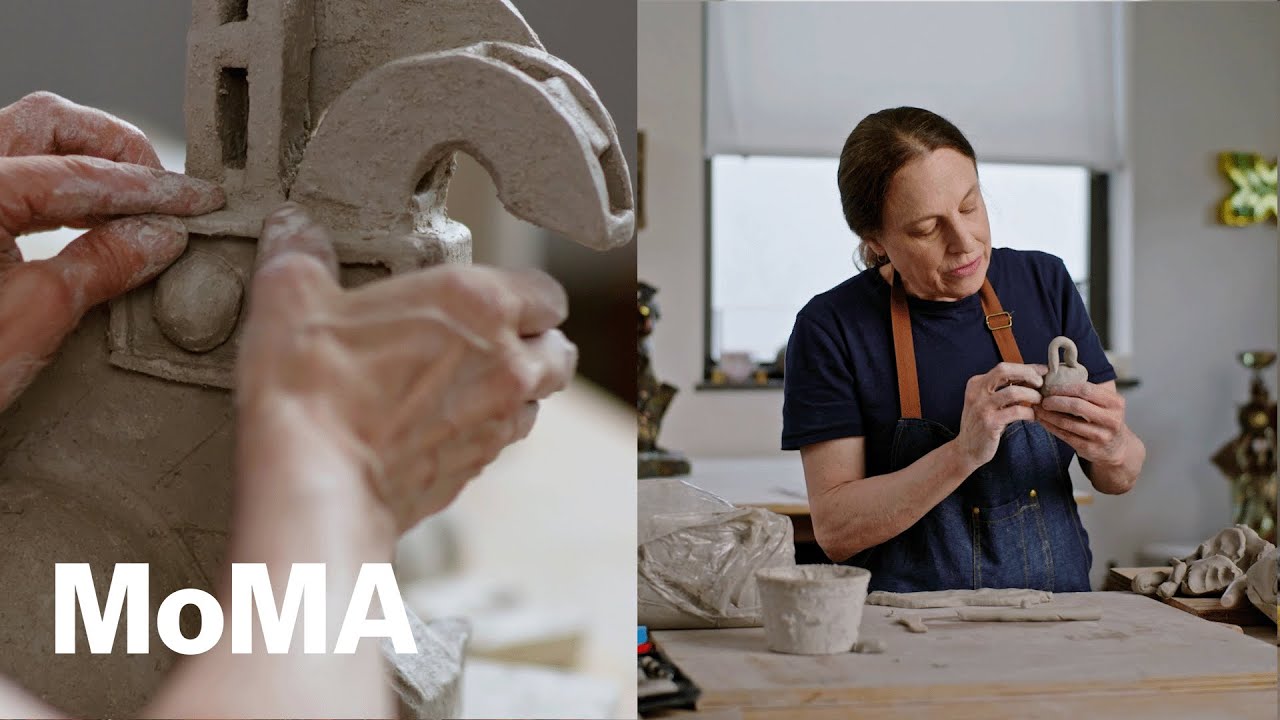
It's a feeling of flow. My name is Giorgia Lupi, I am a designer and partner at Pentagram, and I use data as my favorite material and tool to communicate. Data might feel intimidating for many people, but if we think about it, what is data?
Data is nothing more than an abstraction of our reality. A lens, a tool that we can use to filter our reality one subject at a time. Finding a visual vocabulary for data is really assigning shapes, colors, sizes, so it might seem this very creative process, which it is, but it's also a pretty analytical one.
"Dear Data" is a collaboration between myself and Stephanie Posavec, a data visualization designer who lives in London. Stephanie and I really didn't know each other. We shape the project around one main question, is it possible to get to know somebody else through data only?
Every week for 52 weeks, we collected personal data around shared mundane topics from our interaction with our partners, to our surroundings and belongings and personal data that we filled with context and details about what was happening, why, what was the feelings? Just. Counting our activities, our thoughts.
That's really what data is, and the more after counting, we embed some measurement that we all do, the length of something that is happening, whether it's a short moment, a big moment, or the quality of the actions that we've been making. This is where we start to add context and where data becomes really, really about our ourself and the possibilities are infinite for self-exploration, but also as a creative material to have less fear of the blank page. After "Dear Data," I think I've always kept collecting data about different things that I was curious about.
I don't do very well with an open journal and a pen just jotting down my thoughts, and so it did become my form of journaling. I got sick with COVID in March, 2020, and I got over the acute infection just fine, but then strange and debilitating symptoms start to pop up for me. I started this spreadsheet that I would fill with the symptoms that I was experiencing daily, the activities that I was doing to try and find correlations or potential triggers.
Keeping this spreadsheet over the course of these years helped me have a semblance of control. I had some insight from the data set itself, but primarily it was my way to feel sane in a moment of deep uncertainty. In December of 2023, I published a visual opinion piece in the New York Times about my journey with long COVID through data.
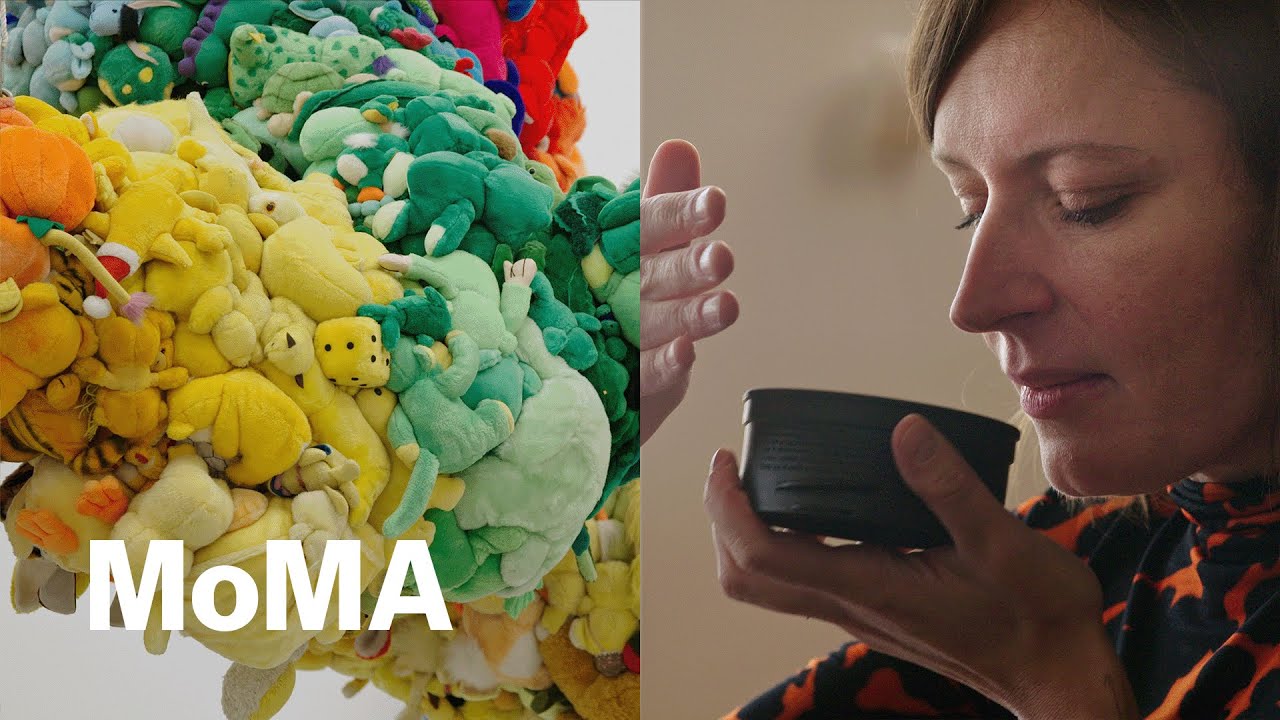
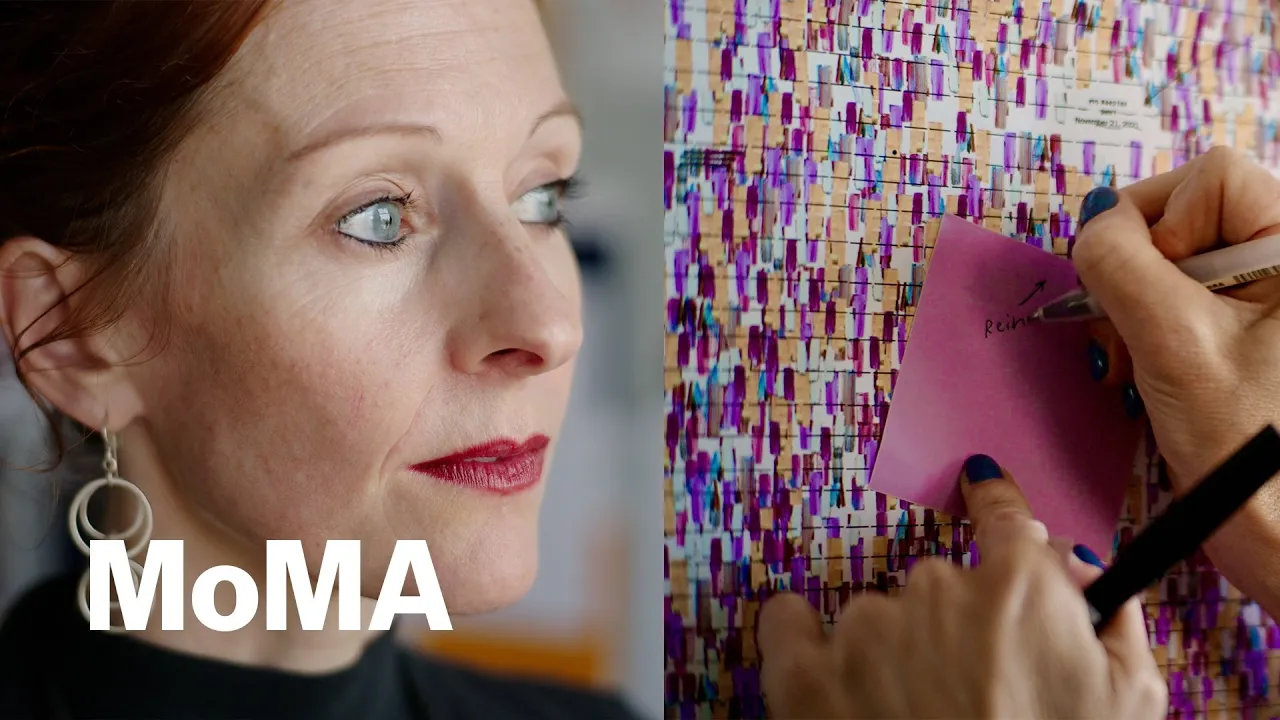
I use colored brush strokes to depict every single symptom that I felt in the past four years. In addition of different symbols to depict the different treatments, medications, and anything else that I collected, procedures, blood tests, and labs. It resulted into this full depiction of what it means to live with a chronic condition on a daily basis.
I had it pretty clear in my mind from the beginning that I wanted these four years of data collection to look like a painting. I views painting as a way to cope, as a way to express my frustration and anger in despair. At times, I chose pretty bright brush strokes in a way because in the end, I want the piece to share an element of hope.
I'm right now only collecting data on the little progresses that I make, the things that I was not able to do that I'm able to do right now. What you focus your attention on is actually what then fills your days with. I know that tracking my symptoms will also make me focus on them more.
I believe that right now is a space for me to feed the good feelings, not to ignore what's going on in my physical body, but to take it as something that is a feeling. It's a sensation. It's happening.
I have to acknowledge it, but I don't have to resist it or stress about it too much. I think I'm in a different mental space. Am I healed?
No, but I am trying to enjoy the life that I have and appreciate the things that I can still do, such as work or create or enjoy some moments of normality. I would invite everybody at least once and maybe even just for one week to try a little personal data collection. Think about a couple of things that you are curious about that usually you wouldn't stop and pay attention to.
To humanize data is ultimately to connect numbers to what they stand for, which are our imperfect and messy lives. Ultimately it's remembering that data is not about numbers, but it's about people, and this is the way that we can actually make data more human.