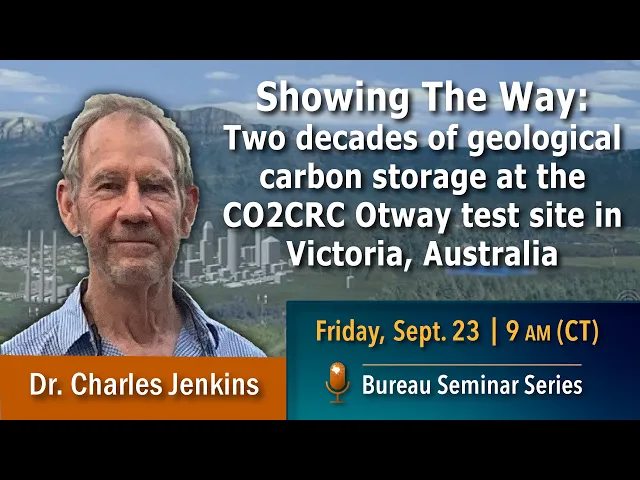
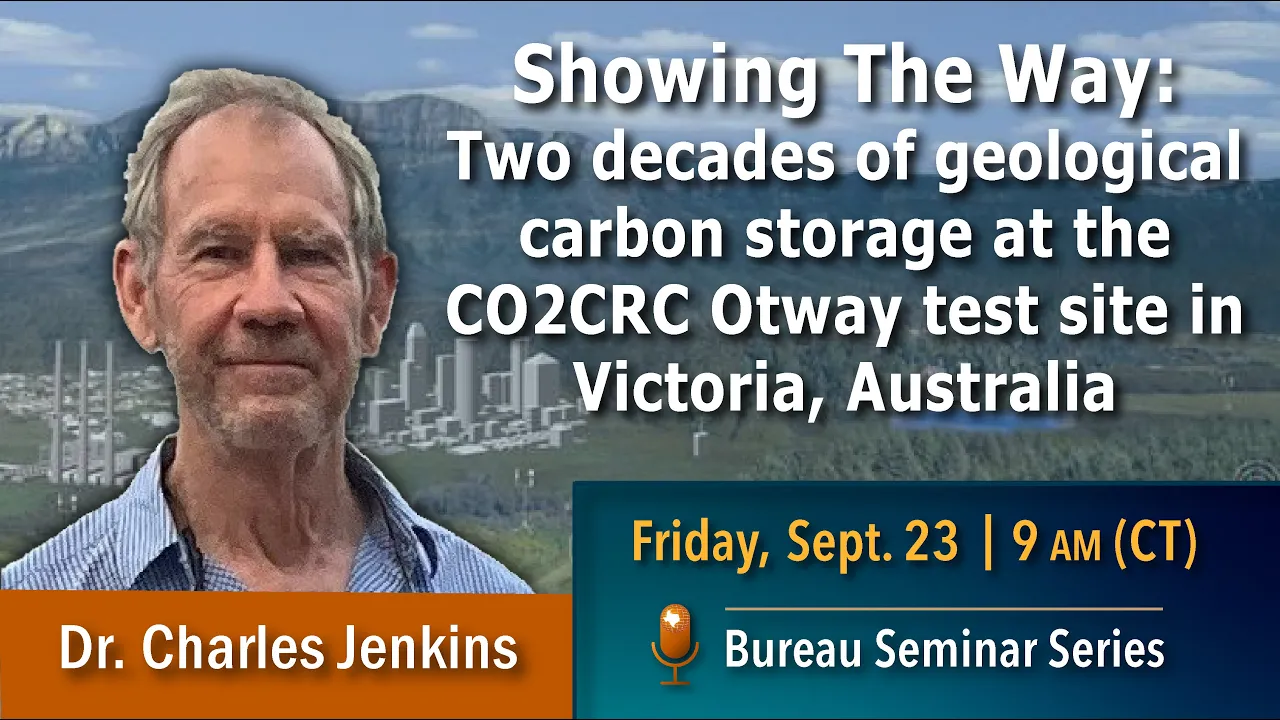
Common people on Zoom thanks for people coming in the room our speaker today is is um is some is uh Charles Jenkins from the csril which is uh Australian National Lab um and he's going to talk about a project that I adore I hope you like this project um the outway project in Australia is a CO2 storage experiment and you know it's really really fun for geologists and and Engineers to do an experiment like like we do in like chemists and businesses get to do where you really do something so and and outway outway experiment
you'll hear from Charles about the details maybe you'll get to see why I think it's such a uh you know really strategically important but also really really fun um uh experiment um so Charles has been here with us for uh most of the summer as a visiting a Scholar and and uh working in our here at the Bureau and he's heading back to Australia so we're really pleased to get him to come talk to you about this seminar series he's an applied physicist with a PhD from the University of Cambridge he's a fellow of the
UK Institute of physics and Associate editor for the international Journal of greenhouse gas I should greenhouse gas control which I shouldn't mention because he's probably Going to send something for peer review next but okay Charles we look forward to hearing stock thank you [Applause] thanks very much for that too it's been an absolute pleasure to be a visitor here at the Bureau for the last three months and I do thank sue for making it possible um it's it's been so stimulating Sue's group is an inspiration to all of us Around the world in the in
the world of CCS so it's been just it's been just great to be here um so my introductory slide here reminds me of um the few occasions in my life I've had to make a speech at a wedding and where you have to remember all the relatives this this list is by no means Complete because I'll be describing um things that have been taking place since about 2004 an awful lot of people Have been involved um in the in the states and internationally as well as as well as from Australia so thank you oh we're
not moving oh there we go Okay so a few a few background words so the the idea of having a test site for geological storage Um in Australia is if it's due to any one person which as I say is probably not really a fair statement but in this case the person you have to name is Peter Cook who some of you might know as as a director of the the British Geological Survey in the 1990s and it was Peter whose Maxim was that somebody had to come and kick the tires in Australia for over
CO2 storage site you had to be able to see it actually happening And when this site was being designed of course the Norwegians would be doing storage in the North Sea for maybe a decade perhaps less than that but less than that but it always makes a huge difference to do something like this in your own country it makes it makes such a such a difference to politicians at all levels it means when you're at a barbecue and you people ask you what you do for a Living and you describe it and they say well
you can't do that and you can say well we did and and what's more it's it's just down the road so where is it it's in the state of Victoria which is down in the bottom Southeast corner of Australia and in the expanded map you can see its relationship to the city of Melbourne it's about a five hour drive from Melbourne and as you can see in the in in the in the aerial photograph Pleasant Green there's prison green rather flat Countryside um about five or ten kilometers from the uh from the from the from
the Great Southern Ocean and a very popular tourist drive down the coast in that area you can see cows standing in the fields in this picture and that's because this is a dairy farming area and from our perspective as operators on The surface one of the things that probably won't surprise you if you've been listening to the news from Australia recently is that for about half the year you can't do any seismic on the site because it's too wet and on the other half of the year it's very difficult to run seismic because of the
total fire ban but between the but so this is just this is just the way life is in ours not really there we go So here's a here's a photograph of the of the site um and like like all of you'll be familiar from oil and gas operations when you go there there's really not very much to see in this case you see the the puddles of water which tells you it's half of the year we were in and there's well here and that's about it we get lots and lots of visitors to the site
and really one of the things that we are showing them is well really There's almost nothing to see so as I mentioned this project goes back quite a long way now and I just wanted to give you a and an overview of the of the journey that we've been on and the different sorts of storage uh questions that we've tried to investigate so the some of the sort of background of funding and governance is of Interest so this this site has been run by an entity called CO2 CRC which is a kind of Umbrella Organization
for storage and capture research in Australia it brings together businesses industry federal and state funding and over the years the uh the money for the site which is several hundred million dollars probably now um has come primarily from federal and state governments a lot of it has come from the Australian coal industry through a research Levy that they pay and the entity has as many Industrial members much like Sue's Gulf Coast carbon Center um big names like total or shell or Chevron or members but lots of smaller entities as well who for one reason or
another are interested in in ccs and want to find out what it's all about and and get an end on some of the knowledge that we're generating so we began in in 2004 with an experiment I'll describe briefly which was the first one we did which was to Sequester 65 000 tons of CO2 in an old in a depleted gas field on the site and after that we moved on to be more interested in Saline aquifers in other words um reservoirs that are not seen hydrocarbons at all and we ran a number of small injections
and two larger ones 15 000 tons each over the last over the last decade so I'll describe I'll describe those briefly as we go along one of the interesting things about this Site which makes it um really really very convenient well not just convenient but possible to run series of experiments like this is that we don't have to pay for the CO2 when the site was bought um it contained a well which had been drilled from ethane and turned out to be 80 CO2 this world's called buttress and we got this well as part of
the part of the package on the site When somebody last looked there was still 200 000 tons of CO2 down there which had current prices as you know paradoxically is an awful lot of money so we don't have to worry about CO2 where it comes from and in fact even pumping into the ground is relatively easy because the two aquifers are almost the same pressure so the the pumping is almost like a siphon from one to the other so that's a that's something we kind of Forget because it's a luxury we've just had for decades
but it does make a lot of things possible so here's a I'm not a geologist myself but I'm I felt obliged to put some geology in here for the benefit of all of you so here's a a an image of the of the site looking down um this was a this was produced around the time we were doing the the very first experiment the stage one Experiment and so it's focused on uh on this well here on this area here this is the old gas field and when we got the site it had a well
right into the crest of the structure called nailer um which was going to be used for the for the experiment so at that time we only we only drilled one well which is the injector here we had the old the old extraction well as a monitor and over here is the CO2 well which I mentioned Um so and that the scale of this thing you see down here is about a kilometer so this is all quite compact here's a cross section along that line um that vertical line that you see in this diagram and there's
an impressionistic geological cross-section and the things that sticks out to you even if you're not a geologist like I'm not um is that there's no flower of faults here and everything is broken up into quite small Blocks um we were interested for the first experiment in this old gas Reservoir down here with which the nailer well went into and a bit later on we'll come on to this overlying sale on aquifer the parity which is the one where we've done most of the most of the recent experiments so the the stage one experiment um was
had kind of everybody and his brother come along and did all sorts of Things because it was the first one um from the point of view of storage it was kind of the safest thing you could have done because you were putting CO2 into this into this Reservoir that had methane in it for millions of years it had this it was it was it had a convincing seal um and the the way the EXP a lot of what was done in the experiment was to first of all make the the point that it could be
done It's something very important it did was to generate the necessary regulations to do the experiment um when this all began no one had ever thought of putting CO2 in the ground in Australia and so there were no regulations to to say how you could do it there was no legislation whatsoever and it's it's one of the kind of unsung stories of getting the whole thing started was the efforts of of senior People like Peter and many others to actually engineer the creation of the necessary legislation as you all know getting acts of parliament in
Australia or anywhere else made is not an easy thing to do um and getting all of that in place and finding out who was responsible for overseeing those regulations who you had to report to all this kind of thing that it's easy to say had to be worked out completely afresh and all of that work In governance has stood Us in good stead over the remaining two decades because we haven't had to do any of it again we have a framework for operating in scientifically the concept of the of the injection was was quite simple
you see over here in the the crc1 injector that will be drilled we push the CO2 in down dip and it it floats up dip on the buoyancy and it arrives at Naylor where all sorts of monitoring equipment had been placed um to get the the progress Of the CO2 gradually gradually filling up this container so there was a there was a packer which you you see here um in this in this picture below it there was some YouTubes which came from lnbl from Barry freifelt and his group and there was a whole bunch of
other sorts of electronic hardware and jewelry down there to to to monitor the progress of the of the CO2 coming up in the reservoir So the first thing we discovered was that nothing ever works properly down Hull and we lost contact with everything below the Packer except the YouTubes which thank goodness kept on working but all of the all of the seismic gear and geophones and stuff that was done they'd be lost so much of the much of the reservoir monitoring in this experiment um came about from monitoring monitoring traces from essentially geochemical Analysis of
samples that were picked up in those um in those YouTube so samples are brought to the surface under pressure and taken away and analyzed and partly for tracers the top one is sf6 that was put in the injection stream and also just for just for CO2 so this this was most of the data that we had from this experiment on on the containment aspect and how things behaved in the reservoir it proved impossible to get any seismic Imaging Because there was already methane in there and so you couldn't really tell the addition of a small
of the CO2 because the methane dominated the reflections anyway foreign so the top the top graph the the color coding shows the variety of predictions that we that we had from for various geostatic statistical realizations of what the reservoir might look like and the as you know there's usually quite a Large spread in in things like arrival terms for tracers so that's what the those various models of the various uh the various light green shaded areas showing the concentration as a function of time and then the observations of the of the orange dots and the
obviously quite a lot of scatter there but really it's fairly clear that we came in right at the beginning of the Of the range of predictions and the CO2 Below in the bottom graph shows that pretty clearly as well and rather less spread there in the in the in the predictions of the traces so these data told us that the CO2 had gone into the reservoir that had arrived it gave us some idea of the volumetrics and a useful thing we could do because we had three YouTubes at different levels is that we could measure
the rate at Which we could fill this Reservoir which was useful information since it already had water and methane in it uh residual methane and so it was it was a useful way working out what the capacity would probably be for such such storage um really but in any circumstances where you had residual methane and there's a lot of storage around the world like that and because this was more than 10 years ago it seemed exciting to us that you Could put so much CO2 into depleted gas depleted gas fields of course since then almost
nobody has done this or anything else very much really unfortunately one of the areas where there was a lot of of uh of work done at the in this early stage was in monitoring the other surface this was this I think was at the time but still fairly new territory for all of us and we hadn't quite worked out Um to put a bluntly what we were going to do with all these data because this was a first experiment and there was a lot of money sloshing around for everybody we did all sorts of things
at the surface the probably the most important one from the point of view of the social license on the site is in the little picture down at the bottom there which was we measured what the water composition in the farmers well bores All over the place all over the site the farmers draw their water from the shallow Limestone aquifer the surface but there are a number of deep strategic Reserve aquifers as well that we also monitor so a lot of data was collected first base first of all Baseline data and then what and then monitoring
data over almost 10 years of the of the condition of these aquifers another one that we did a lot of which Um this was before Catherine explained to us how to interpret the data so we just collected lots of it and puzzled over it with soil gas data this was collected over a very large group well to us a large grid about a kilometer on a square which you can see the little back there and a personally of the picture is one of the many generations of reluctant graduate students who had to go out in
the heat of the heat of the summer and collect these collect these Samples um these of course were very puzzling to us because most of us were geophysicists or physicists and we hadn't really thought about how he'd interpret these data and of course what you find out as Catherine I'm sure has told you folks is that the CO2 measurements in these data are all over the place they vary with season they vary over the years some of them are 10 some of them Are zero it was very very difficult data to to interpret and and
difficult to explain uh when you're trying to build up a try to build up Social license one of the other other ones that we did which has now faded from view mostly on the international scene was just measuring CO2 in the air um the my colleagues at csiro have been experts in all sorts of atmospheric compositional measurements to very very Exquisite levels of sensitivity and That's them going up going up their Tower where the the air composition was measured downwind of the injection well for several years and again very difficult measurements to interpret because the
CO2 levels in the air are changing all the time and so and and trying to figure out what the signal would be if one had any sort of leakage is quite is quite challenging just as an example of that one of the one of the highest CO2 readings we ever Got with this equipment was one very still night when there was a small Bushfire nearby and the the CO2 levels went up to about a thousand PPM without uh without without any without any leakage so um we learned a great deal from collecting these data and
understanding how to interpret them and I think over over the years we've realized that these type of data are not there to Monitor anything geophysical they there as Assurance for the local land holders to be fair this was recognized at the time we're trying to cope with the resulting flood of data and maintain the line on the sort of interpretation was something that we really had to we really had to learn I think both nationally and internationally as as we as we went on so that that was stage one that was 65 000 tons And
I I guess it it gave us that good experience of of surface monitoring gave us a lot of confidence that we understood storage under relatively simple circumstances uh certainly not the first time this type of thing had been done but as I say the first time it had been done in Australia with all the concomitants administrative and Regulatory things that we had to get in place So the next step was to was to move up into the into the parathi which you see in this little it's a sketch here so this is a the classic
heterogeneous saline aquifer it's it's very flat it's it's not got any really clear structural closure of any kind and it would seem to us to be a good model of the kind of Salon aquifer that was being talked about as was where one would find an awful lot of storage nationally and internationally So the overarching idea here was well um we don't we don't have a structural closure here we're not going to have buoyancy doing an awful lot for us it's not going to be a simple kind of just fill up a container kind of
storage so we need to characterize what's going on in this aquifer pretty well and then we're going to do an experiment where we put in CO2 we're going to see if we can detect it seismically which would have been the first time for us With relatively small amounts and we're going to see where we turn off the injection whether the uh whether the propagation of the plume actually stabilizes in these circumstances because there's nothing very much making it go with any one particular in one particular direction so as was well known at the time one
of the primary trapping mechanisms in these titles in any sort of aquifer really is Going to be going to be capillary forces and this happens because the CO2 wants to curl itself up into a little ball as water goes past it after the injection there's a nice animation of this here if I go back well I'll be able to get it to work yes yeah okay uh the thing to press was at the bottom Left what was it oh yes thank you Catherine can you have a second yeah oh media has nothing so maybe it's
not comfortable oh okay is the file still on your side okay let's let's let's let's just leave it I think the concept is is probably familiar to most of you that the the um the the the reason for wanting to check This is that the immobilization mechanisms which would have stabilized our um our our gas in our aquifer a really twofold one one is simple dissolution of the CO2 in the surrounding in the surrounding brine that's quite an important mechanism and surprisingly quick and the other one is the scapulary trapping mechanism which is responsible for
residual oil which I'm sure everyone in the audience is familiar with So our first step was to do an experiment where we tested the magnitude of the residual trapping in this particular aquifer and while it was while it obviously a kilometer scales in the case of residual oil this is well known and and it had also been experimented on a lot of it on the core scale what we wanted to do was to see if it actually happened on the mesoscale on scale of tens of meters And happened with CO2 and it happened in our
our aquifer so this ended up being a fairly elaborate experiment again based around tracers quite small injections with tons of CO2 that were put in chased with water to get you to residual trafficking and then reduced back to look for the look for the signs of traces and chromatographic methods allowed us to get the get estimates of the residual trapping and Characterize the the reservoir So based on that we were able to design the experiment and have a better idea of what to expect and as I mentioned an objective here was to see the smallest
amount of CO2 possible that came in came into the the aquifer to see it by seismic methods the reason for doing this wasn't just curiosity about our our seismic equipment but it goes back to an idea that sooner a group have advocated for Quite quite a number of years now which is that you can use an overlying aquifer over CO2 storage as kind of Sentinel and if CO2 gets into it you can see very you should be able to see very small amounts so it's the it's the canary in the coal mine principle sometimes called
an Esme an above Zone monitoring interval so in this case we were going to simulate a leakage into into one of those by putting CO2 into this parity line Aquifer and see the smallest amount that we could see well there was some very exhaustive characterization of the uh of the of the noise properties the site done by our colleagues at Curtin University in Perth and they reached the conclusion not completely surprising to those who you know about seismic work that the best thing to do would be to bury the geophones at about two meters depth
to get away from all the surface noise Which is considerable even in a quiet looking place like this and although it looks like a lot of work to bury a ray like this it actually saves a lot of work too because when you're doing a whole bunch of repeated surveys you don't have to come and lay out all the geophones especially across all the farmers fences and negotiate with all the cows and all that kind of thing it's all just sitting there and really the only the only thing You have to do which is not
negligible is organize running your vibrasize along the surface so there's just some pictures of of a seismic array in in progress and the map shows you that we were setting out this buried array across about about a square kilometer so all of this work ended up with what I sometimes refer to as one of the the shortest movies in history Um so we we got we got a five frame movie of the um of the evolution of this uh of of uh of this plume and here are the here are the images again around around
a kilometer or so on the side and the real really important ones I guess for me are the first and the last um it was it proved possible to see the CO2 plume when there was about 5000 tons in the in the aquifer so that's really not very much at all that's completely inconsequential from the point of view Of any environmental impact and it tells you that indeed with this layout you've got a really good chance of doing this kind of Sentinel Central Arrangement and seeing a small injection seeping into any overlying aquifer if there
should be any sort of leakage the other one that is of Interest really is that is the last uh is the last few which span about two years uh particularly there's nearly two years between these two And what they show you is that the plume stabilized we've searched around quite a while for what word we should use to describe what seemed to happen but stabilized seemed to be a good a good description that basically the CO2 went in there and pretty soon the solutions and capillary forces stopped it going anywhere and just chewed away at
its edges and in fact nowadays nearly 10 years later it's in fact quite obviously even smaller Than this mostly because it's about a third of it is dissolved so that was that was the second stage and that was another 15 000 tons from our inventory after that we had it we had a bit of a pause to um uh kind of figure out well what's the what do we need to do next and our conviction was by that stage that we we knew sale on aquifers were going to Have to be a big deal for
for storage internationally that's where the capacity was and it was also I think becoming clear that we were going to have to use uh geological formations about which not very much was known because we were going to want to stay away from places where there'd been a lot of hydrocarbon exploration because of event abandonment Legacy Wells now this is not a black and white issue but certainly it does prompt you towards looking for somewhat unconventional forms of storage compared to using old hydrocarbon hydrocarbon reservoirs yeah so that points you towards the question of monitoring if
you're going to be using uh I don't want to say unknown but but less less familiar types of storage than If you were just going back to an old hydrocarbon Reservoir we're going we think we're going to need some some monitoring methods which we can focus on particular areas of risk rather than monitoring the whole thing and it had also become pretty clear to us that we wanted monitoring but that you didn't have to do much you didn't have to be on the surface very much because even even for us operating and essentially in farmland
And with very good relations with the with the neighbors coming and doing monetary on the surface is always a big deal it's it's always difficult at the bottom you have to send people which is always complicated and expensive and then you have to negotiate access something something always goes wrong there's always the risk that you're going to cause some trouble for the Neighbors which you don't want and just as importantly as that really It became very clear to us and it's not exactly news but the deeper you could get the closer you could get to
the CO2 the more sensitive you would be and the more focused you could be on the particular issues that you want to do but wanted to measure so our we we had two uh two ways of doing this in mind uh they all involved uh Drilling in quite a number of extra Wells and we were fortunate to uh to have Obtained very substantial funding from a federal CCS program that enabled us to contemplate this in the sketches our concept of how we were going to how we were going to develop the monitoring in this the
subsurface idea so again this little sketch is the scale here across is around is around a kilometer or so and the idea was to inject the CO2 over here at the first well we drilled clc3 There's a very gentle uh slope to the formation that allows us to float the CO2 upwards and the idea was that we were going to make a pair of two pairs of gates and this was going to Model A circumstance where you might be ejecting at a large sale on aquifer relying on Long migration lengths through the through the aquifer
and gradual residual trapping into solution to to stop things to slow things down And so you may wish to examine that process of particular places and times and so these Gates were intended were models of of that of that concept uh in in practice the uh the layout wasn't uh wasn't as clean as that here are well six and seven over here on the side we were able to make it we were able to make a gate uh be over on this side it happens that there's a very large Fault that runs approximately along here
at the Reservoir level and on that sketch of yours we would have put this well number five on the far side of the fault and we agonized over this for ages because although there wouldn't be a problem for any seismic methods we had no idea where this fault was sealing to pressure or not and since Some of our methods were pressure-based we were afraid that we would get the wheel five on the far side of the fault and not be able to see anything because we were isolated from the for the ejection Reservoir so in
the end we had to compromise and put well five over here somewhere else so something else I'll just indicate while I've got the got the map up is that as I mentioned one of our Concepts was to use downhill pressure measurements to measure the progress of this plume that we're injecting over here but as I come to in a moment we were also going to be doing seismic measurements and a number of permanent seismic sources which I'll come to in a moment were installed dotted around the site here these are these these yellow dots these
are so-called surface Optical Vibrators designed at lnbl and they provide permanent seismic sources which is very convenient so coming coming on to the seismicity first the seismic measurements first of all so the new development here was instead of using geophones on the surface we decided to run fibers actually on the outside of the casing of these Wells these are the so-called distributed Acoustic sensors that many of you know about or where the fibers are sensitive to to acoustic waves and because they submitted to the casing all the way down the well you've effectively got a
geophone string with a spacing of just a few meters top to bottom in the well and because it's really quiet down there they're exquisitely sensitive as well and you can just get continuous you can get continuous data out of them you can get A terabyte a day if you if you really want to um running running these fibers on casing is not is is not free of risk obviously because the the fibers clamped to the casing when you're running the casing in the well you haven't got your usual option of rotating the casing to go
and get try and get past a tight spots and you don't want to reciprocate it all that much Either so really when you do this it's a matter of just running the casing straight in and hoping that nothing happens and watching it happened is fairly tense as I'm I'm sure those of you know being on field operations couldn't remember the other the other tricky bit is of course Perforating the well once you've got everything in place because you don't particularly want to perforate the the fibers and so you have to use Orientatable the perforation guns
and you have to have markers on the casing to tell you where the fiber is at your agile at your perforation dip so not not not exactly rocket science but certainly not a commonplace um and uh and somewhat risky but nonetheless we were able to get fibers in all the you know in all of the new wells we drilled on the casing um and additionally we ran fibers actually in the well ball in some cases On tubing and on some cases on cable to mimic the situation where you might come back to a well and
want to put fiber in it so we wanted to see what would happen if you had to have the fibers sitting essentially in the brine in the well rather than in contact with the formation the way these were used was essentially to make vertical seismic profiles vsps we had permanent sources which are these green green dots in this image and you You just shoot into the shoot into the fibers all the way up and down the uh all the way up and down the wells and that enables you to make a real movie where you
can take you can get an image almost every two days for as long as you like and uh over here for example where the reflection points are this might be where you're seeing the plume emerging from an injection well or here might be a point where you just Have an area that you think is perhaps of some risk and you can just monitor it all the time by suitable placement of your source and your and your monitoring well the Masonic sources themselves are these green objects here there are two of them one for low frequency
one for high frequency a very small footprint really all you need is this concrete pad and three-phase Power One of the beauties of these sources is that they are very very simple in their design so they can be maintained at a relatively remote country location without too much of a hassle uh they're not that they're not a lot more complicated than washing machines and our site operator from time to time pops down to the nearby Town into the equivalent of Home Depot and get spare parts for them to keep to keep them going so they
they're just perfect And they they we don't run them during the day just in case they annoy anybody during the night I should say in case they annoy anybody but it takes about two days to get an image with one of these one of these sources shooting into the fibers something I might just mention at this point is that the although the wells were drilled and commissioned The the actual injection phase of this project had to happen during the pandemic and it happened at a stage when movement in Australia was extremely limited state borders were
closed unpredictably much of the time uh and I've put quite apart from that the the locals at this this area where we work had made it very clear to us that they really didn't want visitors Um the local hospital has one ventilator in it and so we just didn't go there for about nine months I think and as I mentioned we have one-site operator and in a kind of a kind of Miracle really our geophysics colleagues at Perth managed to get the satire system operated remotely from Perth with the assistance of one site operation I
think mostly by putting things in the post and having and putting them together over Zoom Uh but in the end we were able to run these these surveys uh remotely as I mentioned they produce around a terabyte of data every couple of days all of those data were squashed down to manageable volumes on site working remotely from Perth and in the end the results were just kind of emailed back containing the latest seismic image so that um that was something we hadn't expected obviously but it was it was a Great advance to be able to
run our monitoring with so little uh site presence and and be able to do so much remotely that was a great learning experience just another shot of the sovs and some of the some of the cows and here's the the type of answer one gets so a somewhat complex diagram I'll just step through it for you so again a scale bar here's 700 meters and here are two of the monitoring Wells I mentioned there's the ejection well and they're the other two monitoring Wells and down here are these permanent seismic sources and each of these
lines here represents the reflection points where the Rays from one of these sources hits the reservoir of interest and bounces back into into the acoustic sensors so during routine operation you're obtaining information about essentially the Impedance all along these lines they've been put where they are because they're they're traversing the plume that we've made and so they're giving you information about its progress as it gradually develops so over here is the plume that we made eventually this is as it looked about a year ago this is an outline from an ordinary surface seismic survey and
you can see that all these traverses Have been arranged to monitor this this plume as it gradually progresses in this direction here over here the yellow the yellow outline this is the this is the plume the the seismic blue the CO2 plume that we've made in the earlier stages in the in this in the stage two injection this is the one that's just sitting there gradually getting smaller and smaller that I mentioned to you and it's also being monitored because Our our modeling suggested to us but these two plumes are going to interfere with each
other they're in the same Reservoir and this one might start to move again so a number of the the monitors have been put to uh to to monitor this plume um as as well as this one which is which is the new one like so what actually happened is that the those vsps those those measurements Every two days great as as the color coding here shows picked up the creation of this plume and it's the new plume and its gradual propagation up dip but interestingly at a late stage of the ejection they also picked up
the the two plumes merging with each other and some indications the entirety of this plume this old plume it started to move a little bit when the New gas arrived and started and started pushing into it my most convincing evidence here on these on these measurements is is here what this this transect here is telling you that there's certainly something changing in the in the old plume and the same and the same over here but interestingly it didn't do very much it it you can pick up you can pick up very small changes with these
with these sensors Um but there wasn't much sign of it of of anything of anything more than what I'm showing in this this diagram certainly not the certainly the old plume didn't just pick itself up and run away so I mentioned that we were interested in pressure monitoring as well uh pressure downhill pressure of course was being used in oil field operations for a very long time it's very informative What are we trying to do in this experiment was to was to develop a variant of the classical interference test where we would inject water at
one of the monitoring Wells and measure the pressure response of the others and it turns out that you could invert those those measurements to get information about the distribution of compressible fluids in between the wells it's a it's a somewhat complex inversion process but it but it can be done Here's the the pressure time series over the the period that we did the injection I've just included this to show you the um uh where the how the water injections happened so these These are pressure measurements that all of the uh uh all of the wells
listed down here so here in December 2020 before we started this was a baseline injection where we had we hadn't put our CO2 in the ground Yet and we did water injections at all the wells and found out how the pressure responded so that was a Baseline uh then we have the complicated real life series of trying to get the compressor started putting CO2 in the ground compressor failure power outage all the kind of stuff that happens in the real world by the end of this whole performance we had something a little over 5000 tons
in the ground turned everything off did Another series of water injections over here started again everything went a lot smoother got about 10 000 tons in the ground did another water injection and so on and from this it was possible to invert these pressure data to get a kind of crude image about where the CO2 had got to in between the wells so over here just as an example I've shown the the kind of recording that you get of the pressure in one of the wells while you're doing these water Injections of the other Wells
as you would expect you'd get a whole series of pressure risers and falloffs the amplitude is pretty small it's under a PSI but the environmental noise is a lot smaller than that and so you can get you can rely these measurements and fit models to them and when you do that you get images of saturation over here is an example so there's the plume that we put in And there's the old Legacy plume this is quite late in the injections and the the pressure tomography method is indicating that this it's seeing CO2 in approximately this
kind of area and indeed probably the strongest signal it's getting is from the from the front end of the of the Legacy plume we're indicating that interference with the new CO2 that I that I mentioned before and also some indication of of some of something Happening way down at the bottom here the far end of the Legacy plume uh since this diagram was prepared we've also done full scale uncertainty analysis on these on these images so this is kind of just this has this image has no error bars on it obviously but we're also able
to make 50 probability Contours which of course are somewhat bigger than I'm that I'm Showing here but give you a better idea about what to believe and not to believe from the from the from the pressure topography but our concept for this is that it's uh the kind of thing that you can do relatively relatively easy and you could use it as a warning system it's not intended to make a detailed map but it's it's certainly true from the uncertainty analysis that small amounts of CO2 have a big effect on the compressibility and They give
you can get a good idea of approximately where something is changing and then you would turn on more elaborate forms of monitoring so I'll just wind up by mentioning that we did a whole bunch of other things as well which I don't really have time to go into uh we we simulated above Zone monitoring intervals again During the period that before we had CO2 in the ground we could use those water injections As as test pressure pulses and see if we could locate them with all the other pressure sensors located where they are in space
that worked pretty well we have lots of data on Earth Tides which we're still trying to interpret there's an awful lot of information in Earth tides distant earthquakes turned out to be very useful seismic sources and they give us quite a lot of diagnostic information about whether What CO2 is doing near the wells uh and passive seismic we've got loads and loads of data which we're still which we're still working on I just can't resist showing you this uh this Earth Tides uh that this pressure log of Earth Tides because it's just such Exquisite data
this is the pressure measured downhill um and these the the amplitude of these this the scale here is in pounds per square inch so it's a tiny tiny signal Which is beautifully recorded by the gauges these characteristic double-picked humps all over the place are just the two Tides a day in the earth tides and the slow oscillation here is the changes in barometric pressures where the fronts come past there's a huge amount of information locked up here about the compressibility of the rocks in the vicinity of the gauges which we're still working on so the
stage three conclusions for us Was that we'd managed to make methods of monitoring which were pretty unobtrusive on the site which could be run remotely which are very sensitive um so that that was really the the takeaway from from the third stage of our work so looking back over over two decades uh storage it was extremely important to prompt development of legislation and regulation a pretty boring sort of thing to To think about but really vital work that gave us the ability to run uh experiments uh in a continuing way over the next two decades
and which made it possible for more wide-ranging legislation to be developed that covers CCs in Australia now in all the states and territories we developed a lot of monitoring methods and I think it's important that we discarded a lot of them we don't want to run a physics experiment here we want to Do garbage disposal in the safest way possible um quite substantial I think is the way confidence grew both both within the team and also more widely as the geology was better understood at the site and things just happened the way they were supposed
to and that confidence floats out through the membership in all sorts of uh in all the membership companies which is important we developed a lot of human capital And importantly cccs has not gone away from the public debate and we have lots and lots of visitors we did it anyone can come and look which I think is important so with that I'll close and and take any questions [Applause] we'll take turns question in the room question online Catherine it's Charles that's a great presentation I'm wondering so you the first injection You did was in a
depleted gas field and right now there's a lot of discussion about some of the challenges of injecting into depleted gas fields did you come across any of those challenges yourself or um and what so yeah and what was that like for you doing that first off yes I what you're referring to is the um the very rapid cooling that can happen with gas going into a very Under Pressure field ours was not that that Was ours was not that Under Pressure so we did we didn't have to confront that there's a very strong aquifer drive
so these recent concerns were news news to us as well it was not something we'd see that we sign of probably lucky if that was your first guys yeah there were some other problems foreign seal the expansion what what sort of seismic Parameter or attribute we use to make that so you're asking what the Contour is is of yeah right yeah I I I believe that's saturation times height so it's it's an estimate of the yeah so really it's it's sensitive to the the saturation of CO2 in the rocks yeah but let's take an online
question um uh James do you want to unmute and ask or you want me to read it did you you could read it that's fine Surface inflation and any detection of induced seismicity okay so two questions there um we land surface inflation that we certainly considered the the volumes that were calculated to be too small for the effect to be readily detectable we did try using a test within Tsar where we got some permanent reflectors and and dotted them around the site What we found was that the the land surface moves an awful lot because
of seasonal effects because the water table and that was really all we could see and that was a lot bigger than any predicted geomechanical effect induced seismicity yes there are small small seismic events very small seismic events in the reservoir um they they've become easier to see now we've got the distribution of acoustic sensors They may contain useful physical information but we haven't managed to unravel that yet another one online from Ronnie um two questions any plan to take fluid samples um and or even core after to see if there's any impact to mineralogy after
injecting CO2 into the saline Zone is there and second question is there expectation to see the CO2 floats on top to the top of the reservoir and Preferentially spreads out from a top layer first when injecting and saline Zone just to take the second Point first yes so that that's certainly what happened the um uh the plume is pretty thin it's it's just it's gone up against the top baffle in the in in the reservoir and spray and spread out in a very thin layer quite quite a long way and that the Waters of interest
to us was whether it would stop Or not Richard did um the first question about samples is that we had thought of putting YouTubes in one of the wells uh but basically we ran out of money um or we could see we were going to run out of money um and so we did we unfortunately we weren't able to do that um there there is a plan a plan a gleam and Someone's eye to have a stage four which will involve drilling a well through this plume that we've made and collecting lots of core from
that which would certainly be of considerable interest for the for the geochemistry and the neurology yes right flitter thanks thank you thank you that was Sue was right this was a very cool experiment I really Appreciate your sharing this with us um I am curious about your communication with the public you mentioned several times that there were concerns and could you share what type of concerns they had and how you were able to communicate with them to help them get over that yeah so I think the context is important so this is a this is
a farming area so it's not very densely populated so in the number of neighbors you have To deal with is relatively small um as regards that particularly the the operating organization the CO2 CRC that I've mentioned from the very beginning has run it's uh it's it's public relations program on the very simple principle that you heard it here first so whatever it is that happens at the site whatever whatever people may read about In the newspapers we try to make sure they hear it from us first that we have a in addition to our site
operator there's a community liaison officer who is resident at the site in the area over the years this has always been somebody who knows the community a retired school teacher someone like that and so uh and they're and they're regular Community forums before anything big happens at the site there's always lots of information handed out and Because visits are made the liaison officer actually goes and seeks people and talks to them so that's that's the way the the local um the the local part of it works and I think because and then because of that
there's there's never really been any controversy that's leaked out of the site into the wider into the wider area it all just works nobody makes a fuss about it it's not Very interesting to go look at um and so the the higher level public relations around the injection has almost all been um kind of under under our control in the sense that we decide that we want to tell people put out press releases to say we've done things we we don't very rarely do we have to respond to criticisms or scandals yeah um um okay
we had two more let's see if we Can jam them in um from from motion uh can you share more detail about the results from your asthmi campaign I was wondering if that actually sorry for uh chiming in I was wondering if that corroborated any of your geophysical data and your pressure uh inversion that you had done sorry for not being clear in the question thank you um okay so I'll say a little bit more about the asthma I might just go back to The image actually so the the the the concept is just to
reiterate is is fairly simple which is that you have this overlying aquifer you get a leak of CO2 into it it puts up the pressure at a point that pressure wave propagates through the aquifer and it reaches different gauges at different times that's the simple picture we we did this in this diagram That I'm showing here we we injected water at this green well here and we measured it measured the pressure pulses of these other Wells and then essentially just work backwards to where it must you you get a distance from each of those Wells
right and and where all those distances intersect which is where all these circles intersect that's approximately where the source should have been and Indeed the method found the uh found the effect became very close to the to the source of the pressure so that was a very simple pressure inversion assuming a homogeneous aquifer um we we pretty soon found out that if the aquifer is complicated this process doesn't work very well for example once we had a tiny bit of CO2 in there in in the in the reservoir the this type of inversion just doesn't
work because the Travel times or the pressure wave are too different in the sea it's so different in the CO2 than they are in the brine um but for for the kind of SME monitoring that sooner group have talked about one would have a virgin aquifer with no CO2 in it sitting above the injection Zone and uh it as long as it's reasonably homogeneous and doesn't have faults and and barriers In it this kind of simple inversion should work to tell you there is a pressure pulse and it's coming from approximately over here okay last
question from a regulatory perspective do you see a subsurface plume conflict one plume impinging on another plume as a concern at this point or any thoughts on how to manage or mitigate such a conflict yeah I mean we We were interested we we collided these two plumes deliberately because one could I mean certainly in the oil field you get lots of different people operating in the same in the same Reservoir or in stacked reservoirs and it seemed worth just trying and seeing what would happen we were we were fairly confident that nothing much would happen
and although we can see seismic changes the the the plume does not appear to Have moved uh does not appear to have moved at all I would imagine and and for us from a regulatory point of view um all of this was was covered off with our regulators and the risks were thought to be the manageable or not really present uh I imagine one would have to negotiate these things Case by case you can imagine lots of different circumstances Uh for us it was clear that even if the Legacy plume did move there was kind
of nowhere for it to go there was nothing consequential that was that had posed any risk if it moved a bit that could be quite different in other circumstances and in fact in the Australian CCS regulation one of the biggest concerns is interference with other people's operations I mean here in the states the concern is Very much with groundwater and interestingly in Australia the groundwater is not talked about very much it's interfering with other people's oil and gas operations that the regulations are really worried about and this would be a clear case in point in
that it may yet turn out to be a useful example if that's ever it has to be discussed by the way of changing that regulation okay thank you audience of room and Online so much for your participation thank you very much Charles for being here can we have a round of applause if you want to catch you want to catch Charles he's around with us for one more day this one more day so catch him today before he zooms off to back to Australia so thanks everybody thank you sir