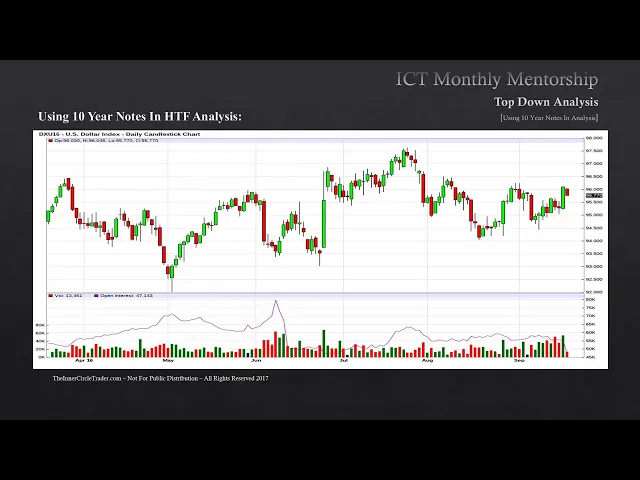
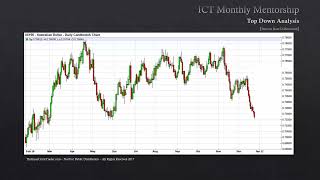
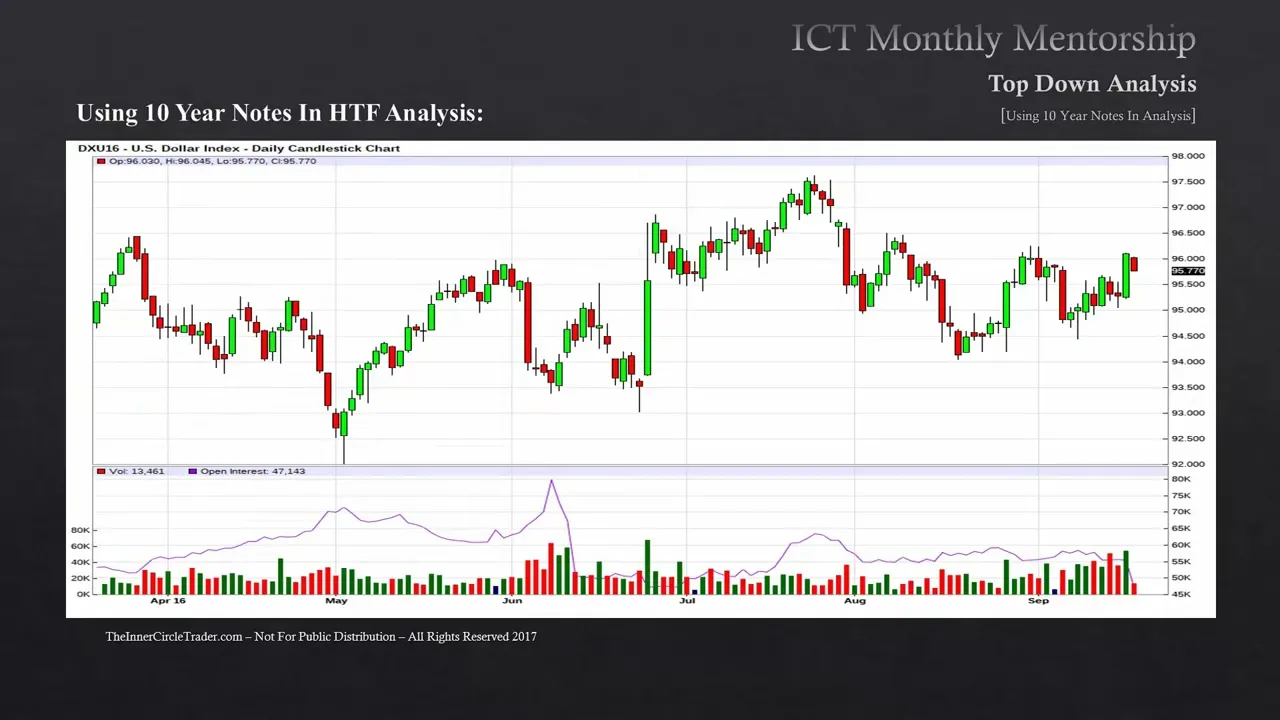
welcome back folks this is lesson 2. 2 of the January 2017 ICT mentorship we're gonna be looking at qualifying trade conditions with the 10-year yields okay the previous teaching 2. 1 we had looked at the 10-year node seasonal tenancy where it has a strong tendency to Rally in June and we're looking at the 10-year note for September 2015 here you can see how during the month of June of 2015 10-year note did in fact make a low in June and while the seasonal tendency is in force how do you know the seasonal tendency is most likely going to occur well the first step is you want to start looking to qualify the swings in relationship to the dollar Index and that's seen by looking at these lower lows here so our delineation begins at the beginning of June 2015 and subsequent lower lows it transpired after June 2015 began we start seeing a slide in price and took out the low from May but individually there was five to six different candles deck progressively kept making lower lows in the first half of June that's being delineated here but this short little trend line now in the dollar Index this is going to be ideally seen with a series of higher highs that's how Market symmetry should be posted and delivered in price but let's take a look at what actually happens in the dollar Index at that same moment we can see that the dollar Index for June 2015 immediately to the right or after June 1st trading day we were making lower highs so this is a crack and correlation and we have confirmation now there is a trade idea unfolding in to 10-year treasury note against the dollar Index it's further confirmed by seeing the interest rate Market declining at that time as the yield declines the Futures price on a 10-year note was actually rallying note also did the consolidation that the yield stayed in which also led to a consolidation in dollar Index 10-year Treasury and foreign currencies at the same time in 2015.
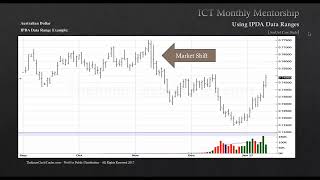
okay we're looking at the June of 2016. again we're looking at that seasonal tenancy as seen here the market was making equal lows so they should be seen in respect to the dollar Index with equal highs here's the dollar Index going into June 2016. did you see here the market made higher highs this is a cracking correlation the Market's shown a willingness to go higher in the dollar Index but it was not seen in the form of going lower on the 10-year notes that's a correct correlation there therefore it is a qualifying condition there is an underlying trade underway this is further confirmed by visually seeing the the interest rate Market seeing it decline in the 10-year yields again notice the consolidation while it looks like if you zoomed in really tight it would look like an uptrend but we're still in a rather large consolidation and that is attributing factors to why the currency markets had a consolidation this period of time lastly we have the 10-year treasury note March contract 2017.