unsold inventory of homes for sale has been on the rise all year it hasn't turned the corner yet inventory Rose across the country this week but at a pretty light less than 1% rate there are some signs that inventory growth is slowing with newly lower mortgage rates and at the end of the summer in the years before the pandemic it would be totally normal for inventory to Peak at the end of July or in August uh recently on sold inventory would rise later in the year especially in the last two years as the market slowed
inventory climbed all the way to November so I think we probably have another month or more of inventory growth but that growth sure seems to be slowing slower growth of unsold homes on the market is a result of still few sellers on the supply side and stability on the demand side so we've been in this extended period of weak or declining home buyer demand so that unsold supply of homes continues to build if demand just stabilizes maybe we're at the peak of the trend for the season we're keeping in on the lookout for these subtle
shifts in the market because it has implications for home price appreciation and for home sales volumes for the year there's nothing in the data that says 2024 is going to accelerate so the most optimistic scenario really we're watching for is the ability and may be poised for finally some sales growth recovery in 2025 at alos reseearch we track every home for sale in the country every week all the pricing all the supply and demand all the changes in that data the sales so that you can understand it before you hear it in the traditional headlines
I'm Mike Simonson I'm the president of alos research and let's take a look at the details of the us real estate market as of mid August 2024 so there are now 698,000 single family homes unsold on the market that's up less than 1% for the week uh that's the least growth in inventory in months and this makes sense as it's late in the season uh and as I mentioned in the years before the pandemic it would be very common for inventory to hit the year's peak in August or even July so but since 2020 we
lost some of that seasonality in Market Behavior I am very interested in the timing of this year's seasonal inventory Peak we are you know in a slow market so it's not a surprise that the unsold Home Supply is still growing in each of the last two years that unsold Peak didn't hit until November because mortgage rates were Rising late in the year that causing buyers to be discouraged and the purchase volume to slow down and so in the yearly inventory chart here you can see that inventory surge happened in the two red lines there 22
and 23 in September of those years with mortgage rates surging at the same time so maybe we're in the opposite scenario this year with mortgage rates falling in the second half of the year so maybe we hit the inventory Plateau earlier the first step there is when the growth rate slows down so that first the slope of the chart has to flatten the growth rate of unsold homes on the market has slowed from close to 2% weekly down to roughly 1% weekly this week was under 1% available inventory of unsold single family homes grew by
about 5,000 homes or 0.8% this week I read that as stability including a few consumers may be responding to slightly cheaper mortgage payments uh not a lot of sellers feel the need to unload in this market on the new listings side we've covered the slow rate of sellers for two full years now this week was no different with 67,000 new listings of single family homes unsold that's right where we expected it for the week it's a few percent more sellers each week than a year ago so in addition to the 67,000 unsold new listings there
there were 14,000 new listings which went immediately into contract the immediate sales so that's 82% more sellers in total this year than the same week a year ago 8 and a half% more sellers will cause inventory to grow when you look at the new listings chart here though you can see that this year's dark line is aligned with 2022 it's a little elevated over 2023 which were the record low levels but also there's no sign of any big surge in sellers so the most dire predictions about where the housing market is heading would require a
huge surge in sellers even in States like Florida and Texas uh which led inventory growth this year probably plateaued uh the unsold inventory in Florida actually ticked down this week new listings in Florida are down and in indeed uh there are fewer new sellers this week than in the same week of either of the last two two years Texas hasn't rolled over yet uh but we're keeping an eye on it Texas inventory grew by 1 and a half% or a little faster than the national average for the week so not all signs are showing the
plateau in unsold homes Texas drives a lot of the country so you know we'll see if my speculation comes through there are 366,000 single family homes in contract so that's a fraction fewer than a week ago it's basically unchanging from last year there were 66,000 single family homes newly pending this week 66,000 plus another 13,000 condo condos that went into contract so 79,000 total sales started mid August still very slow uh it is aiming us at around that 4 million annual sales mark and it hasn't really climbed notably I've Illustrated the total count of Homes
single family homes in contract here this year's curve is the dark line it'll dip again over the coming Labor Day holiday in a few weeks uh it's taking about 36 Days in contract on average for home sales to complete this summer so these sales were these sales here will mostly complete in August and September so as mortgage rates fall we're still looking to see if there's any notable uptick in buyer demand nothing really apparent yet uh payments are still very expensive of course uh but they're basically at their lowest point for the year so is
there a threshold that motivates buyers I previously assumed that being at 6 and a half% for the 30-year fixed mortgage would be a visible threshold for increased home buyer demand I haven't seen any visible confirmation that I'm right though in the last few weeks still looking for that if we see any uptick in buyer demand we're looking at September or even October before the sales needle moves so it's really fourth quarter data that we're looking at now if we're going to see any sales data improve on a relative basis relative to the last two years
so in this data here you'll see that with that you'd see that dark red that dark line finally lift above the trend from last year in both of the last two years the two lighter red lines here mortgage rates Rose in the second half of the Year 22 and 23 those sales took a big hit late in the year so maybe if we're lucky we see the opposite Trend taking shape finally this year with a few more sales building up to have a better fourth quarter if we're lucky if we're not lucky then rates haven't
fallen far enough or buyers are just going to wait until next year before taking any action so keep your eyes on the the weekly pending sales data here the median price of single family homes in the US is $449,900 $ that's unchanged from the last few weeks if you walk into the housing market today to buy or sell a house this is what with the the market looks like it's the same median price as last year and in 2022 in August the price is basically nationally haven't changed in two years the uh price of the
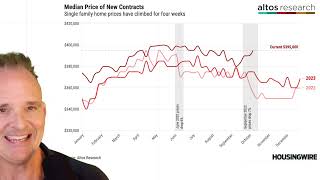
new listings this week is $400,000 that's roughly the same as last week and just fractionally above last year also so so I've used the long-term illustration of home prices here so you can see how the old normal steady increase uh over the B last bunch of years has plateaued home prices are basically unchanged over the last two years and in a world where mortgage rates stay relatively elevated or if the economy finally slows I anticipate we could have two more years in this same pattern so in this chart see how the the annual summer home
price Peaks watch that to to understand how the historical pattern works also note this how clearly this chart illustrates the new listings prices and the seasonality in that number that's the bright red line here so home prices are at their lowest over New Year's holiday then in the spring the best inventory comes to Market and home prices are at a premium that peaks in May then in the second half of the year if you're listing for sale you do so at a little discount to make sure the house moves before the holidays at the right
end of the chart you can see the this season's discounts are now in full swing coming down like they have in each of the past two years in 2021 right in the middle of the chart here uh the late year demand during that pandemic boom kept prices buoyed so you could see in August really how the home price appreciation was going to play out for the whole year so uh the price of the new listings now is $400,000 that's just fractionally above last year at this time time uh these are leading indicators for future sales
prices and it tells us that the sales price measure you see in the headlines will finish the year flat maybe just a little bit positive the uh homes listed for sale now are price basically where they were a year ago so the sales prices will be around the same levels uh when those sales close later in the year now it is notable that the price of the homes in contract are still 3 to five % above last year so at $399,900 this is unchanged for several weeks last year um was the the pending home sales
was hovering around $380,000 so it's $399 now and it was $380 a year ago so the uh the pending sales price are the best proxy for the sales that are about to happen and right now those sales are priced a little above last year and that's why when you see the headline numbers of you know about home sales prices they're still reading a little higher than 2023 I don't imagine that the that the pending sales prices are going to improve from here so I feel like there's only compression in the data through the end of
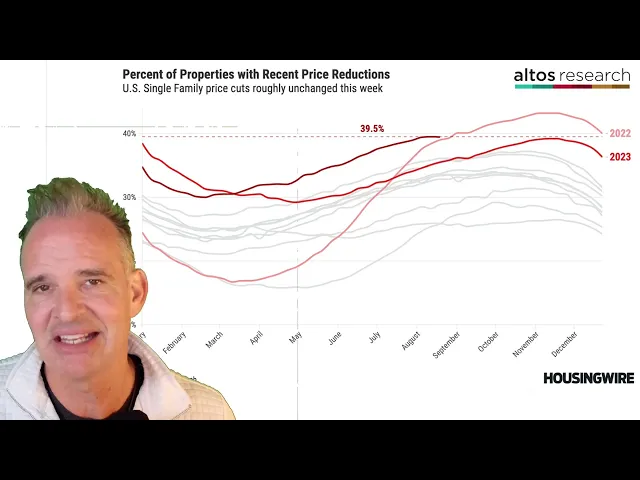
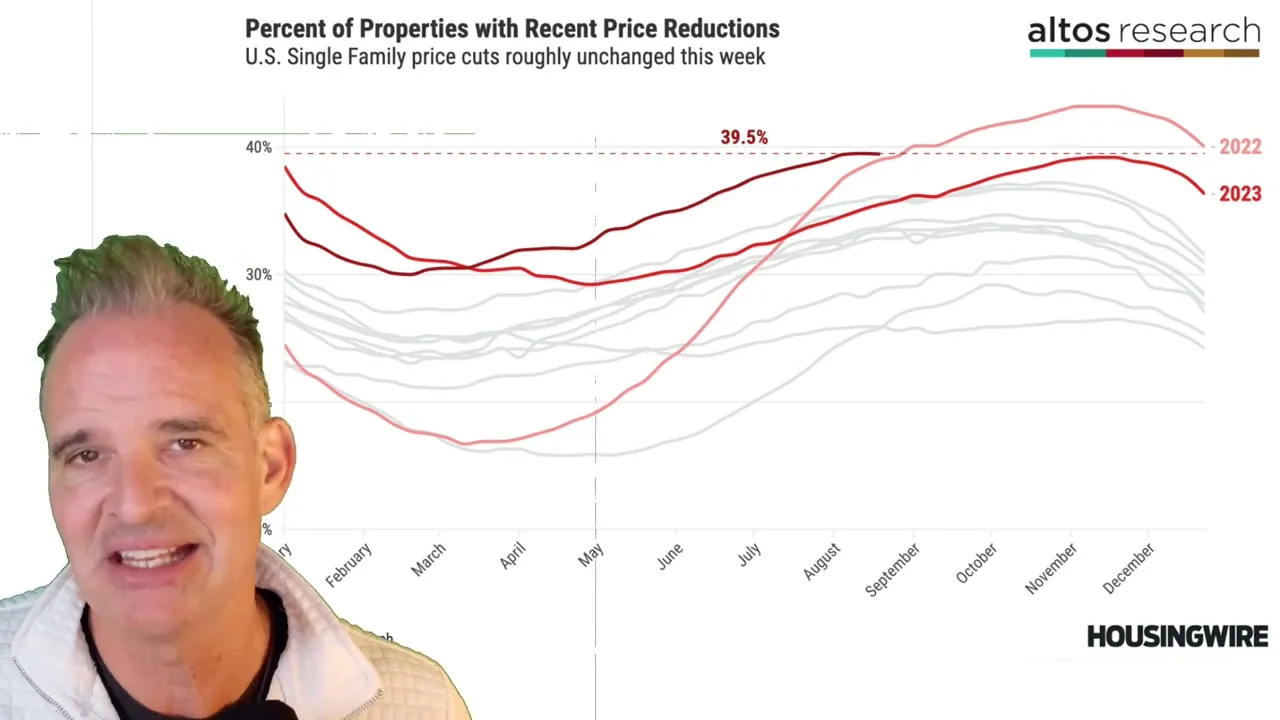
the year we're at 3 to 5% home price gains now so we're looking in the 0 to three 3 and a half by the end of the year price cuts on the homes listed for sale has maybe plateaued for a few weeks here at 39.5% of the listings that have taken price cuts from the originalist price though I do expect price cuts to continue to grow as the summer turns into fall uh as it gets later in the year any seller who hasn't gotten the offer they wanted has two options either you cut your price
or you withdraw the listing in either way the percentage of the active Market with price Cuts increases so this should increase slowly the number of price Cuts uh the percentage in the next couple months withdraws of active listings withdrawals of active listings are definitely climbing so this happens every year in every Market of course uh but it's happening a little bit more now so on the one hand withdrawals are a bearish sign there's no buyers sellers are discouraged so they're walking away on the other hand this illustrates that sellers can walk away it's a signal
that homeowners are not interested in a weak market and are in a good position to wait this implies continued tight inventory or bit of cap on inventory growth and it implies less downward pressure on home prices even in a time of weak demand if mortgage rates continue to fall and a few more buyers are motivated then we'll see this price reduction data top out in the next few months uh before be getting to decline for the fault if we're unlucky and rates bounce back up for example if the FED doesn't cut uh rates as expected
in September then the mortgage markets would react sharply and mortgage rates could jump in September and then we'd see a big jump in the price reductions line the same way it happened in both September 23 and 22 that could happen again so keep watch here and that's why we do this data work each week if final if sellers finally change your expectations we'll see it in the data quickly mortgage rates have stayed higher for longer than anyone anticipated this year but maybe we're finally turning the the corner if we're lucky for buyers and sellers these
conditions can change quickly they need to hear the data from you so they know how to act so you should join us at alos research go to alos research.com and book a free consult with our team we'll we'll help you know how to talk about the data and your local market data to your buyers and sellers today there's a link in the description below to join us click that and let's get started