[MUSIC] With Power BI you can view reports, explore data and always stay up to date. Here’s a quick tour so that you can get started fast. Home is where you find your content.
If you don’t have content already, look at Shared With Me and Recommended sections to discover what’s available. If you install the Power BI mobile app, you can view any of this same content on the go. Let’s take a look at a dashboard.
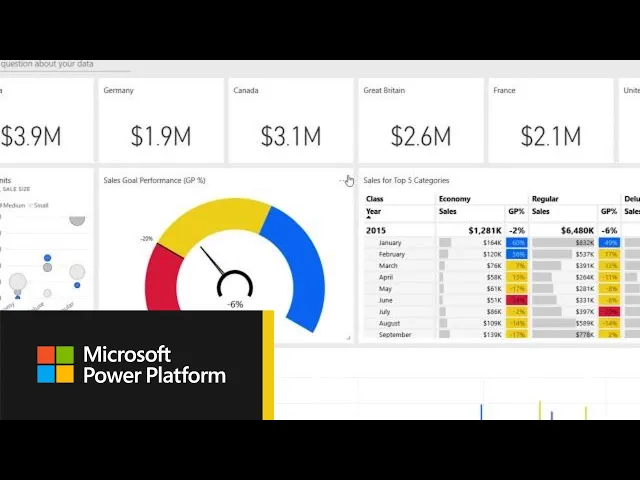
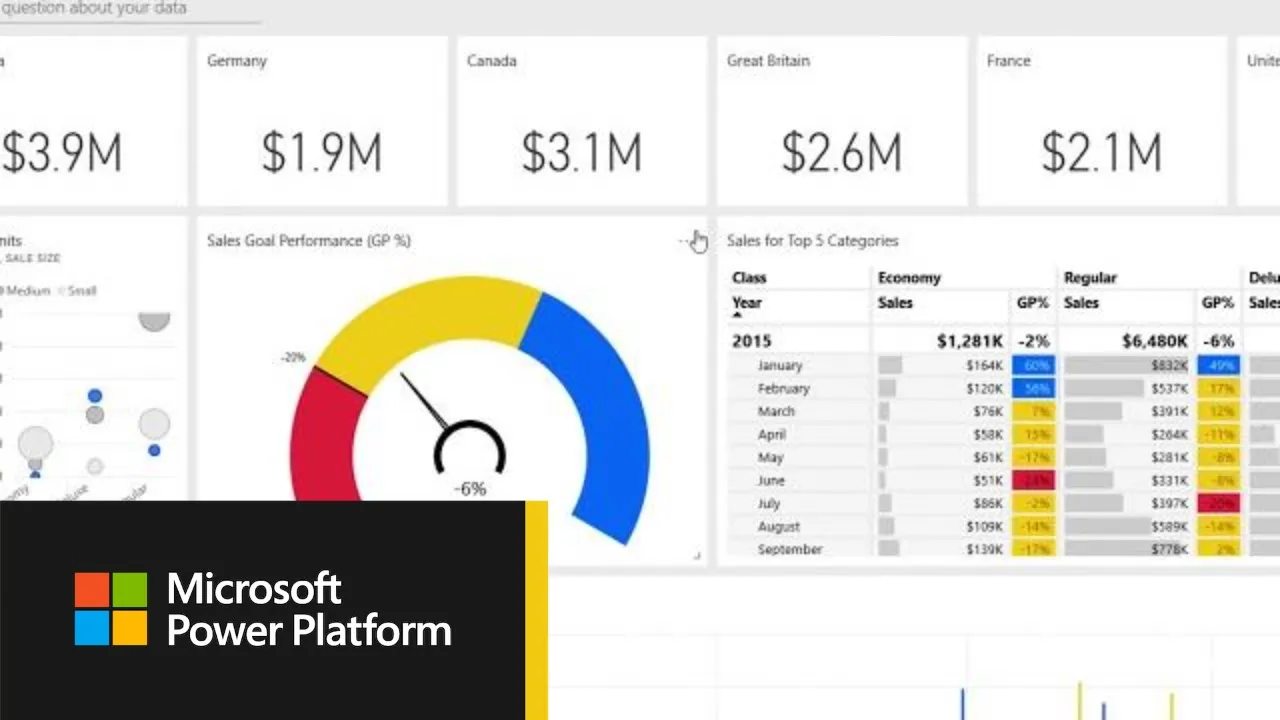
Dashboards contain data from many sources in an at a glance view organized as a series of tiles. Alerts on dashboards let you track changes to your data. Click on the ellipses for any numbered tile.
Then manage alerts to set one up. Once you specify an alert threshold, you’ll be notified by email and on your mobile device if the metric changes. If you want to ask a question, just leave a comment from any dashboard tile.
You can @mention other people to automatically notify them. While dashboards provide a summary, reports let you do detailed analysis. Click on any dashboard tile to navigate to a more detailed report.
Here, you have more tools to explore your data. Filter your view by selecting values. We’ll save these for the next time you return, but you can reset to the default view here.
Click data in visuals to highlight the impact they have on other metrics on the page. If you want to analyze the data further, you can export any report visual to Excel. Click on the ellipses, then export data.
You’ll see that summarized data includes the data from the report visual, whereas underlying data is the detailed records, in this case each sales transaction. Click subscribe to get a copy of this report in your email inbox. If you don’t have permissions to subscribe, you can always ask the data owner to subscribe you.
Lastly, you can favorite your Power BI content. It will show up at the top of home. Now, it’s time to start exploring on your own.
If you want to learn more, check out more help content at the bottom of home.