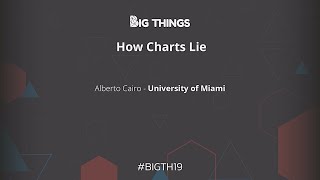
All right thanks for everybody for sticking around for our final keynote of the day I want to introduce Alberto Cairo Alberto Cairo is the director of the visualization program at the University of Miami's Center for computational Science cairo's other published Works include the functional art and introduction to information graphics and visualization in the truthful art data charts and maps For communication and how charts lie getting smarter about visual information which is set to be released the fall of this year so I'd like to give Alberto a quick hand mm-hmm all right is this microphone working
do you hear me yes okay perfect great well very happy to be here today it's an honor to talk to you about um how charts lie or better said uh perhaps that would be a better title for Both the talk and the book how we lie to ourselves with charts how we mislead ourselves so ourselves whenever we see a map a data visualization a graph of different kinds we tend to misinterpret them very very often and this is what my new book is about and what you are going to witness today is basically a trailer
for the book I'm going to give you basically the gist of the story and the many reasons why I believe that we so often misinterpret charts even those of Us who are well trained into designing charts I have been designing charts all my life all my professional professional career I began my career in Spain I'm originally from Northern Spain from a region called Galicia I began my career in journalism working for several media organizations such as El Mundo which is the second newspaper in terms of circulation in Spain at the time I used to produce
pictorial visualizations visual explanations of information like You do a 3D model of a car if there is an accident for example and you need to explain it we call those kinds of pictorial visualizations in news media infographics and later on I moved in a slightly different direction and started getting interested in data visualization the visual representation of quantitative data and that's what I'm going to be focusing on today I don't think that I tell you anything new if I say that data visualization has Experienced an explosion right in the past 20 years this has happened
in many many different Realms The Sciences business analytics obviously but also the world of news media I don't know if you follow news media on a regular basis you should everybody should I think it's a great source of inspiration but in the past 10 15 20 years all media organizations particularly newspapers and magazines have started publishing more more data visualizations every day And the reason why they are doing that is that through their analytics they are seeing that people readers really like charts whenever you put a map or a graph or a diagram inside a
story suddenly that story will become more engaging people will tend to read it more and spend more time taking a look at it and we have plenty of evidence that shows this another reason why there has been an explosion in data visualization in the past 20 years is that data Visualization is useful if I show you that if I show you a large you know quantity of data and I ask you questions based on this data it will be very it will be impossible for you to answer those questions I'm going to tell you what
this data set is about this is a large data set of global temperatures from the year 1000 to the year 2000 measure in Celsius degrees I'm from Europe we use Celsius over there um Celsius degrees in comparison to an Average the average of the years between 1961 and 1980. that's the reason why you see negative values and positive values over here so I'm going to ask you a question based on this data this is going to be an easy one have global temperatures in the past 1000 Years increased or decreased overall increased right we sort
of know that because climate scientists have discovered that they have created they have observed climate they know that Temperatures have increased in the past 1000 years if you want to answer if you didn't know the answer to that question beforehand though right yeah you won't want to answer that question through the data you will need to out you will need to open up that Excel spreadsheet and then scroll up and down to compare the first temperature record to the last temperature record which is a little bit of work right but it's feasible now let me
ask you a more difficult question has At any point in the past 1 000 years global temperatures been higher than they are right now that is a much harder question to answer only through that it will force you to again open up the spreadsheet Navigator scroll up and down read every single value and see whether any value in the past is higher than the latest value on the data set right tabular data is hard for us to understand right very very hard for us to understand it has its per purpose Though there is a reason
why we see tables so often in business analytics and in journalism which is that tables fulfill a very important purpose which is letting us letting us see specific values in the data all right that table works really well for that but what if you want to what you want to see is overall patterns and Trends in the data a table is not a good way to display this data it's much better to transform this data into some sort of chart into Some sort of graph the data that I showed you before is the data that
lies behind one of the most influential um and also I believe one of the best visualizations in the 20th century called the hockey stick chart which basically shows you that in the past 1000 Years global temperatures stayed more or less stable right they vary but they vary within a certain range and it is only at the beginning of the at the beginning of the 20th century over there That global temperatures started spiking up very very rapidly that's sort of the story that the chart reveals it is the story that hit behind the data so another
reason why charts data visualization I use those two terms interchangeably right one other reason why charts have become so popular in the past two decades is that they are useful they let us see they let us discover insights from the data that may go unnoticed otherwise some of the best Writers who have written about data visualization throughout the years for example famous statistician John Tuki said or used to say always visualize your data because if you don't visualize your data if you rely just on summary statistics alone the media and the mean the standard deviation
and so on and so forth you may miss very important features in the data if you want to analyze the data it's always good to create some sort of image based on it or A series of images right I'm not telling you anything new right anyway now I'm going to tell you something new let's talk about how visualization is built right the main principle behind data visualization which is going to be critical later on understanding how we lie to ourselves with visualizations with charts data visualization or charts is based on the idea of visual encoding
all that you do when you create a data visualization is you have just you begin With a bunch of data and then you map those data onto certain objects we call those objects geoms right if they are geometric objects such as bars circles triangles and so on and so forth and then what we do is to vary certain properties of those objects in proportion to the data that we are trying to represent those properties those features that vary in proportion to the data are called the encodings right and this is the language of Visualization this
is what the grammar of visualization is based on right the variation of certain properties of objects so we could begin with a bunch of rectangles and then we can vary the height or the length of those rectangles and we will we will end up with a with a bar graph right or we could begin with a bunch of Bubbles and then we change the area of those bubbles and the result will be a bubble chart right or we can vary the position of certain objects Over a horizontal or vertical axis and we may end up
with for example a Dot Plot or things like that right or we may vary the color right color here color shade all these are methods of encodings or also called encodings right so I'm going to put you to the test I'm going to show you a visualization and I'm going to ask you to quickly identify the encodings that you see in that visualization right these encodings try to identify which which one of these are At work in the following visualization the visualization that I'm going to show you in just a few a few seconds is
a visualization about the makeup of newsrooms of newspaper newsrooms in the United States whether in those newsrooms of major newspapers in the United States have more women or more men on staff all right that's what the visualization is going to is going to show it is based on data on the of the data from the American Association Of a newspaper edit or something like that I don't remember the source we're going to take a look at the source in just one second anyway what methods of encoding or what encodings can you see in that visualization
what is the first one that you see Q right Hue color Hue blue or red blue means more men red means more women right that's the data that is encoded zero one or one or the other right what else what other encodies do you see here Area very good I heard area over there right area the area of those circles is proportional to something right the what is proportional to sorry about that I don't know what he's making this noise I will try to move my head a little bit less and move like RoboCop here
right let's avoid making a noise anyway so uh area is encoding the size of The Newsroom right the bigger the bubble the bigger The Newsroom or the bigger The Newsroom the bigger the bubble what else Shade color shade right the more intense the color the higher the percentage of either men or women the Bluer the color more men the redder the color more women and another one there is the most important one perhaps position very good the position over the horizontal axis is also proportional to the percent of women versus the percent of men you
have the 50 50 split in the middle and then you have the bubbles that are on one side of the Visualization over there those are the neutrons that have more women than men and then the the neutrons that are over here on the left hand side are the newsrooms that have more men than women right so as you can see there's still a lot of work to be done in newspapers actually we did have a similar visualization you know newsrooms in the United States but of um journalism departments or communication departments the visualization will be
the opposite Right we will have more men than women let's use that yeah thank you okay perfect let's turn these off anyway so um to keep talking I cannot stop talking sorry I love visualization I can let me all right let's see if I can get rid of this thing I need some help over here anyway another reason why visualization has become more popular in the past Decade or so is the increasing availability of tools right where many we have many vendors out there click you have you have jumped you have you have SAS you
have top load you have power bi for Microsoft and many other vendors that produce a Tools in my daily work I use many of those tools and also many others that are open source and free you may not have heard about them but I use for example D3 sometimes I use R the r programming language I use a Tool called inside and also a tool a design tool called Adobe Illustrator anyway so if you want to learn more about any of those tools the organizers of the conference told me that they are going to make
business slides available for you later on if you want to learn about all these tools you can just go to my website there is a link to my website over there all right and I have tons of free tutorials about all these tools so tools are also another reason why Visualization is becoming more popular because many of these are either free open source or if they are not free or open source they have free versions such as Tableau for example has Tableau Public Power bi as a free version click has a free version all these
tools have a free version and I believe in most of them are very easy to learn this is a difference between the beginning of my career and the present time at the beginning of my career tools were Difficult to access they were very expensive and difficult to learn today the landscape of visualization has changed completely many of these tools are free and many of them are super super easy to learn very very easy to learn that has lowered the barrier of Entry to the world of data visualization to the world of charts and I believe
that that is wonderful because I have I have the belief that data visualization has the potential of becoming a Universal language something that anybody and everybody can take advantage of and learn and so on and so forth however and this comes the important part of the talk I also believe that tools are not enough I believe that we talk in conferences like these and many others that I present in we talk too much about how to make visualizations how to design visualizations what is the most powerful tool what is the tool that has most features
to design Visualization what is the tool that will let me create this beautiful graphic that I saw the other day in the neotimes.com right we talk too much about all those things and we talk too little about how to reason about visualization and this is a talk and the book related to it is a book also about how to reason how to think critically about visualizations and the reason why I think that this is important is that I'm a great believer in the fact that Good charts that are well understood can enable conversations but charts
that are badly designed or charts that are well designed but badly interpreted can hinder those same conversations and I love conversations all right I love talk into people and you know learning new things and I believe that charts can enhance that process or that goal throughout my career teaching visualization and doing visualization for companies and so on and so forth I Have heard many myths that I wish that people would start abandoning so I'm going to show you several of those myths or misconceptions in relationship to how we talk often about data visualization how many
times have we heard the myth a picture is worth a thousand words that's not true as I will show you in just one minute or the second one visualization is intuitive this is very very dangerous right visualizations often look so clear-cut so well done that we believe That we interpret them immediately right just in the in the blink of an eye and this can be really really dangerous I will show you examples of that later on or um the data should speak for itself right this is very very common in the business world the data
should speak for it so what data never speaks for itself you need to make it talk you need to make it confess all right you need to explain what it means all right in order To understand what what what it is that the data is hiring data never speaks for itself or this is very common in the world that I come from the world of Journalism journalism and the world of graphic design show don't tell well very often most often more often than not you need to show and tell because if you don't tell then
I cannot see what it is that you're trying to show right we call in visualization in the world of news visualization in journalism Visualization there is a feature of visualization that we tend to call The annotation layer The annotation layer is basically the title that you put in a visualization the little annotations the explainers that you put around your graphic that may put the data in context for people who don't know that much about the data that you're presenting so we need to show and tell I usually joke though that any of these myths or
misconceptions can be made true if we Append a second part of the sentence if you know how to read it a picture can be worth a thousand words if you know how to read it but often and by reading it I mean not only reading it at the grammatical level you know being able to read the axis and the Legends but also at the semantics level meaning being able to interpret the graphic correctly and more often than not we don't know how to do this and this can be dangerous let me tell you a story
Around a year ago three reporters from Reuters met with President Trump in the Oval Office they were interviewing president Trump about several issues you know the trade conflicts with China and many many other issues and at some point during the conversation according to the uh the news report that these reporters wrote president Trump handed them over copies of a certain chart copies a certain map in particular one of the reporters went to CNN the day after for An interview and he showed the printout of a chart that President Trump had given them throughout the conversation
during the conversation as you can see it's a map a chart that shows the results of the 2016 presidential election right for Republican and blue for Democratic there's a photographic record of the interview of the or taking of photograph taking by one of the reporters who attended the meeting actually a photographer not one of the Reporters with President Trump sitting on the in the Oval Office and the three printouts of the map in front of him um the map is also in the White House apparently right after the 2016 elections um several aides in the
White House printed out large copies of that chart they framed them and now apparently they hang on the walls of the of the White House at the moment uh perhaps not surprisingly president Trump has tweeted Um about the about this map a while ago there was an interchange between President Trump and several people who oppose him and several people who supported him and so on and so forth around the Texas primary election so president Trump tweeted I want to encourage all my Texas friends to participate in the Texas primary elections and so on and so
forth and someone who opposes president Trump very strongly replied to president Trump you Have no friends and then someone who supports president Trump president Trump replied to this other person who's saying basically really do you think that we don't have friends take a look at how many friends we have and we have the map in there right again red for Republican and blue for Democratic and president Trump retweeted this person saying such a beautiful map thank you well the map is really beautiful but it's also quite can Be really really misleading if you don't know
how to read it correctly um the map has also appeared on book covers right after the 2016 election author jackpot Soviet title his book the book that he published right after the election citizens for Trump and we have the map in there or again right and I like to give free advice to whoever wants to take it and I try to try to be as constructive as possible when giving feedback about visualization And when I saw post object on social media promoting his book I reply to him I say you know I think that you
either should change the title of your book or change the illustration that you have on the book cover because the title doesn't describe what the map is showing and the map is not showing what the title says because the title of your book is Citizens for and I'm gonna let me introduce something here it doesn't really matter that the book had been Called citizens for Clinton it will exactly be the same problem right the map still doesn't show citizens the map is not showing citizens the map is showing territory so perhaps a better title for
your book should be counties for Trump because the amount the amounts that are represented over here the quantities that are represented over here are not citizens remember the whole principle behind data visualization the whole principle behind data Visualization is the proportional representation of numbers to the variation of certain features of certain objects if you are talking about citizens you're talking about the popular vote therefore you should not use a map that has 80 percent of red and 20 percent of blue because that is not the percentage of people who voted for President Trump or for
candidate Clinton the a popular vote was split almost half in half it was 46 48 and those are the Numbers that you need to represent that map there's nothing wrong with it the map per se doesn't lie but we lie to ourselves with it we tend to project what we want to see onto the charts that we see every day that is the danger because indirectly that map is conveying the idea of a victory by a landslide and it was certainly a victory but it was not a landslide it was really really close the elections
were really really close all right so what to do about These right what to do with that map right that map again there's nothing wrong with it but there is something wrong with the interpretations of that map part of the problem is that we are not displaying population density right Democratic vote tends to concentrate on big cities big urban areas and the Republican vote tends to be a little bit more spread out all over the country and that map doesn't reveal that because we are coloring the entire area of all Those counties it is a
great map if the question that we want to answer is who won where if you want to answer that question that Map works really well for that but if you want to show people the amount of people who voted for each one of the candidates is not a good map for that you are misusing the map if you are using it for that my friend can feel who is a cartographer created an alternative map on this map he plotted more than 100 million dots Each one of them corresponding to a citizen who voted and then
he color-coded the citizens according to whether those people voted Republican or Democratic or voted for a third candidate and then he geolocated those dots close to where those people voted and here's where you can see population density at work large vast watts of territory in the western part of the country are basically empty that's one of the problems with the with the map Above right with the map of the county level county level vote but you know I'm I'm not as sophisticated as as can is at creating charts like that if I had to write
a book myself titled citizens for whoever doesn't really matter citizens for Clinton citizens for Trump I think that it will stick to just a simple bar graph right just a simple bar graph does the job right the bar graph shows you number of people who voted for one candidate number of people who voted for The other candidate and then the number of people who voted for a third candidate however this also is not a good visualization for a book title citizens for Clinton or citizens for Trump why well not all citizens vote how many people
didn't vote in the election that percentage is actually really really high when you take it into consideration you may entertain the idea of changing your title for Citizens for nobody because the 40 percent of Possible citizens who could have voted didn't even vote actually the two major candidates Clinton and Trump receive around one-third close to one-third of the of the possible votes right we could argue that these 40 percent of people if they could have voted would have voted either or for Trump or for Clinton but the fact is that they didn't vote and that's
a large the larger group of people right so again if we want to title my book citizens for whoever I Would use that kind of chart or these kinds of charts because they better depict What My Title says citizens not territory now let let's go back to the map that hangs on the walls of the White House right let's suppose that I run I run for president this is not possible I was born in Spain so I cannot run for president I can run for Congress though right which is a good career plan in case
of visualization doesn't work out but Anyway just for the sake of argument let's suppose that I run for president and I win an election I become president Cairo of the United States and I want to celebrate my victory with a map with a chart because I love charts right and I love Maps so I want a map on my white house right I would not use any of those because none of those captures what really matters to win a presidential election in the United States to win a presidential election the county level Vote is not
that important the popular vote is important but it's secondary and certainly the amount of territory that you control is not that important what really matters to win a presidential election in the United States the metric that is crucial to winning a presidential election is the electoral vote so that's the map that I will put on the walls of my White House some sort of combination of charts and maps that show the electoral vote the electoral Vote right how many voted how many electors voted for one candidate how many election voted for the other candidate and
then two maps one of them showing the results at the national level because whoever wins a plurality in a state gets all the electoral votes of that state in theory there are always exceptions but in theory it works that way and there are a couple of exceptions for example main device the electoral votes sort of proportionally according To the popular vote and then another map called a car a cartogram the one there on the right that distorts the areas of the states according to the number of electoral votes that this States contribute to the election
this is a much better chart if you want to celebrate a victory I believe as a presidential candidate regardless of who you are President Cairo president Trump or President Clinton right now what is the problem here well we are facing this I think that examples like this reveal that we are facing several challenges that may hinder our ability of reading charts the first one of them we could call it patternicity right we human beings evolve to detect patterns in things that we see right whenever we see data depicted visually those data repeated as a chart
reveal certain patterns we have all to see patterns in the Landscapes that are in front of our eyes every day that's super useful but Sometimes detecting those patterns particularly we assign meanings to those patterns can be a social is dangerous can be really really misleading right we see a patterns who want a partner who won't wear and then we project what we want to believe onto that pattern that's patternicity at work how to put patternicity under control well if we become more visually literate right there's a word for visual literacy called graphicassee and one of
the Challenges that we face I believe as a society is egrficacy right like illiteracy but for visual objects cartographer Mark momonier who has a wonderful book called mapping it out he has several books but he has one called how to lie with maps which is absolutely wonderful but he has this book called mapping it out in which he says that today in order to consider ourselves educated citizens in a Democratic Republic we need to have much more than Literacy which is the ability to read and write we also need the ability to express ourselves verbally
and we call that articulacy we also need to have some sort of skill to think numerically and scientifically and the word for that is numeracy which doesn't really equate statistics it's related to statistics is related to mathematics but it's not a statistics alone numeracy will be like a sixth sense in the back of your brain that you can develop and train that will Ring whenever you see a number or a chart that looks dubious you take a look at it and say there is something fishy about these I don't know what it is but it
looks strange okay and then that prompts you to dig deeper into that chart and see what's going on you take a look at the source you take a look at the methodology and so on and so forth but numerous is basically that alarm that Rings inside your brain whenever you see something that don't work Doesn't work really well and then finally graphic AC which is the ability to read Graphics correctly those Graphics that depict data now many Graphics that we believe that we read correctly we really don't let me show you an example living in
Miami I see this graphic every single year every single year right this is a map showing where are a certain tropical storm or a certain hurricane could go by the way this is not photoshopped last year there Was a tropical storm called Alberto and this is a real coincidence I was writing the chapter about this this kind of map in the very same days when tropical storm Alberto was approaching the southern part of the United States and some people some friends of mine from the University of Miami who knew that I was working on this
chapter it started sending me quotes from The National Hurricane Center related to Tropical Storm Alberto coping and pasting right a Piece of pieces of text from those news reports my favorite one is Alberto is not very well organized this morning this is the language that we use to refer to hurricanes in South Florida right if a hurricane is very dense and very powerful we say that it's very well organized if it is more dispersed we say that it's disorganized not very well organized well anyway everybody believes that he or she or that we can read
this Map well let me tell you nobody reads this map well including many scientists however and regardless nevertheless this map is still used by news media news media gets this map that cone and they adapted that make it more beautiful more flashy they are 3D up through the effects to it and shades and highlights and so on and so forth but the problem is that and this has been shown through experimental evidence the problem is that when people when not everybody but When many people see that cone what they see is a possible area under
threat experimental evidence shows evidence shows that when people see that cone approaching the United States what they see is a storm growing in size right possible area that may be affected by The Winds of this storm and there is a very good reason for these right because there is a pictorial resemblance between the shape of the cone and the shape of a hurricane which is a circular object so People are making sort of an inference that makes sense people are not stupid the problem is that we are not explaining well how to read this map
man you don't see many hurricanes over here but I'm going to explain to you how to read this mapping is that you ever entertain the possibility of moving to Florida or when you retire for example right you can come visit me and we can have coffee when you retire anyway so how to read this map right this is how To read this map in order to understand how to read this map I need to explain to you how the map is created first of all the National Hurricane Center collects models forecasts created by different agencies
right and we can imagine those models as tons of lines the center of the hurricane could go here could go here could go here could go there those lines represents the possible path of the center of the storm then the National Hurricane Center picks The path that they believe that is most likely right the one that they estimate that is going to be the most probable path of this storm right and they pinpoint the par the most probable position of the center of the storm in the following X days usually five here here here and
here and then around those points they draw Circles of increase in size those circles represent the level of uncertainty of that forecast this is all based on past Mistakes or successes at predicting the path of Storms and obviously the circle grows in size because it is easier to predict what is going to happen tomorrow than it is to predict what is going to happen five days from now that's the reason this circle increases in size and then what they do is basically trace a line that connects all those circles then they erase those circles and
the result is that cone that obviously is called the cone of uncertainty the cone Of uncertainty although people in Florida call it the cone of death if you're inside a cone you are under danger but that is not how to read it so how to interpret this map or if you are a graphicad person and I am increasing your level of graphic acid now I'm explaining to you show don't tell well I need to tell to explain how to read this graphic in order to understand it for you to understand it correctly whenever you see
that cone what you need to Envision is tons of possible lines of centers of the storm it could go here it could go here it could go here it could go there but on top of that you also need to Overlay the likely size of the storm how big the storm is so you need to do something like that on your brain you need to basically imagine how big the storm is and then overlay the size of the storm over the lines that shows you where the storm could go this is how most scientists and
people who know how To read the map read the map right but this is still wrong why is he wrong well the first time that I saw the cone of uncertainty I asked myself does the cone really contain all forecasts that have been made 100 of possible Paths of the storm and my answer to that question was not that right my assumption the first time that I saw the cone of uncertainty was that whether scientists climate scientists were telling me 95 of the time that we see a storm a tropical Storm Alberto the path of
the storm will be within the boundaries of the cone of uncertainty you will be inside of the cone but sometimes we may experience a freak storm a strange case in which the storm will go outside the boundaries of the cone of uncertainty why did I make this assumption well the remember stats 101 right I remember P values and all that crap and I wrote 95 5 right this is how most scientists read this map but it is still wrong because if you if you Read the fine print if you read how to read the map
which is a section in the National Hurricane Center's website they will tell you that the cone doesn't contain 95 out of 100 possible parts of the storm it only contains two out of three why is these surprising or worrying because basically they are telling you one out of three times that we experience a storm like tropical storm Alberto the path of the storm will be Outside the boundaries of the cone and one out of three it doesn't sound like much but it's a lot it's a very high probability I mean the probability of President Trump's
winning the election in 2016 was 33 percent according to 538 and he won so that's a very high probability so when we see the cone of uncertainty what we need to educate ourselves in doing is to not to Envision a cone but to Envision a Spanish fan something that is much wider we can do This mentally and then on top of that we need to Overlay right the possible size of the storm to get basically an estimate of which areas may be under thread of wind because of this storm take a look at how long
it took me to understand how to read this map right so Maps charts graphs visualizations need to be explained to people now if you explain it correctly the next time that a reader someone in South Florida that experiences hurricanes every year next Time that that reader sees that cone she or he will be able to interpret correctly just because you have explained it to them this is why it's so important to never assume that a visualization is intuitive other visualization is self-explanatory or that data speaks for itself that it never speaks for itself another problem
that may hinder our interpretation of data is our fear of complexity this is very very common in The world that I come from the world of Journalism in the world of Journalism if you ask journalists to describe what journalism journalism consists of they will explain to you what Public Service providing information but one of the things that they will tell you that my role is to simplify information because the world is so complex my my goal is to simplify information for readers I don't like to use the word or the verb to simplify I think
that the verb to Simplify can be really really dangerous I prefer to use the verb to clarify because when we talk about simplification that will bias our process when creating a visualization to always try to minimize the amount of data that we present and that's a worthy goal sometimes that's the right thing to do but sometimes we may go too far we may discard too much data that may be incredibly important to understanding what's going on sometimes we need not to Decrease the amount of data that we show we need to increase the amount of
data that we show not to simplify but to clarify a story that's a simplification there is nothing wrong with that chart again this this is geometrically speaking mathematically speaking design wise there is nothing wrong with this chart this is the chart that is showing murder rates per 100 000 people in the United States we have all heard the story in the 80s the murder rate in the United States increased very dramatically then it went down during the 90s stayed more or less the same during the 2000s and then in the past two or three years
the murder rate has started increasing again if you prolong this line if you extend this line a little bit further closer to the present the line continues increasing that's an important conversation remember what I said before charts can enable conversations right we need to have a Conversation about that what's going on how we do we address this problem right the fact that the murder rate is increasing well I can tell you that these charges are enough because it's a simplification why well I live in Miami South Miami in my neighborhood there has been one murder
in the past six or seven years that means that my neighborhood if I could plot in that chart it will be close to the Baseline and most places in the United States more cities Morris neighborhoods most towns are very very safe I lived in Brazil I know what dangerous means right for a few years I lived in Brazil but anyway the the problem with this chart is that if you see it on its own and you don't you're not able to go beyond the chart what this chart is indirectly telling you is that the United
States is becoming a more dangerous country and that is not true that is not true because most Places are down there if we could plot every single town city according to statisticians who work with crime statistics if we can plot every single place in the United States most places will be down there what is the problem outliers there are certain places in the United States that in the past five six years or so have become so dangerous so so dangerous so violent that if we try to plot them on the chart they will go through
the roof they will go off the Scale right way off scale to the sky those things those outliers are distorting the National rate therefore if we want to have a conversation about how to address the problem of murders or violent crime in general in the United States we need to go beyond what the original chart was showing the chart alone was a simplification the chart plus that explanation is a clarification because once you know that you will be able to Target those specific places not To try to evenly distribute your resources all over the United
States so never try to simplify always try to clarify always try to think about what is the right level of granularity that I need to present in order to tell a compelling but also truthful story there are several overall levels at which we can present data right we can use the summary statistics alone or we can visualize more and more data we need to find what is the right level of detail That we need to tell a story and certainly the original graphic here was not the right level of detail because we need to know
about this fact it is critical to understanding what's going on related to the fear of complexity I could also talk about the problem with uncertainty right we journalists we don't like uncertainty we never show uncertainty and this could be a problem in many cases in many many different cases back in 2014 El Pais which is the SEC the first the most important newspaper in Spain published that headline saying that Catalan public opinions swings towards no to Independence a little bit of backstory there is a region in Spain called Catalonia there has been an independence movement
over there right half of the population is in favor to Independence Catalonia becoming an independent country and the other half of Catalonia once Catalina to remain Being part of Spain right that's an ongoing debate the thing is that the catalonian government conducts a survey every year and they ask catalonians many questions one of them is do you want Catalonia to be an independent country or do you want catalani to remain as part of Spain right they asked that question every year and El Pais was titling the no to Independence is bigger than the yes to
Independence according to this survey is that true well let's Take a look at the data it seems that it's true right the percent of people who say no to Independence is 45 percent and the people who say yes to Independence is 44 point something and then we have people who are undecided but it seems to be true that no to Independence is bigger than yesterday dependence unless that you redefine print the reporter who wrote this story you know for El Pais wrote in one of the paragraphs of the story the margin of Error of this
poll is three percentage point a relevant fact considering how close the yes and they know are in the survey well that's sort of an insult right because it's basically telling you this is all crap right I I said how is this even possible you're telling me that yours your headline is completely wrong right because of course it is a relevant fact it is so relevant that I would say being sort of a wary careful journalist I Would say that you cannot claim that the no is bigger than the yes or that the yes is bigger
than the no what you can say and Save in the safe zone is that they are tied just because the distance between them could be due just to You Know sample error for example because the confidence interval is so wide so so wide what is the challenge the challenge is that we never in journalism in journalism in particular we rarely consider uncertainty when visualizing Our data and sometimes uncertainty is really important if the no one that yes where 85 15 then the margin of error will not be that important but when they know and the
yes are so close to each other and moreover when you have 10 of people who have no opinion that also adds to the uncertainty you need to disclose the uncertainty you need to discuss it and you need to basically Curb Your impulses you know for uh for an eye-catching headline you cannot Claim that one is bigger than the other all that you can say I would say is that they seem to be tied there are different methods to visualize uncertainty and we need to explore them a little bit more or at least we need to
discuss it particularly particularly when the presence of uncertainty may change our interpretation of the data completely like in this particular case Challenge number five out of seven in terms of misinterpreting charts or that May hinder the interpretation of charges how much we like to see our opinions being confirmed right we like we we call this cognitive scientists call this the confirmation bias there's a growing literature in cognitive science talking about talking about these yeah we have the famous Thinking Fast and Slow which is a great a great book and we also have this one this
is one of my favorites this is one of my favorite introductions to cognitive bias cognitive biases ever Published I greatly recommend it right mistakes who are made but not by me I never made mistakes we all believe that right we all believe that and we are wrong we all make mistakes obviously and we all tend to project what we want to believe onto the charts that we see every day let me show you an example let's suppose just for the sake of argument that any of you one of you is a heavy smoker I have
a heavy cigarette smoker you smoke like 40 cigarettes Every day and your family you have grown tired exhausted of hearing your family tell you you need to stop smoking because smoking is going to kill you is going to shorten your life and you say but I really like smoking I want to keep smoking right I want to find a justification to keep smoking you're telling yourself right and suddenly one day Professor Alberto Cairo from the University of Miami shows you a chart that that shows that this place that Proves that smoking is great for your
health take a look at that that chart is showing that there is a positive quite a strong association between cigarette consumption and life expectancy and if you are a layer reader not training data science or statistics or science in general the way that you will read this chart is the more cigarettes I smoke the longer my life expectancy will be that's the way that we all tend to read this kind of chart and let me tell you one of The things that worry me the most about reading charts correctly is that way that we verbalize
them the way that we describe the content of a chart right I have made this mistake myself describing charts like this as more cigarettes more life expectancy that is not the right way to describe the content of this chart all this chart is showing is that and this is the right way to verbalize it at the national level there is a positive Association I would not say Correlation because the relationship is not entirely linear but a positive association between cigarette consumption and life expectancy but that doesn't mean that more cigarettes lead to more life expectancy
obviously right why not because we are not considering the role of you know unknown variables right for example wealth right perhaps the wealthier a country is the more cigarettes people tend to consume in those countries but also the more money Those same people can invest in Better Health Care and in better diet all right so the bad effects of smoking are awake are balanced out by Better Health Care and better diets and more exercise Etc on a safer environment right it so perhaps that relationship is related to wealth only right how do we prove that
well if we desegregate the data we may start seeing that this relationship completely disappears because this is an example of what statisticians like to Call an amalgamation Paradox or Simpsons Paradox an association that you will see at a certain level of aggregation may disappear or completely reverse when you start disaggregating the data at lower levels right so it's related to that amalgamation Paradox and it is also related to a very very very important fallacy right that we all commit all of us commit call the ecological fallacy the ecological fallacy basically and simply Put says that
you cannot make an inference at a certain level of aggregation or you should be very careful of doing that making an inference at a certain level of aggregation when you take a look at data that is segregated a completely different level you are trying to make an inference at the individual level is cigarette consumption good for me but you are taking a look at the data at the national level and that may not be true Because once we start disaggregating the data I'm going to start color coding these countries according to uh wealth and I'm
going to separate them I'm going to create three Scatter Plots instead of one for each one of these income groups their relationship basically disappears it's gone the association is much weaker and I'm pretty sure that if we could disaggregate data more and more at the local level Regional level neighborhood level and so on and so forth the the Relationship will start reversing and I know that because if we go to the individual level person by person we have good evidence that shows that smoking is really bad right this is a survival curve chart that shows
that people who don't smoke tend to live much longer than people who smoke this is the right level of aggregation if you want to make an inference that applies to you not to the country where you live right but still if you're a smoker you may Feel tempted to use this chart to basically show to your family and say stop bugging me smoking is good for me why do we do that because we all love to rationalize this same literature on cognitive science shows that the human brain it seems didn't evolve to reason right we
didn't evolve to discover how the world works we need to train ourselves to do that what we did evolve for is to basically confirm our existing opinions And then learn how to argue our opinions in front of others how to persuade other people that our opinions are right so we can attract them to our own tribe and that is called rationalization if you want to learn about that there is a wonderful wonderful book title the Enigma of Reason which should have been titled the Enigma rationalization because it's all about rationalization I also discusses a little
bit how we can curb that impulse how we can not always Because it is impossible to do this always but more and more try to curb our impulse our liked him for rationalizations and transform that into an Impulse for reason about the information that we see every day let me show you a chart that was used to rationalize an opinion a while ago I witnessed a debate about the Affordable Care Act Right the Affordable Care Act was passed a number of years ago conservatives don't like it liberals Love it and so on and so forth
there has been an ongoing debate right liberals say that and progressives say that the Affordable Care Act is great because more people can have health care they also say that the the Affordable Care Act is great for the job market because it helps people become Freelancers or etc etc uh conservatives on the other hand say that the Affordable Care Act is really bad because it burdens companies it hinders the ability of companies Hiring more people by forcing them to provide more health care and so on and so forth I don't have an opinion I don't
have enough information to have an opinion and I don't care what you think about the Affordable Care Act that's besides the point however I once saw several liberal commentators using this chart to prove that the Affordable Care Act is great for the job market it because they were saying well if you take a look at the number of jobs Creating the private economy that number of jobs plunged during the economic crisis and then it started increasing and if we could extend this line further the number of jobs created has kept increasing and increasing increasing that's
great news and they said take a look at what happened over here very close to where the curve is changing direction the Affordable Care Act was passed implying that Affordable Care Act has had something to do with the change Of direction of the curve or that it was not hindering the ability of companies to hire more and more people here is a rule of thumb that we all need to basically I don't know I would say tattoo on our arms and always keep it over here which is a chart shows only what it shows and
nothing else everything that you see on everything else that you see on a chart is not on the chart itself it happens in your brain you're projecting the chart is Only showing you that there is a coin sort of a coincidence in time between the change of direction of the curve and the passing of Obamacare but if you try to reason instead of rationalize you may think about possible alternative explanations to these facts to the change of direction for example I could say you know President Obama passed the stimulus package in February 2009 and then
perhaps those billions of dollars that got injected in the private Market Push companies to start hiring more rapidly and that's what actually explains the change of direction of the curve I don't know I'm not an economist but that's a possible explanation moreover we could train ourselves to think a little bit more more about counterfactuals alternative scenarios what would have happened if Obamacare was never passed what about the Affordable Care Act had never been approved or had gotten killed by the Supreme Court which was a possibility at the time how would that curve look like would
it look like that meaning that the Affordable Care has no influence whatsoever on hiring right because the the affordable car will Affordable Care Act will not be there or would it look like that meaning that the Affordable Care Act does have a negative influence over companies because the Curve will look much steeper going up right or would therefore would the curve look Like that meaning that the Affordable Care Act has a good influence on the job market we don't know because the chart shows only what it shows and nothing else this example leads me to
the last challenge that I believe that is critical to creating a better informational environment let me tell you let me disclose a little bit about these I am the kind of person who would retweet or post on Facebook the original chart mindlessly why because I like the Affordable Care Act I'm from Spain we have socialized medicine and it works really well over there it's cheaper It's very effective than the United States at least in my opinion in my experience so I'm the kind of person who sees that charge and says a person's claiming that the
affordable career Care Act is great for the job market and if I If I Didn't Know Better Or if I didn't think twice I will retweet that and I will put that in on Facebook we need to curb that impulse Regardless of what our ideological orientation is because we all have a moral responsibility to create better informational environments in the past few years there has been an increase in the literature about critical thinking a numerical thinking there has been several books being published in the past few years about how to think better about data right
we have bad science by Bengal Baker which is a wonderful introduction to statistical thinking we Have how not to be wrong which is written by a mathematician great introduction to mathematics or mathematical reasoning we have negative statistics which is a great introduction to Stats without formulas yes the conceptual level of stats we see all these books coming out on a regular basis they are all wonderful but I believe that they lack two very important things first of all they rarely address charts which is a great Opportunity for me because I have my own Niche right
and my own book well basically fit in there somehow but that's not the most important thing the most important thing is that they don't address the ethical Dimension and here's what I mean stats science math charts they are tools if there is something that distinguishes the human species from other animal species is not our ability to speak or to write because Writing language is a tool what distinguishes us from other animal species is our ability to develop cognitive tools that expand our knowledge that expand our vision that expand our intelligence we create those conceptual tools
on a regular basis the scientific method or the methods that's a tool it's a tool that basically help us guide our intuitions and put our intuitions under control statistics is also that kind of tool as an extension Of that charts the world that I deal with every single day they are also tools and those tools are not that different to a hammer a hammer is a tool right that can be used for good and for real it can be used to build things it can be used to build housing can be used to build you
know shelter for the poor and so on and so forth but the exact same the same way by the way that a chart can be used to build understanding but the exact same tool the exact same Method can also be used for the opposite purpose it can be used to destroy houses or to destroy shelters the same way that charts if they are misused or charged if they are misread they can also be used to destroy understanding and we all have a responsibility not this to avoid this to happen there is a shared responsibility I
believe to try to create better informational environments there's a great need in this country and also in other countries that I'm Familiar with to do these to try to create better informational environments you I have a responsibility as creators of tools right we have the responsibility to create charts that enable conversations and not charge that hinder or destroy those conversations and this is usually contemplated in the literature about stats math etc etc what is not discussed though is the responsibility on the part of the reader and this is the whole reason why I said Before
this Affordable Care Act chart is the kind of thing that I would Retreat mindlessly I am a reader I have a responsibility not to do that I have a responsibility to take a second look at the chart take a look at the data you know think about the data before I post it in social media and not yielding to my impulse to put online to share with my network and my community things that confirm my own opinion just because I confirmed my own opinion there is also Responsibility on the part of readers right to think
twice about what it is that we see and what it is that we are going to share over our networks because again we all have a responsibility I believe to create a better society and a more informed citizenry thank you so much