Okay guys welcome to a new series ICT scout sniper field training guide okay let's look at what we're gonna be covering in this presentation we're gonna be reviewing the previous episodes assignment price reactions and we're gonna be looking at examples of pricing price reactions we're going to go over a brief overview of smart money concepts and we're gonna be looking at interest rates time frames range trend and power Three okay we're going to be revealing the market maker okay we're gonna be looking at the ICT market maker by model and we're looking at how dealers
operate in support levels and we're gonna look into ICT market maker cell model and how dealers operate in resistance levels we're gonna be looking at how market maker business model works in application can we looking at understanding how market maker pairs orders and how orders stack around key Levels okay we're looking at exposing the mechanics of a price swing and we're gonna look at more of the time and especially working around the ICT kill zones and we're gonna be looking at the London kill zone specifically and the New York kill zone we're gonna be looking
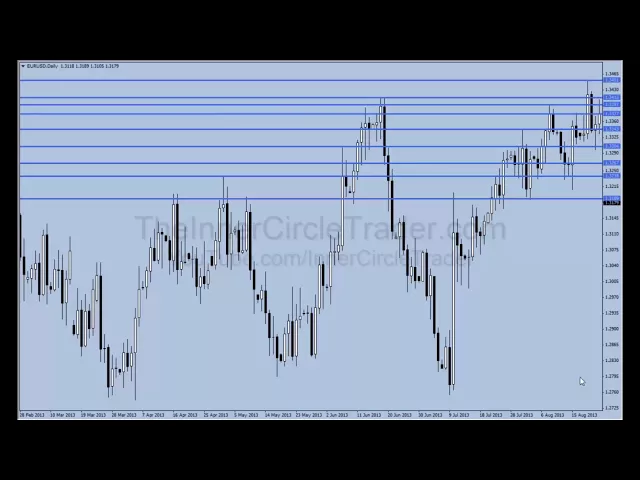
at how price is crucial to you and as far as knowing your key levels and how you setting up your opportunities to trade and we're gonna be giving you a homework assignment Stalking in the kill zone okay folks we are looking at the euro/usd this daily chart and when we're looking at reaction levels okay the ones I'm most interested in are obviously found in the higher time frames now you can go back to in monthly you can go back to a weekly chart and look for these types of levels as well but for the sake
of this teaching series we're just going to focus on the intermediate-term market and That's gonna be divided at the daily and for our and by hunting the reaction levels on this higher time frame daily chart and/or the 4-hour chart it really puts the odds in your favor based on the fact that the institutional level traders that beats the bank's the large funds and such they are really watching these key levels now we discuss in the first two episodes how we can look at support resistance and have you know high odds key resistance levels now We're
gonna build on that in this episode here but for now while we're looking at this I want to remind you that the last episode we talked about the fiber being poised to trade lower okay now I purposely waited a little while not as long as I did but the third episode out but one of the wait a little while to allow the market to move lower based on that real-time if you want to call it that in the recording that's time and date stamped on YouTube the the Fiber was called to go lower now we're
gonna frame why that was the case now okay but I want to reiterate the fact that it was called lower beforehand okay so the concepts we're gonna employ and go over in this example are gonna be beneficial to you going forward because it's the same type of thing you do over and over never again just you know and on your own particular pair or it could be a stock market you know stock or commodity whatever it is Whatever vehicle or ask that class that you find yourself a traitor in we're delving and specifically the FX
market here in this series but it's important you understand that my concepts are generic okay and when I say generic that means they're not boring in the sense that they're not useful they're generic in the sense that they're universal okay they apply to every asset class minor little nuances that have to be taken into consideration but nonetheless they Are applicable to every market that class so the homework assignment was to look for reaction levels okay mark them up on your chart and then watch what happens in the coming weeks around those particular price levels okay
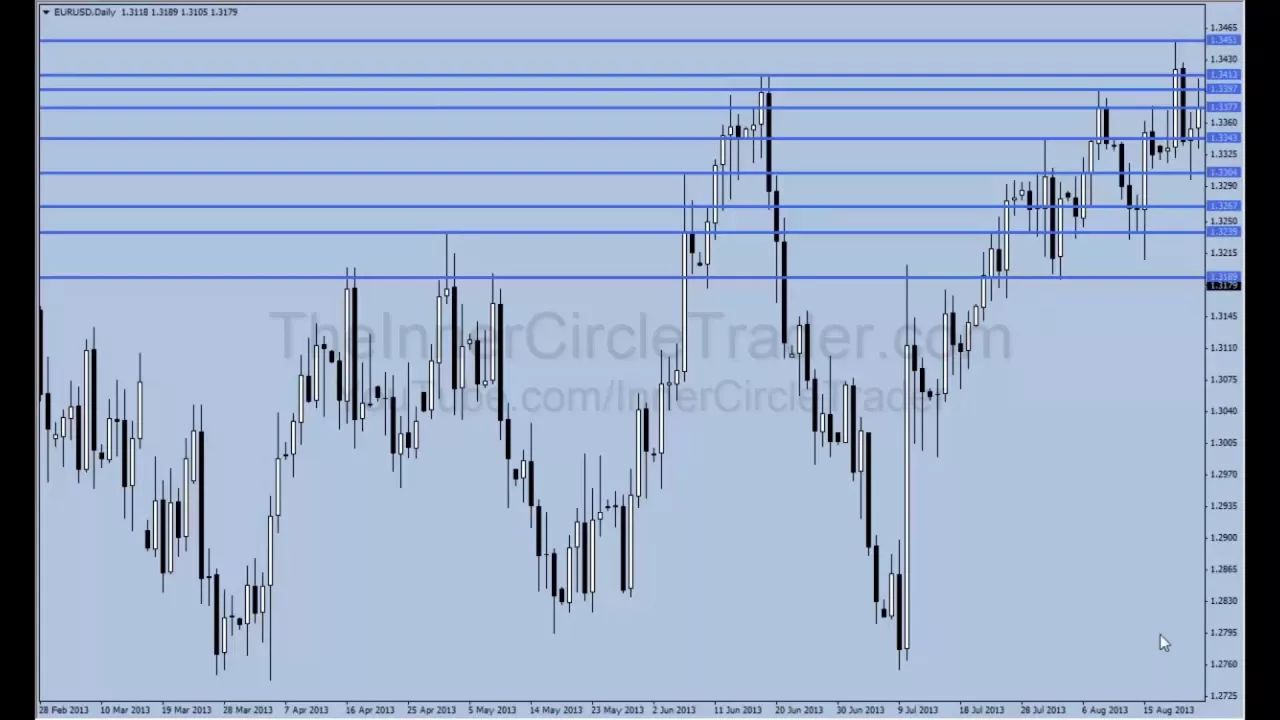
and we're gonna do that now now I'm not gonna beat it to death in terms of what reaction levels and what support misses levels we should have noted in our chart but if we were looking at this example here and this was real time and The time if you sitting down in front of the charts or when I would be sitting in front of the charts this is how I would mark up my charts okay and we're just going to use the full horizontal line just to save time because I spent a lot of time
monkeying around with adjusting the the app the right end of a trendline now I do like the trend lines because it makes it neater when I'm drawing horizontal support resistance now I don't like trend lines on a diagonal Basis so don't get me miss quoted here I do not have faith in diagonal support resistance but I do have absolute faith and horizontal support resistance as we have here now what I'm doing is I'm noting every swing high and swing low that's relatively close we're gonna use about 300 to 400 pip range from where we're trading
at in this instance here now obviously you can see at the time of this recording the price is already down here but again I'm gonna count you to go Back to the recording and you'll know by watching it that we called this market going lower here okay so we have this reaction high here okay when I was swing high now what I'm noting again so you don't lose lose yourself amongst my banter here I'm looking at times where candles have to higher candles on both sides okay not to higher on each side but to higher
candles on one side in other words you have a candle with a higher low and on the left and a higher Low on the right okay and it and I'm 20 it does probably is it's probably confusing it's not what I'm showing you here but this is a sudden a candle so you got to take that in consideration and blend that into this Monday so you do have the the swing low here basing this Monday candle and this Thursday candle here and this is a Friday candle so you have that swing low okay so we'll
have that noted okay and We're gonna use this high here okay and you see this one here now I realize you're probably starting to think well way base is getting really busy here okay but what I want to draw your attention to is the fact that we do have these levels turning the market on a daily timeframe okay so if the market made its daily higher Lothair okay it's significant okay now this is a moment when you pull out your pad major reaction levels okay occur around annual Highs and lows that means yearly high and
low quarterly your high and low in other words every three months okay for instance January February March in that block of time calendar basis okay find the highest high and high school I'm sorry the highest high and lowest low in that timeframe do the same thing for the second quarter okay that being April May June and then July August September and October November December so there's there's four quarters in blocks of three Okay cuz there's a quarterly shuffle that goes on okay portfolio dressing and such and you'll be able to see significant highs and lows
we're not gonna do that here it's this series isn't meant for you to get your sleeves rolled up and do some homework on your own okay and you're gonna learn by doing it okay I'm leading you to the water but it's up to you to drink okay you also have monthly highs and lows those are key important reactionary levels okay And then you have weekly highs and lows and you have intro week highs and lows okay so in other words once you get to like Wednesday whatever the highest high and low is low was at
that time influential okay and then you have your standard daily highs and lows okay and here is one of the gold nuggets that you're going to get okay whenever you see a swing high okay a swing high like this okay we have a candle here with a lower hide candle On the right of it and a lower hide candle on the left of it okay this pattern is very very strong and the reason why it's so strong is because you have to take a couple elements out of that pattern okay and we're going to start
with the first candle here this candle on the left of the swing high okay you want to note the high the open the low and the close on this candle you want to do the same thing for the highest candle in the three bar pattern And you want to do the same thing to open high low close values on that same basis okay and whenever you see a swing high on your daily timeframe you really really want to have those data points now essentially we have the high here with this horizontal line and we essentially
have the open we're here with this line okay but it was based on this candle here now we have to have the low I'm sorry the low here note it as well okay you can see that happening Right there now I'm balling it true but we can go down and doctor it up when we get down to the lower timeframes but here's what I want just just by clicking that like I did here I want you to take a look at what happens over here in these candles see the bodies they were having difficulty closing
and opening far beyond that level okay something about these levels okay causes the marketplace to turn okay we're going to talk more specifically About that phenomenon okay and another SmartMoney concept applied to where markets tented to blast off and have you a trade opportunity presented to you you can see things in advance based on what I'm going to share in this episode here but I want to show you how sensitive these levels are and then obviously because we have this market open on this candle here if you go over here look with you debt and
you have a bounce right off of that obviously we Can see that the the close of that candle and that swing high we were opening essentially near that same point went in lower the candle here was unable to make much move higher we got fell short of it here the body of the candle here as well okay so there's a lot of insight that it's dreamed by doing these exercises but it's also a daily procedure okay but here's the cool thing once you have these levels noted okay These when they're when they're a lot of
them like you see here this is when you take your data and you write it down your pad okay and that way when price trades to these levels okay or approaches these levels you'll have that in - okay look use as a reactionary level based on a daily timeframe so that way you don't have to have all these lines on your chart okay so we're going to just want to take our chart and we're going to drill down to a four-hour basis Okay and we're going to be just simply looking at the the market from
the standpoint of August 23rd okay I want to do was I've just moved the fixed chart position and just a little difficult to see here but I will show you all that when I talk about setting up templates for mp4 and how you can maneuver around so we run into a 4-hour chart okay and here we are we're essentially with these same levels noted we move down into a four hour basis okay And what I'm gonna just gonna do is on the scrub forward a little bit okay and right about here is where we were
talking about how the market was poised to trade lower and I'll promise I'll get to the point of which we're gonna explain why is gonna go lower but for now I just want to just illustrate how the market eventually traded with these levels okay now these levels were based on key reaction levels on a daily time frame before the facts in other ways We're gonna basically establish a point of which we'll delineate that with a vertical line here let us say beginning here you know we were expecting to our cue lower and we're gonna start
watching and there's going to study how price reacted to these levels going forward okay and really what you're doing is you're you're looking at how price moved reacted traded down to and up to resistance and support how price worked Specific levels broke down found support at it and then broke lower and moved around and gyrate it okay now these levels are just simply established off of the daily time frame now when you move to a four-hour okay like we learned in the previous two episodes when you break your market down from a daily to a
four-hour the four hours gonna have more dynamic support resistance levels that were not as clearly discernible as were on a daily chart okay so this level here Okay you would have on your chart as well and you can see the priests reactions from theirs as well and you have this swing low one could have that on your chart as well and you can see how price reacted around that as well okay and now what we're going to do is we're going to move to a fifteen minute basis and we're going to look at last week's
trading okay this is last week trading the euro USD is a 15-minute timeframe no we're Gonna do is going to put two vertical lines in delineating the actual days you have Mondays trading here Tuesdays trading here Wednesday Thursday and then Friday down here now we again we're calling the market lower and you can see the market did in fact trade lower we're going to be looking at how price reacted intra week okay but we're going to talk about some things that haven't really been touched on if you've been finally for a while in great detail
Okay so now what we're gonna do is we're gonna be discussing the have a market itself we're gonna zoom out just one more tap just you can get a feel for what has happened the market traded lower up in these levels here where we were calling it lower and broke down rather aggressively okay so you can see much more dynamic view of how price had respected these support resistance lines that we arrived at on a daily timeframe okay so now obviously we can see in Hindsight that it caused the market to turn at resistance and
support and once the support was broken event situated back to it found that as resistance okay we understand their central tenants to the marketplace and how technical analysis is generally proceeded and or viewed in hindsight basis okay but how do we use these levels going forward okay well number one unless you have these types of price points okay or support resistance levels on a hard time Frame there's absolutely zero reason to expect a trade to form okay again here's one of those night notepad moments okay write this down and underline it several times you do
not look for trade or trading pattern on your intraday charts unless it is trading at a higher time frame support resistance level okay or at a higher time frame reaction level that means the trade has to be formulated and framed around a level that you had already arrived at from the Daily and/or four hour time frame okay now here's a question for you and you already know the answer to this I'm sure so again I'm not trying to browbeat anyone but I'm telling you I've done the same stuff so hopefully you'll learn from it like
I did and you'll you'll stop the bleeding and you'll start moving towards consistency so now looking at your own personal trading how many times daily weekly in the last few months or so how many times have you Looked at a five-minute chart or a one-minute saw or maybe you know an hourly chart looking for a pattern a price pattern and then trying to you know chase the market after you see it moving because you you didn't have the the confidence to trust the pattern because there was nothing framing it on ok you just saw a
pattern or similarity of what would be considered a price pattern and then reacted to it after the market started Moving what you felt was a confidence booster in the favour that you know the favorite direction the pattern was suggesting it would move and then all of a sudden solvent market turn on you even though that supposed price pattern was there it eventually turned on you has that happened to you I can tell you with graces surety if it hasn't and if you don't do these types of things it surely will price patterns by themselves you
know you know almost speak harmonically Gartley butterflies bats all those patterns okay that you hear banded about on the internet and or youtube educational series or reviews or some quote-unquote previews they may or may not be profitable but if you don't have that pattern framed around a real reaction level okay and again we've talked about why the market reacts like it does and when you see market moves that are dynamic okay because it's the institutional sponsorship that takes the Market up or down okay retail traders are not going to do anything to this marketplace we
are participants that are hopefully like the fleas on the dog okay we're on for the ride once in a while we get a bike okay but if we don't watch it the dog will scratch us right off so we are hopefully positioning ourselves at a time and place really in terms of price where the market is highly sensitive to market reactions on the higher level trading Entities like the bank's large funds institutions if those traders are participating in the marketplace at that time frame okay at that time of day at that date okay at that
price level you are in a much better position technically speaking as a traitor than those that just simply go out and say well you know the markets are going up for the last six days so it's probably gonna keep going on somebody's going here and buy it today okay so I can tell You I know a lot of people that send me emails and again please I'm only using this as an example so don't let this be an impediment to you ever send me emails or questions or comments or anything like that but it you
know folks do these types of things and here's this here's another you know disclosure I did that same stuff guys okay when I should trade commodities if the market was going screaming up okay and I would be watching it do it in the middle of the Summertime during drought season if the wheat market was going straight up it could be up for 19 days and I'm like wow it's been going on let me just get in there and buy that okay and sometimes I was lucky and then other times I was not okay because I
was chasing the market by having these levels predetermined based on the heart timeframe you can sit on your hands and exercise that dreaded word patience okay because a lot of times I yeah I talked about that and I Stressed the importance of having patience and submitting to time okay because if we're using these daily and for our charts it's going to take time for price to get to these particular price levels now why am i teaching this timeframe well because most of you can't sit in front of your computers all day long and trade for
a living as much as you aspire to do that you all have what responsibilities you have mortgage payments you have children you have Spouses to take care of if your wives you have you know husbands to deal with so the bottom line is is you have a lot of responsibilities and very little time on your hands to be able to apply to analysis now sure you can go back and look at the hindsight and study intraday action like that and it's not certainly nothing wrong with that but for the most part by far and large
majority of you are watching this all have 9 defies or similar that keeps you from having the Time to sit in front of the charts and trade intraday so again I'm teaching this timeframe because it'll allow those to have jobs to formulate trading ideas on your demo account build confidence and understanding in technical analysis and still possibly take part of profitable swings that the market entities push price up or down based on you know these higher level support resistance those now again we have a snapshot in front of us here this Is essentially a two
and a half weeks worth of price data but again these levels were noted prior to these price points up here okay we were calling the market lower up in here and the market has slid lower okay to the tune of about what is that let's get a good good feel for what that price levels will get about middle that consolidation and the lowest low on last Friday comes in around 285 pips or so not bad not bad for you know a future perspective in Terms of analysis and a lot of my haters that really are
our new interest in learning this stuff they just want to derail and attract folks that are out here doing this stuff for free I don't sell nothing I just do it as a as a hobby as you can see it's been a delay in my release of this episode and that's another reason why I'll never sell anything because I really have a life and I'm not going to subject you guys to any kind of payment okay and you know Selling things because number one I don't want the hassle to I don't need your money and
three I can't promise you I'm gonna have the free time to consistently give you what you would reasonably expect Ilima paid service so there are guys out there that have you know services and some of them probably shouldn't be doing it then you have others out there that you know are doing it and maybe there are you know worthwhile and they have a you know Assistance to new traders it's not up to me you need to judge those individuals I can just tell you that me personally in the form of a mentor you get what
you get and when you get it I mean I don't mean to be ignorant about it but you know like I said I do how would you do a job of being a father a husband and my life is interesting maneet iams pulls me interactions I really didn't plan on from you know time I laid my head down to the time I wake Up a lot of things can happen in ICT world and you know I could be involved in things that I hadn't planned on and and that's what this market can provide for you
a lot of freedom to do that very thing I'm not locked into having to do any one thing or another the freedom to be able to say you know what I've reached my goal I don't ever have to go to my employment place anymore okay whatever that is you plug that in if you're you know if you work at a an Industrial job or if you're a truck driver or if you're mechanic or if you're a doctor a nurse you know ice cream truck die how about that house bottom line is is you have to
get to that point and it doesn't happen overnight so use these tools okay to help frame your inner trader that will eventually come to fruition after you gain a level of confidence in yourself firstly that you can stick to the procedures then trust the tools and then When those two come together then you find a level of consistency at your time of choosing not when I say or another mentor and whatever you know book that you by suggest that you know you should go to live trading or full-time trading you'll know it when you know
it okay believe me you'll if you feel like you're rushing you probably are so don't don't get in a race to try to say well I'm quitting my job okay I'm throwing out these little notes I Have next to my keyboard here because I've been getting emails so I'm kind of tossing these little nuggets out in the midst of having these recordings so hopefully I'm answering your your enquiries so now by looking at these two and a half weeks or such and price data we called the market lower back here okay so how would one
reasonably expect to participate in the marketplace as price moves lower number one we have these price levels noted and again from This point in here these levels were on the chart they would be walking forward you would see price reacting real-time at these price points okay again this is a 15-minute time frame so you would have smaller dealing range support resistance levels on these time frames as well but not as important as the daily end for our time frames because those are where the large institutional traders are spending you know spending majority of their time
Looking for value okay much we're gonna talk about that so now again we talked about how in the previous episode that the market tends to make its high or low in the first few days of the week generally about Tuesdays long and open and it's very latest many times you'll find that Wednesday's London open is like the last cusp of where the higher low if it's down weak the high would be formed but generally between Monday and Tuesday you see it forming the higher Low and now with that going forward okay you can see that
we did have the high form I think it just went above a few pips maybe one or two pips here on Wednesday so it came true as well here move lower okay but then we moved into this week here okay and it's kind of unique in a sense because if you've been watching the news I've been reading newspapers and such there's been some saber-rattling about the US potentially striking Syria I'm Not going to go on the political stance on you know get on my soapbox about what we should or shouldn't do in regards to that
but it has caused a lot of uncertainty in terms of what is gonna be you know the outcome of all that okay and it's really good in the sense because it gives me an opportunity to plug in something that otherwise if it hadn't hadn't been happening I would just be talking about it conceptually but now we're going to have a a Real-world example of what this implies and when you own your analysis when there's uncertainty okay when there's uncertainty in the market place or did the global economy you know arena the participants get really really
spooked okay and what will happen is the large institutional traders okay many times will scale back their risk they'll reduce their position sizes or their new trades Maybe they'll they were gonna do a large block of orders to be an accumulation of a by position maybe they're still bullish but because of the global stance against you know this potential strike and the implications that may have on the markets maybe they have reduced their overall exposure by saying well and we're gonna buy it because we funnel I fundamentally think it's gonna go higher or lower okay
they just scale back that and that's Something that you should do as well so what do I mean by that what means number one scale back the level of trading leverage you're using because anything can happen in these types of environments okay but what'll generally you'll see happening is there'll be a lot of range bound trading and spiky you know consolidation but there's still opportunity to trade in that environment you just got to lower your expectation slow down in terms of what you expect to See in terms of time okay and expect to spend a
whole lot of time in the market moves okay like for instance if one of us a buyer here on Tuesday you'd have to sit through a long period of time before we got into the New York open on this day here of the September 4th before the part the price you know released the upside now if one was a seller okay you'd have to rely more on these resistance levels okay and stick true to trading only at or very Close to these levels meaning that if the market environment suggests that it's a lot of uncertainty
okay there would be times where it may be the price moved up here off these keys since level and traded lower and then gave a retracement and maybe I would trade something away from that level okay on a more kamar global arena okay when there wasn't so much in certain team because of potentially war breaking out in the Middle East and the Implications that has I would not be willing to trade far away from these levels and continue to move lower meaning that I would miss these little small little moves in here because I don't
care about trading out here in this open space between this level here in this level here I would be more inclined to be trading at these levels okay and you can see when price gets these levels the reactions it has okay and that's what you want to be focus on Focusing on the the impact of these higher level timeframe support resistance levels and applying that to your training only trading when it gets to those particular levels and a confluence of other supporting and indicators whether it be price indicators or economic indicators to come around in
terms of your economic calendar and hello have you been looking at that you should be because those things are you know very significant in Terms of trading ya know what's coming down the pike guys so let's go in here and zoom in a little bit and go over what had transpired here okay and we're gonna use Friday two Fridays ago okay and we're gonna use this price point here okay we have a price move down smaller retracement another move down okay and then a retracement okay so we had one leg two legs and then a
retracement okay I know another REIT raid to this Particular level here at one thirty to twenty level one Monday okay we were still obviously looking for selling scenario because we were expecting lower prices based on a higher time frame idea that we're gonna flesh out here but we have a range hi here to this range low okay I'm going to show you this is the range here from the low to the high of that previous Friday okay now why am i using these price points Okay well whenever we start a new week I like to
use discernible price swings and this is discernable it's very clear very distinct much insane capacity this high down through this low is okay now you could have your level from this high to this low but I'm not expecting much of a retracement because we're overall expected bearish on a higher time frame so the likelihood of the tree trading all the way up to these levels short could but I don't expect it okay so I'm Looking at price where we moved into this consolidation and we broke down we're gonna come right back to that same consolidation
okay price comes right up into that 62 level and then trade it off okay we're gonna use this same high and this low here because this is a new swing a price swing from this high to this low it's a larger more dominant price swing whereas this is a small little short-term price swing and then a retracement this is leg one leg two Together okay so here's leg one and here's leg two now if you look at the high down to that low formed here on Tuesday we have this high and we have this low
see what we have here price come right after that sweet spot boom hit that right on Friday I'm sorry Thursday and traded lower moving into a low on Friday okay so now what was up here that caused this reaction okay that's one of the assignments I want you to look at go Over your economic calendar over your your charts on a five-minute basis on an hourly basis for our and daily okay really hone in on this little area right here okay the breakdown in the fiber or your yes t as we would commonly hear it
referred to as this was the actual high that was formed on the fiber and we traded lower and right before that price high okay I want you to see something here see this low Okay let's zoom out just one stage here's the high okay here's these low so we're just talking about the market broke those right there okay when we see that that's generally a sign that this market wants to break down much in the same way you see it here okay it broke the low here and then try to rally up and was a
false swing and then gave up the ghost and went lower well we have that same scenario here okay and the reason why price was Expected to break down here is if we go out to a daily chart real quick see this old set of highs back here price went just above that ran to the 130 450 figure mid figure I current rather and then hmm traded lower when we had this price pattern here these are referred to as railroad tracks okay and I like to see these types of patterns because number one they're pretty powerful
in terms of prognostication you see that happen here And price gave a very nice retracement here this is very tradable now obviously when you contrast it against something like this where it rallies out like this or the rally here or the decline here it doesn't look so dynamic but if you were to look inside the range from this high to this low we're looking at 168 pips would you just throw away the opportunity to make honor and 68 it's certainly not or at least you shouldn't So again dealing with these daily charts there's a lot
of pips there's a lot of potential setups that are available to one if you understand what you're looking for okay because we're looking at price and an old high here when prices run up through an old high but look at look at where the market head came from we come all the way out this low in the beginning of July and it was basically a one-sided market we very had very little retracements and it's kept Driving higher and higher higher now I've got a lot of lines on this chart but I'm gonna refrain from taking
them all cuz I'm gonna need them in a moment but we have this rally up makes a swing high then we rally up makes another swing high and we rally you up makes a higher swing high okay whenever you see the moves like this keep pushing higher higher higher into an old high these are areas of where heavy distribution is taking place now I learned a pattern called the three Indians pattern okay and it's basically like a three drive pattern where you got one high and higher high and another high okay it's a very common
pattern it's been around forever and I can't remember who really originated it Larry Williams did some discussion on it but I always just revert back to just you know the street smarts book Linda and Larry and now you can just google them up on the internet again the books street Smarts in the pattern here you're seeing is the three Indians pattern it's a climax reversal pattern meaning that the price is driven up to an extreme and generally it's just right above an old high or into an old high and then you can reasonably expect to
see price to trade off now I'm not suggesting please don't take this as this is the high of the euro and it's gonna go down to hell okay that's not what I'm saying here okay what I'm saying is it's giving you A tradable reaction that's sizable okay we're going to talk about where we would be reasonably expecting to see this market lower okay based on this understanding here but looking at this high here when we ran through that and gave up the ghost on that candle right there that was the faint sealer from me that
we're probably looking to see this market blow out and go lower and then when the next candle here took out the lows prior to That rally okay that right there is a break-in market structure that right there suggests that this market is now poised to trade lower so any rallies from this point on should be suspect in other words you selling you selling as a mode of trading so don't be buying into it expected to keep going higher now will eventually sometimes do that certainly will okay because I'm not 100% but by far and large
when you see these types of events happen it does give you An opportunity to trade short just go back down to a fifteen minute time frame okay and here's that hi here we were just discussing them and it broke down we see the break below the low prior to that last rally up okay so now here what we have is we have the range high to the low once these loads were taken out we have a shift in market structure now what does that mean well it means that we have a low to high a
low to high then we have a lower low Prior to that rally so we have a break in what would be considered market bullishness breaking down okay again because I'm not a fan of support resistance I'm not going to draw I'm sorry I shouldn't say I'm very very large famous partisan something's not a fan diagonal support resistance in the form of like a trend lines but if one was to draw a trendline like this okay one could say okay well here we have a price point here we have a price point Here trendline breaks here
comes out retest goes to it's just a little bit and then it falls off that's all fine and great okay but I've seen many times where these types of scenarios don't even have any impact whatsoever and this blows on through okay so again if you trust trend lines go right ahead and use them I'm not trying to disparage those that do I'm just telling you if you're looking for trend lines down the diagonal support listens Basis with me you're not gonna find it there's gonna be you know what you're out I don't work with that
so we have this range here that's high in this low okay and as price rallies on up in here price goes right after that sweet spot okay here's your 70.5 level unique to IC t so here we have price react and very nicely and then coming down giving you several opportunities trading off of that 62% recent level see that prices having a very strong resistance around That price point okay all of a sudden the market breaks down again okay and we start taking out the lows here and this low here when that thing is you
saw you know it's all over with and you can see that happening here the market participants drive it lower and then just didn't have any momentum whatsoever at in terms of trying to come back and we move low we're in lower lower so now once we have this break-in market structure in the front Price rallies up here okay what we will be doing is looking for areas of resistance or support breaking then turning resistance where we would time shorts okay movie time shorts now let's add a couple examples here but we're gonna apply okay we're
going to apply some let's go back to the vertical lines here because we're going to imply the weak phenomenon that we like to look for Tuesday and or Wednesday from the high of the week and You see that happening here okay but as price rallied up this is a suspect rally why because we had already broken down based on this loaf you know forming lower on these lows here taken out and the rally up is suspect and when you start to break lower we have these lows taken out rallies up now we have a new
range we have this high down to this low see that now look at what's happening here price was working within here's your 79 Percent 70 and a half percent and 62 percent all this time price spent in that small little consolidation and then price broke down it came back up broke down came back up broke down came back up broke down okay again we're looking at a 15-minute time frame now you could frame trades on that or if you really want to reduce risk okay you could zero in and go lower to a five-minute chart
okay and we're gonna do that now we're gonna work within the Week of the seven what is that 24th and the thirtieth so let's go down to a five minute and this is where price was consolidating all around that area and price breaks down here then rallies up we have a hold high here we have old high here and old high here watch what we do here we're gonna use this high here this is seven GMT this is essentially the beginning of the European session and we're gonna pull it Down to little low prior to
that rally up goes right to the sweet spot in this candle comes in at 1,300 GMT that's New York open remember we were talking about how in the previous episodes where we could see specific price moves unfold in the two largest trading sessions that being London open in New York within those two sessions overlap but uniformly inside of individual London and New York there are particular price swings that take place I'm going to discuss that Later on in this video but here's an opportunity one could get short one trading off of this resistance level that
was noted in advance trades down off bounce off the support now notice how price sweeps is just below it a little bit okay and then reacts when it bounces here okay not only is it bouncing here to give you a rally to sell into but if you're a scalper okay if you're a scalper see this is low here and it rallies on up it spends a lot of Time in here okay let's look at how much of a bounce that took place we're looking at about 35 pips or so of a bounce so if you're
a scalper here's your higher time frame support level you have an old low back here this rally and then dips them okay it goes back to this same little consolidation market participants are gonna be really sensitive to this area of interest in terms of price data when price moves out of the consolidation and it eventually Comes back down to it it's reasonable to expect another reaction now it doesn't mean it's gonna go right to the moon okay but if you are bearish and if you're a scalper on a short-term you could buy into this and
if you're really nimble and I'm not suggesting you try to be but one could do what I've done very little of in my trading history but I knew a few guys that are very nimble like this they'll buy this then go short on a reversal and Then ride the other way down I'm not that good and I'm claiming to be that good but I have seen it done a couple years ago I was on a website forum and I shared a live example of me doing that very thing and I reversed on that time and
kind of like excited a lot of folks that we're actually watching it live but I can assure you that doesn't happen all the time and I just happen to be lucky on this one few rare instances where witnesses were were present did so Here's an opportunity to be a seller here and that was on a Wednesday okay and we were looking for the market move lower into Friday because the overall Bears tone sets that that stage up we have a resistance level here price is unable to go higher okay trades lower and it starts to
rally up so what do you think would be here if you pull your fib you got to use this high not here use the highest high around that level so here's a high and again we're really Splitting hairs with this in terms of the five-minute chart but you can see that it does give some quality setups and again if you look at this this is your optimal trade entry and you'll have to zoom in on your own chart because I'm not going to do that here I guess if I moved out this way a little
bit you'll see a little bit better yeah 60 to 70 and a half and 79% is the actual highs of the candle and that happens to be around the asian session so you could Actually call it very nice move in the asian session which we're not gonna be talking too much about in this video series really relying more on the London opening New York open sessions we have a high here at 8:40 GMT and hi here at 12:20 so we have a London open swing high and we have in New York open swing high and
the overall bearson's is again focused on because of the higher time frame any rallies you look to sell so here's a high to a low Put it on that low where it belongs and price trades right up into the sweet spot which is convert kind of confluence of factors here we have a higher level time frame support resistance level that 132 67 level ish you can go around you can round that to with 130 to 70 or 130 to 60 small round number and not the time of day that occurs it's 12:15 and that's the
New York open and then price moves lower respectively then we have again price trading at this one thirty To thirty nine eleven called once or not I'm sorry 132 for forty level or was round to a nice round number we have this range here trading off of this resistance down to this resistance and then there's a retracement okay and pulling that range make sure we get our candles okay we have in here we have Asia making the high the actual high formed on 1:30 GMT this candle here is the 9:10 GMT that's new I'm sorry
to London open price Breaks down a couple different little micro rallies in here and then finally gave up the ghost at 12:30 GMT which is New York open again trading right up into that one 32 39 over 130 240 level and then really fell out of bed and again here trading in the same direction intraday we have this resistance broken I'm sorry support broken now resistance and this small little range if you looked at the high in the low of that you'll get another small little Retracement for a London close continuation pattern going into the
low of the day we have the high here in Asia previous day's high and low okay price comes down rallies up into the 62% race on level here and it's confirmed by this same 30 to 20 level which is nice level is 30 to 20 and institutional level we like to lodge to the 20 levels and an old low okay and on this candle here that is 10:40 GMT and Then we have 945 GMT and we have 7 GMT so all during the European and London session we have several opportunities to be a seller and
to old lows broken now resistance and then market moves lower where would be reasonably expected to see reach for this old low and we're looking for support resistance levels to aim and and look for new targets again same scenario here ok markets moving lower here is a opportunity you could use King off of That 131 90 level let's round that to a small round number full fifth from this high to that low you'll get a nice retracement okay wrap to sweet spot and sell-off and here same thing could use for continuation in the same direction
intraday we use the fib on that for the New York open you get right up in that sweet spot and awful trade entry and trade lower intraday now that's if you are a day trader okay and there's 45 pips or so Later your feet using that as an example eventually the market bounces and trades up into a previous range now we're we're trading right into these resistance levels but you see this high here this low and here's leg one and leg two if we use too high down to that low again we're looking at market
swings the markets trading into the optimal trade entry just fell short of this sweet spot which actually comes right on top of that 30 to 20 level which is nice I like Seeing stuff like that there's where you got your setup so I kind of gave you your answer for your homework didn't mean to do that but sometimes I don't have them guys and there's your your tradesmen back into going into Friday ok so that's what has happened since the last time we did our episode two in this series and how the reactions and price
levels are laid at your feet they were in advance given to you how to find them what was you Need to trade direction and how you look for setups ok this is what you do you go through looking for support resistance levels and you only take opportunities when price gets to those levels and you look for price patterns around that same higher level timeframe support resistance okay notice we did not put any five minutes for resistance levels we do not put in any 15 minutes poor innocent level so we didn't put an Hourly support resistance
level we only used daily in a four-hour the higher time frame those are your timeframes where the institutional sponsorships going to come in okay so hopefully this has been insightful to you again apply the tools in a demo account setting and build your confidence and you determine when it's safe for you to use live funds okay we are looking at a 10-year t note daily chart okay and I'm sure you're Probably asking yourself okay well when did we enter at the commodity realm well I started as a commodity trader and I learned from Larry Williams
one of my first mentors that the interest rate market was basically the market that controlled just about every market asset class there is interest rates are the driving force whether you're a stock trader whether you're a commodity trader currency trader oil trader it doesn't matter what it is interest rates are the Absolute underpinning of market dynamic moves up or down it's going to be more or less it's going to be propelled by the interest rate market now when we look at ten ten-year tea notes there's one small little extra I want to throw in here
I'm not breaking down my entire bond market analysis concept it would be I could spend eight series times eight videos I mean 64 videos and still not scratch the service on the the elements of interest rates in hell one could Utilize those in in trading but I'm gonna give you a real simple basic framework where I'm sure it will take a lot of ambiguity out of the market place and for you as an analyst and your trading and be able to use it in a real-world environment because I'm trying to avoid giving you information overload
and just giving you small components that were very easily and neatly fit together and it'll allow you to have a better understanding of the Macro economic perspective that was essential whether your sword term trader swing trade or even a day trader we're gonna be looking at the interest rate yields now these are specifically going to be you know the 10-year mark now they can be shorter and longer term but for FX purposes the tenure will be sufficient so let's take a look at a few examples on how we can draw this information from the internet
for free with no cost to you Okay guys we're gonna look at some concepts and utilizing the t note tenure and we're gonna be looking at some interest rate concepts and I want to give you some free resources that you can do this with and won't cost you a dime except for your internet connection all right just do a google go to bar chart okay and you'll see bar chart com okay that's what you want you want to click on that okay when bar chart opens up like this what you're gonna do is You're gonna
look over here and it's gonna say select a commodity hit that little toggle window down and you're gonna scroll down to the financial section here and you'll see ten-year t note click on that and it'll give you a few choices of contract months just use the highest month here okay and in this case is September okay when this window opens up and go over here to customize chart click on that okay and what we're gonna do is it's going to scroll down Just a little bit and we're gonna do some changes to this and what
we want to do is you want to be looking at daily nearest click on that and the reason why we want that is because it's going to show a continuous non break in in the contract as you can see here if I scroll up you'll see these little spots on the chart here okay you'll see an absence of that by using that that type of chart and we're gonna go to a candlestick we're going to take All the volume off it's not essential for that here okay and we want to see at least a year's
worth and when I click draw okay and what we have here is a daily chart of the ten year t note okay and what I want to show you is there are means of discerning where the higher level tide okay okay and think in terms of your a salmon okay generally has a new trader your salmon you you want to swim against the current because if the Market is going down okay it's probably not gonna keep going down okay it's gonna go up eventually things you know tend to be contrary and as a new trader
so you want to fight against that tide well I can tell you that's the salmon you know the outcome of that is they have fun when you get to the top okay when they're right and they survive it but they eventually once that's done and they they completed their task by getting there they all die a lot of People don't realize that but the salmon dies when it gets there so do you want to be the salmon okay do you want to swim with the tide okay and it's a kind of silly expression or example
or analogy but it really communicates the necessity of doing things the easy way okay don't overcomplicate don't love or complicate things and the surest way to start that way of thinking as a trader is where is the money flowing from is it flowing into or out of currencies okay And the essential question is how does one arrive at that answer well you have to look at a macro perspective okay and the way we look at it macro perspective is the interest rate market now the interest rate markets are the absolute center focal point of all
economic asset classes whether it be stocks commodities you know currencies it doesn't matter the interest rate markets with high rates and moves everything around you can argue with me all you want going to Tell you that's the case okay so if we understand the interest rate market we have everything later our feet we have the keys to everything you would ever want ok the kingdom okay so if you understand this you'll understand everything you'll need to know on a higher time frame premise okay so now I'm not gonna go into all of my bond work
okay so we're just gonna look at just the 10-year T note that it's gonna be sufficient for this Teaching series but I promise you there are so many levels deeper that you can go into and it's really not taught anywhere on the internet my bond work is absolutely unique and I'm gonna blow my horn there's nothing like it out there so I've given a few little things about it in the past but man there's so much more to it that helps discern what the interest rate markets are doing on an intraday basis on a week
to week basis on a daily if it's gonna be up or down Day there's ways of looking at that seasonally and I mean there's this is crazy how you know rhythmic this interest rate market is now with that understanding okay if we look at a ten-year tea note market this is a chart of a daily futures contract of the ten-year t note if we see price in this case trade lower here okay what is that telling us well there is an inverse relationship between the futures contract and the actual bond yield okay The yield that
the 10-year note is yielding is actually in this case here it's going up okay when the tea note futures contract is rallying as it does here the yield would be declining vice versa when we see the futures contract for the 10-year note trading lower that means that the yield is going higher when the 10-year treat tea note is trading higher here that means the bond yield for that 10-year note is going lower then we have a drop lower and Sustained move lower that means there's a sustained move higher in the bond yield now that's all
fine and great but what does that really mean well it means this if you want to be a buyer of currencies and we're gonna stick to our equation of being the fiber or your yes ting okay that's what this teaching series is focused on it really goes along you know with the other majors too but we're just going to use the euro if the ten-year Tino is trading Lower like this that means the bond yield is going higher currencies are going to be chasing higher yield so what does that mean as the yields go up
as we're going to see in another chart and how you can get that information as well as the yields are going higher the currencies are going to chase that okay and that means they're gonna chase yield what does that mean that means while the 10-year note is trading lower you want to be a buyer of currencies okay now Take a big step back now go back to this price action here if we see price trades lower and then rally up into a level of old support broken here is resistance keep on going over here now
this is no resistance right if you look at the high down to the low we've essentially retraced back to will be considered a deep enough optimal trade entry I'm not gonna put the fib on here you can do that you have to subscribe I'm not going to key in my my information for bar Chart calm but you can set up an account with these this website it's free absolutely free does not do anything but require you to have a email address okay and my advice is to create an online email address that you use for
all of your your trading related things and that way everything that gets spammed because you eventually will get spammed I'm gonna tell you that I have gotten I should say I'm kinda shy Bryce eaves rather some spam ever since I signed up To this service but if that's the small consolation and in terms of accessing free commodity charts that I like this is certainly in one way of doing it so I don't work with the email address you know ICT at in a circle chair comm or my inner circle traitor gmail account I use the
completely alien means of signing on to this this website and a few other ones that I like to use but as price rate rallies up into this area here we have an old level of resistance Which is support here okay we could expect to see prices trade lower now what if we could have an x-ray view okay imagine if you had an x-ray machine or x-ray remember as a kid and maybe you guys in the states knew this growing up his kid they had these little things in the back of a comic book where it
had x-ray glasses okay and of course I was a sucker and I spent my dollar 25 allowance and sent it in here and I bought myself a pair of them and when I Opened it up it was ridiculous it was this optical illusion it gives you the impression you're seeing you know an x-ray view but there is a way of looking at the market on interest rates okay so you can see where the tide is changing and turning now we're going to come back to this chart but for another free resource we're going to create
another tab okay and we're going to go to do a 10-year bond yield chart okay when you click on that you're going to again look For in the list u.s. generic government 10-year yield analysis okay you see that you're just gonna scroll down a little bit you want to go and go to your chart here not a snapshot you want to go to chart okay and just do a year okay what we have here is the fluctuations of the actual yield okay out the ten-year Treasury market now watch what happens let's go back to that
ten-year Tino chart price made a high Here in April and then going into May we made a higher high you see that okay then we made an ultimate high in the t-nut market and traded lower let's go and you see a converse relationship here in the yield okay here's that low and then a lower low in the yield again thinking inversely here okay all we did was have a mirror image of that happening here okay and then there's been this rally up or sustained move in the bond yield so as the bond Market I'm sorry
the interest rate on the ten-year has been moving up okay that means that the currency markets are gonna be looking to rally okay that means they're gonna be looking to go higher so now as a higher level timeframe institutional sponsorship minded trader it's like that's what we're trying to cultivate in you right now you want to be focusing the majority of your trading okay now here's one of those note pad Moments when you want to risk the maximum amount of leverage that your personal risk appetite permits okay and let's put it out right now do
not risk more than the industry standard 2% per trade or maximum account exposure at any one time okay and we're going to say that that's the case here you have the like go to be risking 2% or whatever your maximum is in your demo account again cuz this is for teaching purposes Only and not giving you trade advice you have to determine whether or not this is useful information to you and if you trade on that with live funds it's completely 100 cent your responsibility you collect all the success and accolades I don't want none
of it okay so by looking at this type of scenario you could be a maximum risk trader as a buyer okay and what does that also mean for being a short sell if you're an intraday trader don't risk maximum okay Because the higher level timeframe tide is poised to be moving higher why because the yields are going up and eventually the currencies are gonna try to snap up and chase after that yield okay so what does that mean well let's look at April and May time period in the euro now obviously once you set these
once you open your charts up like this you're going to be wanting to save them in your favorites tab okay I have one for the euro for the bond I'm sorry for The British Pound for the dollar index and I have one for the tenure t note okay here is a weekly because that's what I save but we're gonna go down to a daily nearest and note nine months of it and we're gonna draw the chart okay and I left the co T data on there but uh yeah you guys know me I'm nuts about
stuff like I gotta get it off it'll distract me it's case I just took that off and now what we're doing is we're looking at the Here's the April and here's May time frame where the euro did what we made it low here came down made it low traded higher came down in July ran out the lows here but this right here was suspect why because the yields were going higher okay so while we did trade down to these levels okay those that were watching my market reviews okay I discussed that British Pound was poised
to move higher as well all in these same time periods and it was the case you can See it happening and unfolding here so we saw again the the fiber eur/usd pair traded higher higher higher higher higher higher and where to trade to an old high blew it out just a little bit but eventually now we're trading counter okay what the yield markets are suggesting okay so we could retrace a little bit deeper and try to trade up and fill this area here but bottom line is is ultimately these are the types of moves okay
you want to be participating In okay do you see the majority or lion's portion of the market moves are happening on the higher level timeframe being a buyer okay very very sustained long basically you know enemy it terms swings are on the upside okay now granted there's some profitability to be made going short there's nothing arguing against that here okay but we're saying is is if you want to be directionally poised as a trader and only focusing on institutional level direction okay this Is one way of doing it okay let's look at the bond yields
chart again now there is another opportunity to look behind the marketplace okay we talked about this x-ray view concept I'm going to go to Google once again and we're gonna go and look at the ten-year German bond yield okay when you see that you're gonna go to we got here sorry German government bonds and then here's it over here when you see gdb r10 that's the one we're looking for okay All I'm doing is opening that up so that way I can cut and paste the symbol if you want to have an individual chart like
this obviously you can do that you can see now we have this chart now this is showing the ten-year rate of the German bond yield for ten years right if you every time you open up a new chart it'll give you your history okay and what I'm only gonna copy that I don't trust myself to remember it why not get everyone this page and you got To type in : IND okay and then what that does is it compares the two okay so we have the orange is the US 10-year bond yield and you have
the green which is the German or which is closely associated to the fiber eur/usd the green is seen here now here's what I want you to look at if you look at this chart you'll notice that the orange okay has a low here go higher than goes lower again but look at the low is higher than it is here you do Not see that happening with the German okay the German went lower okay and you probably see it easier if I went to three years yes we went lower in the German and higher in the
US so comparing the lows respectively there is a accumulation going on and it's seen with the US bond yield okay so now if we go back to Google once again and we do a ten-year UK bond yield chart you mean looking for again the bloomberg and it'll say government bond 10-year Note generic the Guk GU 10 IND okay I'm just going to copy it from here and then actually open the charts you can see it so now say my clipboard I can just drop it in well my first chart for comparison reasons and you can
see here change it to a year you can see the same thing happening here that the bond markets yield turns on the dime in that same april/may time period and starts rallying up so now if we go back to diff first chart where you have the US and German I'm going to paste the UK and by having the three on here you can see now the orange makes a lower low then we have here the red makes a higher low and the green makes a lower low so there's a divergence between the three okay and
if I go to a six-month now you really can't see it's got to be seen on in one year but uh my advice would be is you want to pull this up every month and take a snapshot picture just to a cream screen capture and just keep a record of it and You'll be able to go back and look at where it diverged but basically if you look at every three months or so there is a shift okay there's a shift in these these yields okay and you can see the happening here in the beginning
of the year where the green or the German tenure did not make a higher high whereas the British UK yield did and said that the American so that was the shift when he started to move lower okay so there is a continuous move up and Down up and down but generally around the spring time there's a sustained move - that moves throughout you this summer and it's based on income tax and portfolio dressing that goes along with you money flow and moving things from one asset class to another and new overall basic level well you
know money system okay and it just repeats all the times it's just it's always there if you just look at the higher time frame macro view like this it's very easy to get in Sync with the tide now just for completeness sake okay we're gonna look at the British Pound okay and we're just gonna show you the effects again just for completeness sake not to that we're going to be utilizing the cable and our examples but I want you to see that the effects are similar with this pair as well okay here's our April now
it actually made a low earlier in the year came up here's a load as tradable there's a male oh that was tradable and We came down this is where I was telling everyone in my market review in advance that this level here was going to be sensitive and we would see a buying opportunity and here we are nine hundred pips later it were up here and where was it gonna go back to an old high why was it rallying up like this and canoeing pushing higher higher and higher higher everyone scratching their head saying what's
going on it's because it's chasing the yields okay and there's been No clear disturb all means of reversing in the yield market so therefore airs no real clear sir noble reason to expect this thing to reversing trait and blow out this low so I would still be hunting bullish scenarios longer term but certainly not negating any short-term intraday scalping or short-term intraday day trading scenarios for being a bear so now we have covered the tenure rate so I'm sorry ten-year t note okay if you do your analysis on this futures market Everything is reversed in
terms of the interest rates yield and if the ten years going lower that means that the bonds are going higher the actual rate yielding the interest rate and if that's the case the currency markets are gonna chase yield okay so if the yields are dropping they're gonna go on file it and if it's going up it's gonna be following it as well okay so if I spin cycle to you and obviously you know it's gonna take some time in a long time to learn This concept because it takes a while for these things to cycle
through you know on an annual basis and quarterly basis but I promise you if you'd spend some time it'll be absolutely a wealth of insight that is not Glee Noble anywhere only okay guys we are looking at the time frame section of this episode now obviously you know it could be very daunting for you as a trader especially if you're new and you just sit down in Front of the charts and you're thinking yourself you know what am I supposed to be looking at yeah so see looking at a five-minute chart how about 30 minute
chart you know the guy I've read on the forum said he looks at a two-minute chart and how about the other guy he looks at a tick chart and the other guy says he ain't looking at anything but a weekly chart you know so what do you do with all that well the main thing is is you have to keep in Mind that whatever time frame you're trading that's where you work within okay so basically knowing your time frame for your trade is your primary objective now the professional perspective okay that the frame of your
trade should be at least built upon three time frames and that's what we're teaching here I'm building a large introduction into basically Alexander alders triple screen approach with an ICT twist so if we're us position trader You would utilize the monthly the weekly in a daily chart okay and you'll be looking for monthly higher level time frame support resistance levels and reaction levels and weekly chart as well and then keying off of the daily chart for your trades now in this time frame you don't need to be in front of charts all the time in
fact you're probably gonna be trading very few setups throughout the year but for those that have really very very few hours of the Week to you know put into trading position trades may be the way to go if you are a little bit more free and you have a lot more hours of available to you for intraday or I'm sorry intro week trading swing trades might be up your alley we use the daily the 4-hour in a one-hour chart and that's really what this series has been framed about the daily chart and 4-hour chart really
are the institutional frames for your trade Setups and your trade ideas the one hour basis you could you could substitute that with a 15-minute chart it's really up to you okay there's that's where the level of flexibility comes in now short-term trading your high higher time frame chart would be a four hour and the one hour being your mid time frame and your 15 minute chart would be your execution time frame and obviously for day trades and scalps your one hour would be higher Time frame your 15 minute would be your mid time frame and
your five minute chart would be your execution time frame now at any one of these levels of time frame analysis you can always break it down further to the lowest form of charting in other words you know it could go down to a 1-minute chart now I don't use one minute charts the lowest I go is five minute and that's only when I've really honed into a specific key level and I mean either either day Trading or scalping which I don't do very much of but most of my trades are day trades short-term and swing
trades but that's the framework you utilize when you're breaking down the market and how you digest it and if you're going to be a specific type of trader if you work with these three time frames as you as suggestions I think they'll work well with you in terms of your development let's talk about cycles in the marketplace okay We're gonna be talking about some smart money concepts and some of these concepts again go back to Larry Williams and again he was one of my first technical analysts quote-unquote Mentors and one of the coolest things I
learned and it didn't really hit me until I started trading the bond market in the S&P but he taught a concept that's very very generic and it goes right over your head if you're a new trading and thinking yourself what it's stupid or That's not the you know exciting or that's pretty obvious but it's amazing how when you're trading are you looking for setups you forget this phenomenon the concept is basically how the market moves from trading ranges or consolidations to swings or trends and they move immediately right back into a consolidation and then after
consolidation people get sick and tired of the marketplace they don't worry about getting in or they chase The previous move and that inside the little consolidation or these rectangles or squares if you look at on this chart is iam as an example that's where dealers and market makers establish their positions okay so we do not chase the market place we do not chase price rallies we do not chase price declines we work within these consolidations smart money accumulates during consolidations or when the markets not attractive okay and We're gonna build on this model as we
go through the series but it's very important for you to start looking at the charts with this premise in mind are we consolidating because that's the next that the precursor is the consolidation then the next thing to expect would be that a release that dynamic thrust up or down in price action where everybody gets really excited you see everybody ting about it you see Every analyst saying they had it right you know for the last six months that's really what you're looking for you want to be in there before everyone else is talking about it
okay now we're going to talking about the concept of power of three okay and what this is is basically a understanding of how the market works on a daily range okay now we're gonna be looking at this bar chart okay now obviously and we we deal with candlesticks a lot in my videos and Maybe in your own trading in your technical analysis but for a couple minutes out let's spend a few minutes talking about how the open high low close bar is beneficial now I'm not going to give you a full treatise on one disc
because I have actually a tutorial that I'm releasing that has much more insight that I'm gonna go over in that but this is going to be a brief introduction the concept briefly is this when the market opens up on a daily Range okay you as a trader you want to be participating in large range moves okay like we just discussed in the previous slide you want to be entering the market when it's quiet when there's not a whole lot of activity or at least when the ranges start to compress okay when the range is start
to get small people get really bored with that mark and they start chasing the next or the next commodity market or whatever it is it's moving around a lot that's The one they're gonna move to well during their small little consolidations or small inside days or small daily ranges that's when I get really excited because I want to be in there when the markets are getting real real quiet they're like a spring winding out tighter and tighter and tighter and eventually something whatever the catalyst is I don't always know or even care but really to
know what it is makes the market take off and hopefully in a Predetermined direction that I was positioned then before it takes place that's that's essentially what you want to be doing in your trading whether it be day trading scalping or short-term trading or position trading or your swing trading whatever the style trading it is you want to be getting in your position during these consolidations and contractions of ranges okay looking at this example here on the left-hand side of the euro this daily chart just stare At this chart for a couple minutes and you'll
start seeing that how the ranges get smaller now excluding the small little itty-bitty tiny little ranges that's actually a Sunday candle so you kind of got like disregard those but before the ranges get really really big they actually get smaller okay and there's other examples of timeframes and sample sizes you can utilize to better illustrate this but I've been looking at This for years and I can see just simply looking at for a few seconds I can see that the the pattern itself where the range is gets smaller then expand get small I can expand
and get smaller that phenomenon okay is one of the truest cycles in the marketplace and it goes over everyone's head they don't pay attention to it and many times when they hear me talking about it it's like well it's pretty obvious is it really obvious because the last few times you took a Trade maybe there are losers did you take in consideration what was going on did you chase the market after it rallied up 60 pips okay but without any kind of retracement or whatever that's the nature of this de cycle okay and some of
the best money can be made simply with just applying the consolidations to trend or swing component we just discussed in the previous slide and adding when the daily ranges themselves get smaller so inside There's larger consolidations okay or rectangles where the trading range market environment and develops inside that trading range if you start getting small inside days or small little daily rains is getting smaller than the previous days then you have a really good scenario where it sets up where there's going to be an explosive move one day two day three day up or down
event if I want directional bias that was the precursor going into That condition but now let's break the daily bar itself down looking at the opening assuming that we were looking for a up day okay or in a bullish scenario generally speaking if you are trading in an area where it's highly probable for the market to trade up maybe we're in a consolidation on a daily chart or a 4-hour and then the range to start contracting okay one large range days this is a notepad moment get this written down on your Notepad on large range
days the open tends to be at the opposite extreme of the daily range opposed to the close as you can see in this example obviously this is an illustrative example I drew with the computer but it's going to communicate the the basic premise the open generally is on an up day or the large range with an update bias and a closed typically sees the open at the low the day or near the low with the closed at or very near the high today Okay now look at the example for a moment to the left notice
how many again this is a daily chart of the Euro notice how many times that the open isn't the opposite extreme of the daily bar where the closes okay there's enormous amounts of opportunity within the daily range and that is what you should be looking for you want to be trading at the very minimum in the directional bias of the daily range okay we talked about the notion of having the Higher low form in the early part of the week okay so that same principle applies here just on a daily chart okay so now what
this means is if you're bullish you want to be looking at the opening price and looking at that as your filter so you want to be buying not very much above it if at all really and certainly below it okay because what you'll learn is the opening price very rarely works both sides up or down before going up I want to update in Other words price does not spend a whole lot of time monkeying around with the opening price if it goes down it's only going down briefly for a very short distance maybe reach low
have some stops maybe retest an old consolidation dip into an old block of orders for institutional purposes and then shoot straight up and continuously work one side of the market all the way through the the trading session and then closing off many times a little bit off to high Looking at the example you have here you can see that just about happening almost on a daily basis the vice-versa would be obviously on a down move the open would be very near the high and the close very close to the low the general principle is the
low is formed briefly after the opening on updates and the high generally forms between 1500 and 1600 GMT put that in your notepad and then you test that theory on your own going forward for the next couple of weeks Okay let's look at a large range day oK we've pointed out this one specifically here and this is one actually did trade now admittedly I got out during the middle part of the day because I had thought that it was gonna retrace a little bit deeper in and give me a better opportunity but I missed it
and I was only able to catch the first leg of the daily trend but this large range day okay Came with the principles that we just discussed okay we had the chart here on the right hand side it's going to depict a few things the first let's look at this ok we have the beginning of a new day here okay then the market Peters around ok this is all Asia ok and this vertical line delineate Adhir is midnight New York time ok then you see the market dropped down during the European session into London then
the market takes off goes vertical goes into A consolidation ok and during this time what I actually expected was it to retrace a little bit deeper maybe come back down and to touch this high in here but this was the New York open trade here and then violently traded higher going into the latter part of the day and then Peters off from the high and closes just a little bit off the high but certainly a well way away from the opening price and then after this vertical delineation here this is 1800 GMT and I'm going
to talk about these two markers in a moment because I've really never discussed this on any other video or series or any kind of discussion but I'm actually going to highlight more insight as the y 1800 is a very significant number then the market essentially goes quiet going into the new day now what is so special about the midnight time frame of New York well the North American continent doesn't consider the new day like the FX market Gently calls the you know in Wellington being the new new start of a new day I don't consider
that as a new day ok now I certainly take in consideration all of the Asian trading ok but and this is going to be very confusing but I always count that as yesterday's trade my new day begins at midnight New York standard time now again that's kind of probably gonna throw a lot of yous off but just understand this is how I break the market down midnight New York time To 1800 GMT time okay or basically 2:00 p.m. New York time okay that's the cutoff of the daily range everyone asks when's the close you know
when there's New York close or when does this and when is that let's talk about the commodity market for a moment because before FX was opened up to the general public the only time you could really participate in the currency market was if you were trading the options market Or the futures and or midium contracts on the commodity exchanges and it was in the form of open outcry now open outcry still in existence today not as predominantly as was years ago because everything's slowly transitioning to electronic much to dismiss once to their dismay but there
is essentially a rhythm to the marketplace still based on that open outcry now put this in your notepad currency markets okay or calm dolls okay that means the commodity markets that Trade on the futures contract basis that means Australian dollar Canadian dollar British Pound Swiss franc Japanese yen okay those currencies okay are calm down they can be traded as a futures contract the futures contract open outcry pit begins trading at 720 New York time now what do you think so significant about that time that's 20 minutes after the beginning of our New York open kill
zone okay why is the New York open kill zone so cool and so easy to trade is because That market event open outcry also is going to be involved in the daily range okay why 1800 well because at two o'clock in the afternoon in New York time the open outcry pit closes and they are gone for the day and you can see here that clearly is illustrated there's no more volatility very very very little volatility all unless there's an FOMC you know interest rate announcement which typically comes in around two O'clock in the afternoon you
know in late in the afternoon where it really nobody should be trading anyway so will you miss some moves certainly if he FS if you're really involved in trying to you know gamble trading those types of events like non-farm payroll I can certainly do without trading one Friday out every month okay I don't really care to be a part of that roller coaster I can trade it I just choose not to but if you bracket Out your days like this okay on an intraday basis I think what you'll start seeing is there's a clear symmetry
to the market that goes unnoticed by 99 percent of mentors or gurus or teachers or even traders and this is the actual daily range that goes on every single day if you understand how that works you can see this the open the down move to move up the high and off the close and that's what you see here the open the down move the high farming and then off The clothes I mean off the high as a closed so that's what we're looking for when we're trading intraday or getting positioned during up word bullish market
environments okay let's talk about kill zones okay and first we're going to talk about it in my time zone which is the Eastern Standard Time I live on the east coast of North America in Baltimore Maryland and basically we're looking at the European and American session we're not going to spend too much time there Actually a really any time at all really talking about Asia or Prasad the Pacific Australian session because it's basically the quiet portion of the daily range and really when markets are accumulating new orders okay and we'll talk more about that later
on in other episodes but for now understand this I generally start hunting during the Frankfurt open which is 2:00 a.m. and many many times you'll hear me commonly call to a in the beginning of The London session and that's either because I'm rushing trying to talk about something and really just inadvertently misquoting it but just understand this when I get up in the middle of night to start trading in my time zone ok 2 o'clock in the morning I'm in there hunting ok but I'm hunting essentially the move that sets the higher the low of
the day and I want to trade in a directional bias for that daily range going into London close and or 1800 GMT ok the London kill zone I use 5 a.m. as my close of shop in other words if I haven't established a position by 5:00 a.m. my time okay I basically take a nap and come back right before 7 o'clock in the morning ok generally at 6:30 in the morning I'm peeking at the charts and seeing what's going on now for the American session here you see 8 a.m. and that's commonly what's been disclosed
with many other trading teachers okay But if you look at your charts guys many times the moves are starting about 7:00 a.m. between 7 a.m. to 7:30 a.m. ok and now you understand why because the open outcry pit starts at 7:20 a.m. New York time so there's a reason why there's something that you generates a signal there or a swing high swing low that can be incorporated on that daily range to trade intraday setups whether it be scalps or day trades and I usually close up shop anywhere between 1500 to 1600 GMT generally 80% of
the time and then when it's really really taken off and just blowing out all objectives I had for the day I'll leave a very small portion of the trade on for 89 of GMT but very rarely does it ever happen many it most of time 80% of the time I'm out of the market by 1600 GMT so between 1500 and 1600 GMT that's uses the clothes of the day for me that's where not usually you'll see the higher low form for the day ok folks we're looking At the euro USD it's a 5 minute chart
and what I have delineate it on this chart here we have these red dashed lines ok and green dashed lines ok now if I keep my mouse right on top of it it's going to show the ICT Asian range and what I've done was simply uh if you can pull up the indicator and I edited the beginning and end of specific windows of time this is the London open kill zone did I trade with begins stalking setups for the European session At 6:00 GMT and as late as 10 GMT and for the New York open
I made it real easy and something that's generic you guys can use over and over again 12 to 15 GMT ok 12 to 15 GMT took out all the subtle nuances that make me use 30 minutes dividers and such I'm just giving you a block of time 12 to 15 GMT and that'll give you everything you would need for the New York open session now when you have this on your chart okay okay I'm sure you're probably Asking yourself you know what's great can I have that indicator - I'm gonna supply it I'm gonna add
it to a file server and if FX gears comm could could allow me to host it on the thread I'm doing there that's wonderful if not I'll get with Jack and see if he could hook you guys up so you guys can download it and a couple other indicators that we're gonna be employing in this video series now what I want to draw your attention to is that I want you to see the highs And lows that form during these particular sessions this is the New York open session and the London open session the high
of the day formed during the London open and the low was essentially almost formed during the New York session going into that 1600 hour the next day okay we have a nice tradable rally up into this area of time it was just outside of it by two two bars here or in other words ten minutes and then it sold off we have a nice opportunity To get in sync with the daily trend here with a high forming and New York open and making a move lower we have the low forming in London and then another
tradable low off of the direction formed from the in London open here is the New York open trade and this happened to be one that I took part in in a live trade so this is the scenario I'll go over this because I haven't been doing video reviews in a couple weeks just give you this as a it's a highlight Ok the price made all these multiple stabs lower and showed an unwillingness to go lower consolidated found it low in London open trade it up and retraced into the New York session going into optimal trade
entry and a sweet spot and rallied on up now if you use your Fibonacci tools use your 162 extension nailing it for the high and we'll talk more about targeting and an exit prices and all That stuff when we get into later portions of the series but you can see how the London and New York open kill zones here gave you very nice opportunities for a set up here we have another scenario where using the previous day's low okay and all we're doing here is highlighting the importance or the influence that the New York and
London kill zones provide for setting up opportunity to trade this area here okay doing the London open we Retraced inside this range here and then where we had this consolidation and the market moved out of it this this placement can only happen when there is a large entity behind the move okay retail traders will not cause this okay and then price retraces back into it and then what to do it rise up again and where's it rally to to take out old highs in here that were to clean okay this is way too clean and
probably stabbed up in there and gave an Opportunity to take profits if you were a short term scalper on the long side but the bias was lower okay and we talked about earlier you know how it's important to focus on his higher time frame key reaction levels and that was the reason why we saw this really explosive move lower the high form during the New York open session and a low actually formed in the New York session as well the following day we had a short term high formed in here but a Tradable low formed
off the fiber ended New York session making the high here and in closing the week out as we see the kill zones are where you bracket in terms of time now by itself doesn't do anything for you you have to have an understanding of support resistance and key music reaction levels and directional premise to frame your trade on but inside these little pockets okay and really it looks like this if if it's Hard for you to see it's this whole window right here of time inside this block of time is where the scenario of a
trade should form okay and the same thing goes for the London open inside this area or a small little pocket of time in price that's what the scenario is going to unfold for you to take a trade okay so it allows you to really hone in like a scope on a rifle like a sniper to zero in on where you should be sitting down in front of your computer Okay if you're a London open or London trader this is where you do your business okay if you are London trader and don't trade or in in
New York session you're cheating yourself because there's a lot of times the setups that you may have missed being incorrect or just miss altogether will give you an opportunity again sync with that move during in New York session Mike my best advice as a mentor would be to really try to learn that New York session it's Very comfortable traded as a North American trader unless you're on the west coast and if you're out there on the west coast you know that's just something you know that's gonna have to suck up because there's no nothing more
about it that I can say that you guys got generally very favorable weather so if this is the thing you got to trade in for it and haha so anyway the New York session obviously to me I think is the easiest one to learn it's the most Forgiving because it gives you the london session behind you as a you know a catalyst joseph rain your trade off of so if you have a higher time frame support and resistance level noted a directional premise in mind and then you have you know the london session can you
in that same direction me and you have a loaded deal as you have here in this example on the fourth of September the let's take all this stuff off actually if you have any Doubts that there is some significance behind these particular windows of time it's gonna be your homework to actually go through the next week okay and have those time windows bracketed out again for new New York session it's gonna be twelve GMT to 1500 GMT and six GMT to ten GMT for the London open kill zone and for those who have been following
for a while if you notice there's a slight difference in those windows I just did it for this teasing series Because there's a lot of members of effects gears it's not familiar with my stuff and I'm not going to be populating their website with all of my videos so I'll just more or less made it user friendly so that way you guys can have generic time windows to work with and they'll be very friendly to you there's nothing gonna be missed outside of those windows of time but if you do this for a week okay
my advice is that to see what happens during these windows of time Okay and when there is high level higher time frame reaction level around these same pockets of opportunity in terms of time kills urns and then you'll see a confluence of events unfolding that if you miss it will find out more about it in the fourth installment because we're going to go over the examples but really I want you to see what you think may happen based on everything we've covered so far it's not a test okay says a learning opportunity for you To
familiarize yourself with price action okay we are looking at the ICT market maker by model okay this very crude depiction of how markets move on a fractal basis okay generally what you'll see is the market will open inside of a consolidation or trading range and not open but don't enter a trading range environment now this by model is really universal it could be applied to any time frame but We're going to be basically looking at it one the four-hour one hour 15 and five-minute basis okay and what will happen is the market will move out
of that consolidation trade out of it then come back and many times retest that first consolidation okay so if you miss the accumulation portion of the first wave down you can get back in synch with it by waiting for this retracement up okay and this the swings aren't generally in this example aren't really Uniform in other words this could come up a little bit higher into the range from this high here to this low and give you some kind of a 62 to 70 percent tradesman level not necessary but there's other factors you could hunt
in here to set up a scenario to sell short if you want to participate in the first leg going lower once price comes down into a resistance level or support level you know an inversion level where maybe this level Was possibly an old level resistance and my market broke through came back down now into testing and support basically when prices comes down to a clear level of support rather we could expect the market to turn around now it doesn't mean we just go in here start buying it up you can but I don't generally teach
that as a means of doing it after some years of training and trading real time once you get some experience and in your belt you may be able to take trades like That but that's not what I'm illustrating in these videos I want you to wait for some confirmation confirmation comes in the form of a break-in market structure and it moves higher and then many times comes back and gives you an opportunity to retest that first consolidation in here after the climax reversal pattern it forms at support rice will come up and rally out of
that again move into another consolidation okay and we could be Working off the levels that was formed over here okay so whatever timeframe this pattern forms in okay you're gonna be utilizing again same premise of key support resistance this will be another continuation pattern also what would be expected as a climax reversal by setup down here off of a higher level time Frankie support when the secondary by scenario happens here or it just makes one okay that's why these two boxes are blue generally it can be one or two Small little pauses or consolidations and
then there's a explosive move up to take out the highs above the first consolidation okay and the premise is this the market makers start building up orders in here okay any hole price within a clearly defined range there's not enough buyers that keep it in higher and it's not enough sellers to take it lower so what'll happen is is that market makers keep it in a tight range to accumulate positions okay now what They want is to hold the market in a holding pattern to establish a premise for them to take market the other way
same thing can be seen here just in Reverse on a market maker sell model we have a consolidation and the move comes out of the consolidation and the highs of that consolidation are usually retested now again it doesn't always have to happen like that but we expect it to happen if it doesn't come back down at least many times it will give You some kind of a small little pause in here or maybe a bull flag formation type thing and then it'll rally up into a clearly-defined resistance level inside of that resistance level there will
be a climax reversal pattern okay many times you'll see okay here's a little notepad moment for you if you want to see when indicators work like they do in the textbooks okay if you see this pattern here unfolding like this and trades up into a Resistance level many times you're gonna see your standard divergence of the MACD your stochastics your RSI your CCI you know spaghetti whatever it is you use for your indicators if it causes the divergence for a buy or sell signal you're gonna see it form here okay and then just think about
it if this if these indicators didn't call major moves we never would paying attention to them and the only reason why we pay attention to them is because they work on the left Side of the chart we can see it it it did it the last time right so it's gonna do it again but nobody understands the reasons behind why diverged okay and it's based on the higher time frame resistance level and the fact that the dealers market makers have taken price off there and they stabbed that price level over and over and over again
to distribute the orders that were accumulated here okay so they're buying it all up in here okay they're Distributing a little bit here they're distributing a whole lot of it here to dumping it okay and then when the market pulls back a lot of traders review this area as a another continuation pattern much in the same way it does here okay well maybe this is a bull flag okay and what they'll do is they'll buy it with the expectation is going to continue moving on higher but what happen is is they'll have buyers you know
in these small little areas of Dealing ranges that we're gonna discuss later on and what will happen is they'll pair orders up and stack up all kinds of shorting opportunities and they'll distribute the market very heavily and will happen is once they get a block of trades on the other side of their position essentially they will do a real quick repricing and it'll trap traders and what'll happen is is it you've you've done this before and you know exactly what I'm talking about even Those guys and demos you put a trade on okay maybe you
bought it up in here something like that okay and the market drops down hard okay and you're thinking okay well maybe it's just gonna come down here and retest some resistance turn support resume up okay then you start seeing this little pop-up here and you get excited okay and get Ringo back to break even but the dealers know that okay the market makers already have these folks Trapped and if you went in there and you bought you're trapped just like they are they don't want to give you an opportunity to get out of that trade
okay they're gonna keep you on a negative float okay you're gonna be below and the dealer spread okay and maybe even pips you know and negative beyond that okay and then what happen is they'll do another repricing and now here's what you're gonna do guys okay well we're Just retesting this whole area in here again and we're gonna find some support but it blows through it okay the dealers will go into another consolidation thinking okay well I know what this is this is one of those retracements where from the low up to this high we
got one of those ICT optimal trade entries nope not here what will happen is is there one more time they'll run it and got it lower and they'll take out the stops that are Placed when the folks that were right that bought this rally here and this held on for too long okay so there it's an accumulation so the distribution here or reach cumulation for new Long's okay and then when they get up here they distribute all of this in here but they do it very quickly that's why when you get up to these levels
price doesn't stay up there very long why because they're doing a massive distribution and you see the price really drop off fast But when it drops off it'll do it give you a little bit of consolidation one more rally up when it gets on the other side of that that the zenith of this price move when we get to this start rallying up this is where you start selling okay and if you kind of identify this pattern it makes your trading a whole lot easier because you understand what they're doing and where they're taking price
okay guys we got some key levels here Noted on our time frame of a daily chart and we're gonna give some examples of what is a market maker profile I'm gonna give you a by example and some sell examples and the way you utilize them is obviously you have have a hard time frame support resistance level but they can occur on any time frame but the more apt to occur on a daily for hour and or hourly timeframe and then if you have a understanding of what their directional premise is one of lower time frames
you Can use them 1 1 5 15 minute 30 minute and hourly charts and such but for now we're just going to give you examples on finding off of a daily time frame see price trades down into this level here should old support and all we did was around it to a 127 60 level it just calibrated the level to a round number we're gonna look at this area here for a buying market profile for market maker profile and then we have one in here trading into this resistance level okay And then we're going to
go and look at the sell scenario that we called no last video and how it was a market maker sell model okay so what we're gonna do is we're gonna look at this particular day and the actual candle comes in at July 9th 2013 and we're going to start with an hourly perspective on it okay and all I did was use this to highlight the time okay we have okay market in a consolidation okay we have a consolidation here market breaks Out the consolidation and retests that same consolidation here trades lower okay and there's a
couple minor little retracements to get in sync with that move lower making the actual low here and then the false swing lower this is the actual high well I'm sorry the actual low point of the market maker sell model in here okay and then price we rallies through takes out this high here and very little pausing at all in here it just explodes and where's it Explode to above the consolidation in here okay so again the same price model here in this fractal pattern is seen on a hourly basis you can see ultimately it comes
back and trades even further if we go and look at the daily chart again and we're gonna look at this example here for a sell okay right in here and I'm gonna zoom in so you can see this candle right there okay these levels of key support resistance on the higher time frame would be noted In advance as house price trades up into it we would expect to see market makers sell model unfold and let's go down to a 15-minute okay you see that happening here and let's actually go down to a five minute see
a little bit better and just take this rectangle office it's no longer needed okay we have the consolidation to move out of the consolidation and then retest now this part does not have to happen okay but generally you'll see it Happen and then there's a continuation moving up makes the high or the capitulation portion of the by model now it turns to the sell side of it okay so we are now at a market maker sell model profile and we would expect to see this consolidation ran out as you see here market moves down solvation
Lin here another break lower or is it trade to below the consolidation where cumulated positions were taking on and you can see ultimately that's the the price model Right there okay and let's go back out to a daily okay we're gonna look at the 134 30 level okay see this high here the lows in here and the bodies of the candles as well so we have 134 30 small round number it's just above this high as well and we're gonna zoom in and look at this profile right here and as price moves up into these
levels we would reasonably expect to see a market maker sell model we're gonna into an hourly timeframe yeah and we're gonna zoom out Okay we can see the consolidation let's take these vertical lines so I'll clean it up a little bit you can see the consolidation in here consolidated moved out came back retested the consolidation moves on up false rally higher breaks down rallies and again on the other side and again this is the cell model so again this is the cell model so you're gonna see price run out this consolidation on the line you
can see that happen there okay So that's the market maker sell model and again we called this market lower here before the actual move and sued given some further credibility to the analysis concepts and it's not always hindsight cherry-picking alright let's talk about market orders and how dealers work within the marketplace and how they perceive traders psychology and how you can pretty much get close to what they're doing without even seeing the order Books alright we're looking at a conceptual idea of what market price is right now and we're not gonna have a chart we're
just gonna conceptually talk about the generic principles associated with how reading the market alright let's assume for a moment the market price moves up to what would be considered a key level okay or could be moving down to a key level it doesn't matter but we're saying for the moment right now we are trading at a highly Sensitive price point that reacted most recently or maybe a couple weeks ago there was a significant reaction in that same price level so now market moves whether it be up or down we now have a market price that's
equal to or very close to that key level the question comes to mind is where do we go from here do we move higher or do we move lower when you're watching price what you're going to be looking for are clues okay there's gonna be a fingerprint if You will of what may be unfolding and generally what happens is above the market price okay there are protective buy stops on those that have maybe put on net short positions and many times a simply above that just a little bit more there's gonna be pending sell limit
orders for those that have been possibly being long okay in other words we have net long traders in the market and we have net short traders in the market the net trader on the short side want to Protect our position so they're gonna have their protective buy stops somewhere above the market price and again the premise is is this market price is now trading at a key level okay and because traders always have a differing view if even if the marketplace is a implied support level folks may be really looking to sell short okay and
we're gonna talk about that in a moment but for those that have solved this level as a potential support Zone and they want to be expecting some kind of a bounce up they would have pending cell limit orders to exit some of their position end or all of it did for a profit and then obviously folks that expect to see it go up only if it proves a little bit more that it's gonna move upwards they'll have a new long buy stop okay so in other words we have three types of orders that exist generally
above current market price that being pending sell limit orders for Those that are net long protective buy stops on those that are net short and new potential buy stops for those that want to enter on buying strength on the converse side obviously you have for those that are buying this this particular price level you have protective sell stops protecting what they believe there's a potential buy scenario unfolding then you have sell stops that are resting below the market price for new short selling so loads They want to sell on weakness and below that usually you
have pending limit orders to be you tripped for covering short positions okay in other words they're using that type of order to exit one a profit target objective for short positions the question is where are we most likely building up orders okay and it's very tricky in the beginning because you have to spend some time looking at charts okay this is going to come with time and when you hear me talk About in a lot of times that you'll hear me in my market review videos or sometimes in my teaching videos I many times I'll
talk out loud okay my thought process is this isn't always meant for you to be taught what I'm always speaking okay in other words I may be thinking out loud about a phenomenon that may be unfolding at a particular level okay and I'm not really meaning to teach that to you because it's something that You're gonna have to drill overtop of charts to learn on your own okay and this is the part of the experience factor that comes into play and why patience is so important because if you don't have patience you won't give yourself
the time to develop this knack because that's exactly what this is I don't have an order book I don't have access to you know what these orders are outside of what everybody else has on a retail level okay I can make phone calls And ask where orders are stacking up but that's only really limited to a certain portion of the actual marketplace so the psychology behind price action is very readable okay and it's by using these simple six types of orders around market price obviously if price has moved up to a resistance level okay one
would expect new sellers to come into place and then there'd be protective buy stops established and those that have been net long they want to be getting another Position and they're greedy they want to be trying to get that extra little bit of drops of lemon juice out of that lemon they want to squeeze it for all it's worth so let's try to put their limit orders on the far you know side of particular resistance level okay because it's freed this market like anything else is a breeding ground for greed and obviously those that have
been you know just introduced to the marketplace they've Been seeing the market go up for nine days straight so therefore if it goes up a little bit higher that's when they want to buy and that's the only what happens is they buy the high the market okay and I've been there I know what it's all about and I know it feels like so and you probably do too if we had seen market price trade down to a key support level okay those that are entering in on whatever we implied as a buy signal for them
they would Immediately put protective cell stops below the market price and then obviously for those that have been net short okay they have their limit orders below market price trying to get out you know with their greedy you know expectations of getting out near a very handsome price level to profit from and again the same guys that have been just introduced in the marketplace yeah twenty-five days in the marketplaces Been seeing lower prices so therefore if it goes down a little bit farther then they'll sell short and they'll have sell stops down there because they
can't me from their trading desk because they're working at you know whatever they're doing you know you know painting cars say they want to have their sell stocks below the market place and it many times you see them selling the low of the day so let's talk about a little bit more detail of how market makers pair orders And how orders stack let's assume for a moment that there is a highly sensitive price level of support or resistance around that one thirty two big figure now when we look at a big figure okay and before
I go any further this could be a mid figure okay and then obviously the levels above it being respective in terms of what we have here as an example but keeping in true form of the institutional levels we like to follow which are the big figures the 20s the 80s the small round numbers okay in the mid 50 levels okay if price trades up to 132 don't expect 132 to always simply hold price back many times you'll see price trade up to that level and there'll be orders around the 10 level and around the 20
level many times you'll see price even if it's going to go lower longer-term many times they'll suite price up to the tens and the 20s and the reason why is because folks like to put their orders at odd numbers and Such okay but really the institutional level traders they work around Ross small round numbers okay the tens the 20s they'll they'll use those levels because it allows them to clean through particular price levels and maybe you've encountered slippage okay in other words you you really wanted to get out at 1:30 2:05 but maybe they fell
JIT at 1:30 to 10:00 that's slippage why did they fill you at 1:30 to 10:00 because that's where their Order was for them to execute so they're gonna fill you they're not where you really want to get out at okay it doesn't happen all the time no but obviously we as retail traders are at the mercy if you will of what the dealers are going to give us as an order okay maybe you had a trade executed and you exited or entered and then you have a recode later on okay maybe you got in a
short position at 1:32 even okay and then later on found Out that they quoted you 130 195 or 130 190 okay that's pretty extreme in terms of slippage but if it's an economic report things like that can happen as a matter of fact you know I just recently traded an economic report and I had you know seven pip slippage from where I was trying to get in and where actually got filled so that's the inherent nature of trading in fast it liquid markets and they're gonna fill you where they want to get filled okay so
let me taking the Other side of your trade so I understand that if you're dealing through a you know market maker or an order desk that's the type of filling you're gonna get with your orders okay but if you think in terms of the big picture of how these market makers and large bank dealer traders work they're gonna work around these round numbers and always expect them to try to sweep to the next small little round number because that's generally where they'll take price and It'll clean out all the guys that want to use a
stop loss okay they may be a sell short it 132 even I want to limit and maybe they saw a price drop down to 130 190 and they're salivating because they think it's going to go to 130 okay so they put your stop loss at 130 203 okay well the dealers know that okay and they're gonna take price up and just for good measure gonna run up to the 132 10 level and that'll clear out a nice block of trades that would have had pending Orders resting above it like we just discussed in a previous
slide and allow them to promote liquidity not only for themselves but other you know orders they have to do transactions for all right let's take a look at an environment where the 132 perhaps is a clearly discernible resistance level okay and we're gonna assume that market price is down here below that particular price level and generally you'll see this type of action okay they'll take it Up to the 80 level okay and price or retrace pull off very sharply okay and everybody understands if you've been looking at the markets and the ending capacity that the
eighties the 20s and the 50s and full figures are very sensitive psychological numbers okay and if the dealers can bounce price off there they'll trap a lot of traders thinking okay that was the high the market then what happened is every price okay and get folks that maybe didn't Believe that was the high and they think it's still gonna go to 132 they'll more or less by that market up okay but then what they'll do is they'll take the market below the most recent swing low and stop those traders out so now the folks that
think on the short term that the price is going to go to 132 are now scared they don't want to get in the market now so they took those individuals out if they were taken out when that recent move down below the Recent swing low here okay what is below there they're gonna put a protective cell okay if the dealers take the price down below that that sell stop becomes a market order to do what to sell at the market who's going to buy it from the dealers the dealers will buy up that pocket of
liquidity okay and then they'll reprice and they'll take it up to that 132 figure clearing out the stops that would have been wrestling at the 131 94 those that went short here so Now is there anyone short No okay so where do they where does the dealers exit their position that they accumulated here at the 131 90 or thereabouts because that's about rarer those stop loss on the so the short sellers here would have their orders resting so they clear out the pending orders and take it all got to the 132 figure the next repricing
comes in they sell off folks say okay well this is the top of the market place so Start selling okay so they go sort here all of a sudden you'll see the dealers take price back up again now clear out the 132 why because the folks that been watching that 1:32 level once it trades there at one time and starts to trade off they think that's it it's a support resistance is perfect it never never has any blurry lines it's crystal clear laser-guided okay and price is always going to stop right on that zero zero
level it doesn't guys you got to have Some flexibility and wait wait for the sure sign that this thing is going to turn around so when they clear all the way up to the one thirty to twenty level now folks that were looking to sell they're scared they don't want to get in the market now they don't know what's gonna happen why because they watch the guys get blown out here they watch the guys get blown out here and this creates that pattern three drives higher or three Indians as it is in the street smarts
book they'll do a massive repricing they'll take out the swing low here why because there may be traders that were net long in here and got you smart and realized it was probably going to move higher but they don't want those guys in the marketplace either okay so they're gonna drive them and the visuals out as well and they'll take price back above that one thirty two figure or tree at it okay and this is typically when the Market really makes its pattern of going short why because we have a breakdown in market structure after
we clear out the orders that stack around these key levels then you'll see price to amass a dramatic repricing and take out all short-term lows and anybody that would be net long in that position and now they're trapped the next portion is then they'll get you know traders to think okay this is it you know it was false resistance level maybe this was you know One of those patterns where it looked like it was a top but it really wasn't guys so let's get on board and they'll do a real quick repricing up this is
where you get the nice optimal trade answer you sell short patterns okay and that's the one you want to be in and then you see these sustained swings lower begin obviously like most everything I have you know we're not gonna go through that whole long-winded depiction of how Orders are stacked and how dealers work within these key levels but assuming that we had a support level and price started up here much in the same capacity salt on the selling side you can see that unfold on the bullish aspect of trading as well you you you
you [Music]