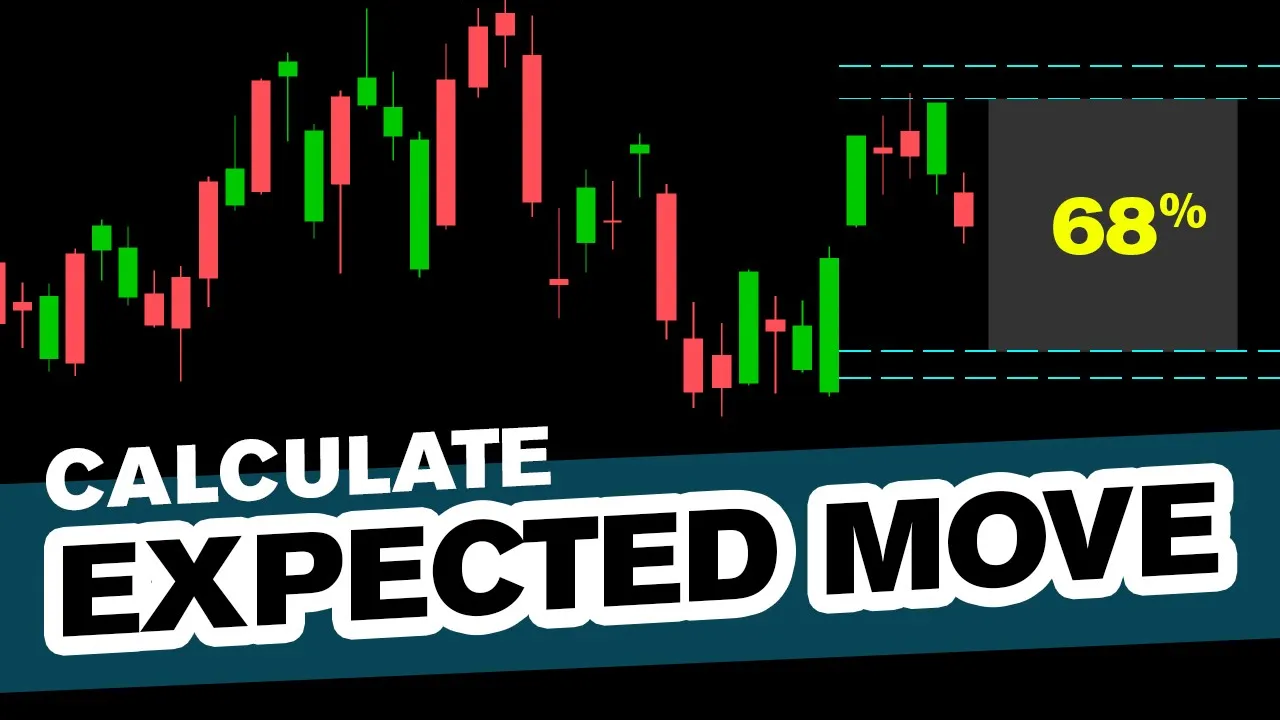
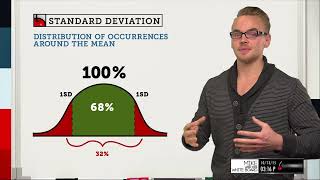
[Music] what's up traders today we're talking all about the expected move what it is and how to calculate it you don't need thinkorswim to find this number but you do need access to the options chain of whatever the underlying asset it is that you're trying to calculate the move for and just as an addition there i would mention that this is going to work best on things that have a very efficient options market not some obscure penny stock with no options volume that trades so that being said what is the expected move in the first place it is the range where we would expect with about 68 accuracy prices to be contained for any given time period now just for some context what we have on the screen in front of us here is the weekly expected move for the s p 500 for the upcoming week right that's the weekly expected move but do know that you can look at expected move over a longer time frame as long as there's an options expiration you can look at the expected move a common one would of course be the monthly expected move about 31 days out from wherever you currently are right that is a possibility here now why is it about 68 accurate well if we think back to normal curves bell curves standard distributions and remember that on a standard curve here generally speaking 34 percent contains a one standard deviation move to the up and down side we add that together and it's very likely that again under normal market conditions we could expect a full 68 uh you know accuracy of this type of reading so back on over to the platform how do we calculate the move what happens in the options chain let's get into that now but one more quick little addition here if you're looking for the weekly expected move please take this reading after the market has closed on friday but before the market has opened on monday when the market's closed is the best time to take these readings not when the options chain is going off the wall so let's go on over to the options chain now here inside of thinkorswim i have open here the june 10th expiration that of course is six days away from today i'm filming this on a saturday this is the options series that expires this upcoming friday thus will be the weekly expected move option chain that we want to look at now if you're using thinkorswim or tastyworks they've gone ahead and given us a really convenient calculation here in the top right hand corner of the chain this is the expected move we're looking at plus or minus 10. 19 but i just said you don't need thinkorswim to calculate the move so how else can you find a very similar number there's three methods that i want to share with you on today's session the first one is going to be looking at the pricing of the at the money straddle now don't worry if that options jargon sounds like a foreign language to you let's break it down nice and easy all we need to do is look at the last traded price the closing price from the friday session for the spy this past friday it closed at 4 10 54. let's go into the strikes now and find what is the closest to that number let's round up here and call it 4 11 because we're above 4 10 50 by 4 cents so the at the money strike would be 4 11.
now to make this a straddle and find the pricing of a straddle all we have to do is buy the call i'm going to go ahead and press ctrl on my mac keyboard and buy the put on the ask as well and this pricing right here 991 is the expected move essentially just based on a very rough estimate of the at the money straddle again you can see right here we are calling this a straddle because that's what it is that is the option structure here if you don't have the ability to press control on your keyboard and add multiple legs at the same time i'm going to delete this you could do the same thing by coming to your 411 strike right click on where it says buy go to buy and in here you want to pick straddle and you'll see the same thing comes up so we have our straddle it is the 411 strike right here it's for this friday which is june 10th and the pricing once again is 9. 91 two ways to achieve the same outcome so just based on a very very quick estimation 991 would be the expected move based on this calculation you can see it's only off by roughly 30 cents from thinkorswim's estimation as well the method number two is going to be an addition or another step here to this exact calculation that we've just done so i'm not going to change anything down below but what we're going to do is add the pricing of the first in the money strangle now again don't worry if the options jargon sounds confusing think about it like this we want to go one uh you know move in the money here so that way we're strangling the last traded price right we want in the money strangled so 14 54 is the price we want to make sure we have the first in the money call and the first in the money put added to the pricing of the at the money straddle i know it sounds like a lot but trust me it's not that bad again on a mac i'm holding control on my keyboard i'm going to buy on the ask the 410 call and i'm going to add in another of the 411 puts what this has done is it's added here both of those pricings together for a grand total of 20 dollars and 38 cents now you might be saying that's way far away from 10 19 and you're absolutely right but think about it like this we've just taken two pricings and added them together wouldn't it make sense to divide this now by those two pricings to find an average between the two and lo and behold if you divide 20 38 by 2 you come up with 10 19. pretty cool right that is the exact uh sort of calculation that think or swim has done behind the scenes just to recap what we've done here and go through it one more time because i know it can be confusing at first glance we're going to delete this we're going to start from scratch we first want to start out with the pricing of the at the money straddle that means finding the last traded price finding the nearest strike price here 411 on our options chain we're going to buy on the ask the call we're going to buy on the ask the put this is our rough guesstimation from here to make it a little bit more accurate we're going to go one strike in the money on a strangle so we want to go one strike in the money here for the 410 we'll add another 411 put as well both of them being bought on the ask you can see that our total debit now is 20 38 divided by two once again gives us 10 19 as that expected move very cool stuff here you can do this with any expiration series that you want as we mentioned earlier if you're looking for a monthly expected move use 31 day expiration options this what we've just done here is for the weekly expected move so those are two methods that i've just shown you but what about the third what's the last method this one's actually quite cool in my estimation because it brings into play implied volatility skew as we know markets generally tend to move much quicker to the downside so the put side of the chain and much slower on the upside the call side of the chain so to account for this what we're going to look for is something that we've called the 16 delta method so on the call side my delta column is right here and on the put side my delta column is right here what we want to do is find the strike price where the delta is 16 cents not negative on the put side obviously so if we come on over to the call side 16 delta puts us roughly in between these two strikes right here if we drag it on over it's in between 422 and 422.
50 let's call that 422. 25 if we look at the 16 delta on the put side that's going to put us somewhere up here it's in between 397 and 398 397. 50 is what we'll call the low end of the expected move now this essentially is telling you what those numbers are so on the downside we should expect a lower limit of 390 750 and on the upside we should expect an upper limit of to 25.
now if you compare that and i've done the math off on the side for us to 1019 basically the difference on the upside let's cover the upside first is that the upsides being muted here if you add 1019 actually i think this is on the chart already yeah look at that so if you look here the difference is the difference in the volatility on the downside so what's happening here this blue dashed line is the expected move that thinkorswim has calculated the blue dashed line above and below here the largest of the ranges is the 16 delta method that we just discussed so overall it is a larger range but notice how there's less skew to the upside and more skew to the downside accounting for the fact that markets tend to move faster to the downside instead of faster to the upside right it's easier for people to panic out of positions as they're moving lower implied volatility is always higher on the put side versus the call side so an interesting little tidbit there now why does this 16 delta method work in the first place here's where it really comes together with our standard deviations if we look at roughly the 16 delta probability of in the money we're again very close to about 16 in the money what's cool about that is if we go back on over to our bell curve right and we add the total of what we have here 1350 and 250 obviously it's not quite 16 but it's pretty actually it is 16 what am i talking about that is 16 of course so 16 is what we have of probability of in the money noting that again because we're looking at that to be the limit we're essentially expecting the 34 percent to be anything inside of that range do you see how that's working there so 16 is this added together and the probability of that option going in the money uh is on that sort of upper tier the second standard deviation third standard deviation so it would be reasonable to expect that the market would want to stay above in the case of the put side that 16 delta strike now the same thing is pretty cool about the probability of touch if you look at this column right here notice that the probability of touching that is roughly between 31 and 35-ish percent there and that makes perfect sense again going back on over to the curve here that there's a 34 percent likelihood that you get somewhere close to this range isn't that interesting that the 16 delta can tell us all of these things and the math works out perfectly so just as a quick recap here on the spy chart itself all i've done is just manually drawn in these lines there's no algorithm that's doing this for me i've come here i've drawn in price levels manually i just adjusted them so they're blue and i've drawn in a rectangle in between and that's how you calculate the expected move let's do another quick example here on qqq okay so qqq is where we want to be looking notice that i don't have any drawings on the chart so we're truly starting from scratch let's go through and do all of the methods that we've talked about so far we are on the qqq you can see that change has taken effect if i just switch to a white arrow here we are looking at the qqq options chain so thank you for bearing with me let's get into the second example here you can see that the thinkorswim calculation is giving us 10. 47 as an expected move okay if we quickly come on over to the chart and plot that out from the last traded price i'm just going to quickly do this i have the calculation off on the other screen uh so 3 16 67 is going to be our upside i'll quickly change this to blue so it's congruent with what we just saw on the spy right so there's our upside of the expected move let's duplicate let's edit that and we're going to change that to the downside read which is 295. 73 okay and we're good on color scheme there so here we go this is the expected move based on thinkorswim's calculation if you want to get fancy as i do in some of the weekly watchlist videos you can come in and draw a rectangle in there as well to represent a shaded area where again we would expect with about 68 accuracy prices to be contained within now how again do we do all those three different methods if we don't have the convenience of thinkorswim's estimation tool up here the first one just as a recap is pricing out the at the money straddle so how do we do that we look at the last traded price here on the friday session if we're looking for that weekly expected move 306.
20 that of course is going to get us closest to 306 as the at the money strike we of course want to buy on the ask the call and buy on the ask the put and this pricing right here is going to get us pretty darn close to what we're looking for you can see in this case off by again roughly about 30 cents just for round numbers sake right we can go ahead and further improve the accuracy of the reading by adding in the first in the money strangle again all you have to do is come one strike in the money so 305 and then we'll go back to the 306 that gives us 2093. when we divide that by 2 we're going to be left with 1046 right 1046 is your read there and what does that look like in relationship to this off by one penny off by one penny pretty darn good method right so 2093 over two off by a penny from thinkorswim's fancy proprietary calculation and again all we've done is added the pricing of the at the money straddle the first in the money strangle and divide by two that's the second method right there and then if we go out and do our sort of um 16 delta method right we're looking for the 16 delta look at that it shows up perfectly on the put side you can see that right here that's going to be your 293 on the downside and on the call side where is our 16 delta it looks like it's right here showing up perfectly as well and for a number that's going to be 318 on the upside so 293 and 318 we're going to add that to our chart here i'm just going to quickly duplicate oops we want to duplicate not edit duplicate and then edit there we are and what we want to do is add in our 318 for the call side and we'll duplicate this one and edit this one on the bottom as well oops edit here we go and we were looking at 293 on the downside from the 16 delta method and again you can see the difference here the skew on the put side is calculating more risk to the downside than there is to the upside okay so this is just a secondary example on how we can calculate expected move on the qqq you can do this for anything that has a fairly liquid options chain if we really want to push the bet here and go one more example aapl is another good one here just because the options chain is so liquid we'll come on over to that options chain now again we're looking at six days until expiration this is the upcoming friday we'll move a little bit quicker here through the third example six dollars and six cents is the expected move from the platform itself if you don't have thinkorswim you can price out the at the money straddle which is going to be buying on the ask the nearest strike uh excuse me i did this wrong notice that our pricing here is 145. 38 so we want the 145 strike buying on the ask and buying on the 145 ask for the put that's 570 again off by roughly about 30 cents on the rough approximation there if we want to take it one step further we can add in the first in the money strangle so we're going to go one call up here and we're going to add in another of the puts there at the same level that's 11.
97 over two which is going to give us a rough number of 598 okay and that's getting much closer to that six dollar and six cent mark so that's a pretty uh good approximation there and if we quickly take a peek at our 16 delta options let's go ahead and close that up 16 delta is going to be in between here somewhere so let's go 137 50 on the downside and 16 delta on the upside is going to be somewhere in here looks like there's quite a bit of discrepancy between the 150 and the 150 250 strikes notice you have 25 and 15. so let's just round up ever so slightly from 152 and go with like a 153 okay 153 is what we'll use there for a upper edge of the expected move if we come on over to apple's chart itself i will quickly plot these out for you i don't mind if you tune out again we've gone through some decent examples so far i'm just going to round it out by typing these in manually here on thinkorswim so the upper edge of the thinkorswim expected move is gonna be 151 and 44 cents there we go we'll press ok we'll change that just so it's congruent with everything we've done so far good let's duplicate that boom let's go ahead and edit the properties and the low edge of the expected move based on the thinkorswim approximation of 606 that we just saw is going to be down around 139 and 32 cents okay so let's press ok good and you'll notice again our closing price is halfway in between there's about a 68 chance 34 on the upside and 34 on the downside that we remain in this range again we can add in our nice convenient little shaded box if we do something like this just to give us a better visual representation and what we'll do as well is we will duplicate this we'll act excuse me edit and we will just pop in that 16 delta approximation which on the upside was 152 50.


![How To Use Market Profile [START NOW] | Trading Tutorials](https://img.youtube.com/vi/bpravMgflLc/mqdefault.jpg)