you are only as good as what you trade obsessing over one stock and trying to master it may be the worst thing that you are doing as a Trader and may be killing your gains in this video I'm going to show you how Pros select stocks I'm going to give you the criteria that you can look for to fit a smaller account and I'm going to cover the tools that you can use to find the best stocks and this is episode three of my small account challenge you may have spent years trying to Master One
stock or one index or one commodity whatever product it is the time that you've put into mastering that one may be actually what has been killing your trading career when I first started I saw people trading us30 and individual indices and they talked about mastering them generally in the social media space you'll find people that paint that picture to be profitable but the pros that I've met they taught me that you should scan the entire market and look for your individual setups that pay you every single day and this was a game Cher for my
trading career so many Traders get chopped up in periods like this when the market is just ranging right generally when Traders focus on one instrument one ticker one symbol they find themselves making money when that ticker is on a strong uptrend or downtrend um but often times they give that money back when you have months of a ticker being in in in a Range so if you look at something like gold for example there were long periods of time where for months you have this um you have this range months and days of just of
ranging activity here so generally during the times when uh you you have an uptrend a Trader is making money but when that Trader hits the period where uh there's a range and there are no Catalyst to indicate that we should be coming out of that range it becomes difficult for a Trader to um understand which Direction they should be trading in and generally this leads to Major Chop on the flip side if we are to search the market every day for those stocks that are giving us directional skew this is what will lead us to
have more profitable days if we search the market for stocks that are going to go up 20 30 40 50% even 100 300% at times this is how day-to-day will have two to three setups by trading this way and not just focusing on one ticker that may be ranging or chopping we can stick to the moves that give us the best outcome right so that's the philosophy here now how do we find these tickers there's two ways that I do it so stock selection is 50% in my opinion of the battle now let's talk about
what moves a stock if we have a stock that's moving in a Range generally what causes this to happen this is generally caused by some sort of Catal catalyst so when there's a catalyst there's going to be a few things unusual volume okay so generally if the volume is X uh during this time generally now the volume may be 5x 10 x 100x the normal volume right we want to find the the best of the best have a catalyst uh either it's an intraday Catalyst or there is a theme that's driving the market for a
few days or driving that stock for a few days or even months at times right so a few signs that we're going to look for is that there's a catalyst there's unusual volume or there is a higher percent gain let's say maybe this thing has moved 10% right 20% so generally all of these are signs that the stock is in play and that it's a stock that we want to trade so how do we um do our stock selection process right um one it can be done and this is the this in my opinion is
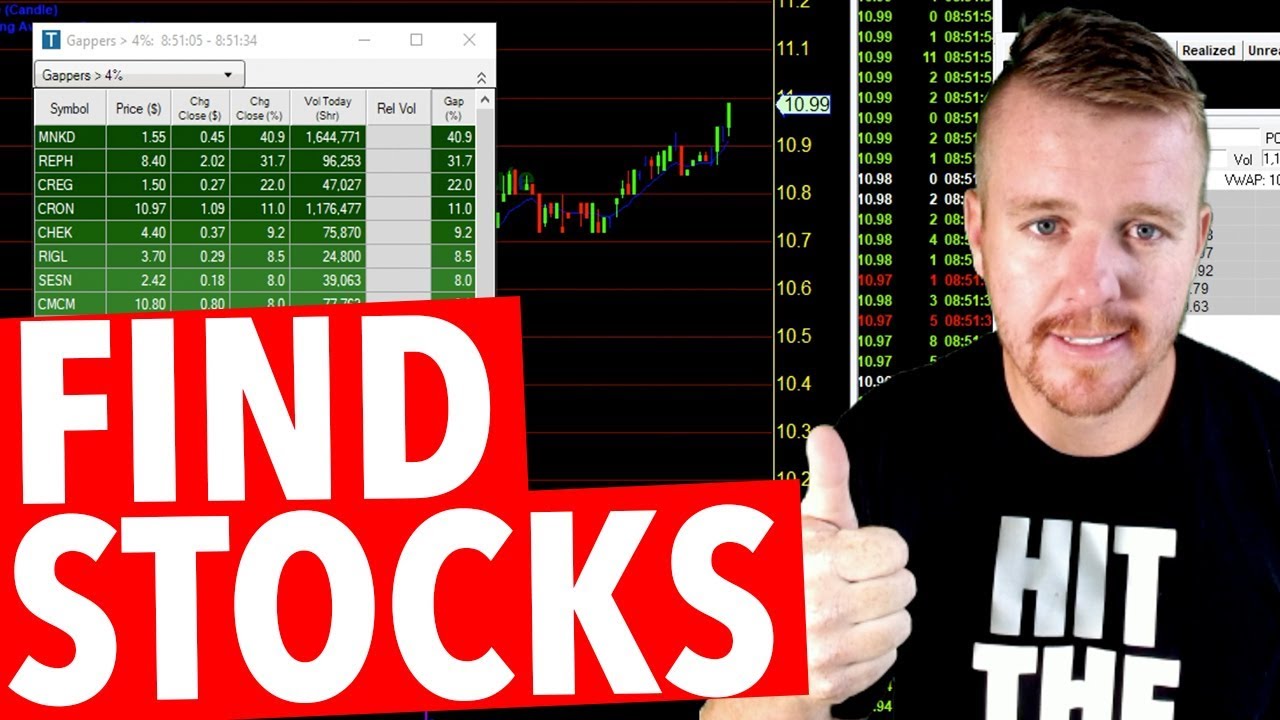
the easiest ways right so we look at the top gappers and top gainers there's more to share here but here generally if they if a stock is up 70% if a stock is up 100% you're going to have one or both of these you're going to have unusual volume in most cases very rarely you won't and you'll have a catalyst so you start there okay so we we look at the top gappers the top gainers and then we want to look at the volume okay to see if it's un usual volume this shows that uh
there's interest there there should be a running dialogue in our head at all times and we should be asking ourselves what stock what ticker are people rushing into okay quick example so right about here this stock is up before the Market opens up 150% for certain this stock had a catalyst and unusual volume now this stock goes to run up after the Market opens in total this stock moves up 500% okay so generally what we want to know and what we want to see is that you go to the top gainers look at the top
gappers okay and you look and see if they have a catalyst and you look at the volume and from there that's where you start your selection process okay so now once they're on the list then we need to refine our search okay so uh this is the $500 challenge I have $500 account and six times leverage so I'm looking at $3,000 in buying power okay now let's say on average I have a 30 Cent stop now and I'm going to risk about $50 per trade in the beginning so what we're looking at is $50 per
trade divided by 30 cents all right now this will give us about 166 just rounding now we need to be able to then take that 3K divid by 166 and then this will give us the maximum price or so that we can afford all right so this is how we can do it right so stock price times 166 okay that should be less than or equal to 3,000 all right so we divide 166 and this will give this our stock price so here we land at about $18 so our stock price has to be uh
less than our equal to $18 right so we're looking at trading stocks between a do and $18 and $8 $ is on the higher end and it'll tie up all of our buying power okay uh in the beginning until our our account grows so now if we come back over here we can add filters one of the filters can be that we want to trade a stock that has about $18 uh between a doar and $18 next now let's look at the scanner this is trade ideas this is currently my favorite uh scanner so this
one has about 2 million float okay 2 million shares here we take a look at it um and this is this is uh today so s& the total volume was actually much higher uh on that day so if we go over to trade ideas and we look at the scanner when to use s&i as an example so here there's already stocks this stock is almost up 500% at 9 Eastern okay before the Market opens 425 per this stock so s& actually was up 173% right and if we look at at the float the float is
actually 2 million this is low okay this is showing today but uh on that day though the total volume traded was much higher uh than the actual float that was available right highlighting the dynamic uh between supply and demand this may have been at like 10 million or so right that potentially can be greater the man the supply is around 3 million but the amount of shares that are traded are much higher that shows that there's a lot of interest so we go back to unusual volume this is a sign of usual volume so if
you're if you you're used to trading indices and you don't have this type of information and sometimes you jump in because you see some price action and then it goes against you a lot of that is that you're missing you're missing data that will help you make even better decisions okay so we're going to look at at least five times our wall okay we want to be looking at something that's probably at least 20% up on the gainers list or gappers List Right some days uh things can be kind of slow um but something's up
20% then it's likely that we want to trade at that okay and these are the better price stocks for smaller account sizes so one more note about volume here right okay so if I bring this over and we look at the relative volume you see it's at 0.22 relative volume measures the current trading volume against its normal volume over a given time so if we see price action with s& right now now today and the relative volume is not even at a one that means it's not compared to its average trading volume over maybe let's
say like the last 14 uh 20 days that means that there's not uh comparable interest right it's not even one to one but generally we want this number to be five times 10 20 40 times the average volume okay so this will help us out when it comes to uh our selection process you may ask why do all of this why search all these different stocks why use the scanner why not just focus on Nvidia or Tesla or one ticker there are three reasons number one is most of those stocks are dominated by institutions and
dominated by algorithms so it's hard to read the level tape it's normally not meaningful number two those stocks are generally range bound so if we look at something like apple you'll have these periods where there is a run right you can take advantage of those when there's a catalyst but you have these times where you know this is almost 20 days of Apple moving uh sideways right um nasty price action this is almost 30 days of nasty looking price action look at this terrible you'll you'll get you'll sit here trying to uh trade it and
get chopped out in most cases right um so instead of just sticking to one that may be range bound and may lack volatility and Direction uh we can move move around finding stocks like pltr which has been on a major uptrend right because Catalyst themes that are behind it you have this major run uh that's happening right um an intraday stock major Gap up to the upside because of earnings right so it'll be better for us to move around find those stocks that are lower priced that we can get involved in um and then for
example SoundHound AI okay this is a another one that started to run right uh fresh news and the theme uh the quantum name started to run up right so it's not about finding the popular stock it's about finding the stock that's moving today the one that's going to have momentum that we can just take a little bit uh take a little piece of so through throughout the challenge I'll probably trade 20 30 40 50 60 70 different tickers maybe cuz I won't be married to one ticker I'll trade whatever is in play and that's likely
going to give me my setups before we talk about tools I want to cover another way to select stocks that may be harder for beginners but I want to make you aware of it and it can be very lucrative but generally I find that this way uh is for stocks that may cost May uh be higher priced so this method is uh using a scanner and we're looking at technicals data variables this is using news outlets sentiment and starting from there we can have ideas for example we traded djt okay why were we trading djt
all the way up until the election because Donald Trump was running right so the sentiment around djt uh was one that was positive or hopeful this appeared on the scanner sometimes but generally the trading that we did here was based on sentiment we we selected that stock because of the the context right another one um is Tesla for example okay so Tesla Elon Musk was supporting Donald Trump's campaign so this one was in play other stocks like after the election we had Bitcoin was um Bitcoin was blasting up right so you have several companies that
mine Bitcoin or have Bitcoin Holdings that were in play like one like mstr for example okay so you see you see this stock blasting and following Bitcoin okay so there are two ways right one is with the scanner using data attributes and to me this this one is a little bit easier for beginners the other are all based around themes right we had in late September the Chinese stocks rising up because the Chinese government had made some monetary policy changes uh that caused a great rise you can look at JD you can look at baba
um you can look at uh other Chinese names that all Rose and we took advantage of them and then they short it like crazy right so uh those are two different ways to select your stocks all right now let's talk about tools we're going to talk about free tools and then paid tools in the beginning I would say go free as much as you can and then go paid when you start to make a little bit of money or you feel like you need to invest so the first tool is I would say if you're
a US Trader and you use thinker swim okay thinker swim you can build a scanner you can get the top gainers and the top gampers so another option that is quite free so you set up an account with them you're good to go finis is another one where you can build a scanner for free but it's delayed by 15 minutes so another option is to use trading view many of you already have a subscription so you go down here to the stock screener um you can look at there's a top gappers and the top gainers
right that's already built and you can you can uh build a top gappers they have some other scanners that you can use here alltime high alltime low New 52 we High these are all beneficial to use because if you're looking for a daily breakout or a breakout from a strong level these are things that you can actually use technology to help you with so you don't have to scan the entire Market okay now one of the paid solutions that I like to use is trade ideas okay so trade ideas has uh you can build your
own scanner here where um but out of the box they have these different channels like they have the explosive winners okay explosive winners these are uh the game gers gainers from the open gainers for the week okay um and as as time is going on um they'll be the these will be updating right rapidly okay um they have charts they have um a lot of the details that we'll be looking at like how much total volume is traded here uh the amount of float that's available the shares that are available to trade all that will
be here um and it's a really cool way to see the top gainers they have a pre-market scan right and this is where you can see the top gappers okay um the top gappers that are on the list and generally what you can do in here is you can come and configure this and you can add the filters that we talked about right so if you look at the the gainers list right here we have some prices that are you know a dollar so I'm going to expand this um so here this gapped up 36%
33 22 20% right so so avgo was $218 RH is $434 so these are out of the price range you don't even want to see them you can add filter here right uh then they have a momentum scanner that shows you the stocks that are that have strong momentum right and you can use you can save all of these different Windows to build your own dashboard that will help you speed up your stock selection process right they have a after hour scanner momentum scanner uh and much more earning scanner and more so I've built myself
a dashboard that I use every day to make my stock selection quick and fast so I can hurry up uh find the stocks that I want to trade build my game plan and then um then I can just uh get busy okay so you'll see a lot of this during the challenge please like And subscribe and share if you want to see episode one of the small account challenge watch this video [Music]