All right guys we're going to be looking at a ipta data range example and we'll be focusing on the australian dollar now if you've noticed we've had a little bit of a run up on aussie and we're gonna break this down a little bit in context why i was expecting the the levels that we're looking at now to be hit looking at the charts that we share on The forum so if you're not paying attention to those charts or if you're not saving them it might be a good idea while we're doing this month not
that i'm encouraging you to do this throughout the mentorship but when we do daily reviews i'm taking you basically to the points at which i'm drawing my attention to on my own journal how i have reference Points on my own charts what you see me noting on those daily entries on the forum there are the points at which i'm keeping focus in my own journal and any salient points that would be in addition to those levels i will make in terms of commentary but the the month of january when we do these daily entries where
i do the dollar Index euro dollar british pound us dollar dollar cad and aussie dollar when i share them with you don't just click on them and wait for some kind of a neon sign and say buy here sell here i want you to be focusing on what i'm drawing your attention to and then watching how price moves to these levels regardless of what type of trader you're going to be you're going to need to be Focusing on how that happens from beginning or from foresight to when now we can talk about it in hindsight
because all these things are going to help you prepare yourself for when you anticipate something and then waiting throughout that process because it's not is quickly learned by simply looking at a hindsight example where i can say okay this is what we said the market was going to do this is where we thought the Market was going to happen and here it is bang when you see it in the charts and draw your attention is drawn to it beforehand there's a submission to time that's required and unfortunately we gloss over that many times even as
educators like myself it's hard to communicate what's required in terms of having to wait for that thing to unfold or develop in the chart Just simply because we have a level or an order block or a target even for price to get to when you show a hindsight example it that part of the lesson which in my opinion is the that's the main that's the main point you have to learn you have to learn to wait for these things to unfold the impatience that the market presents us an opportunity to experience is overwhelming sometimes and
While i'm many times accredited for being very patient i am not really a patient person at all i'm very impatient uh that's the reason why i don't do long term position trading but i'm going to counsel you to go in every single day when we do our daily entries for the content whether it be a video review or whether it be a a teaching or if it's something along the lines of just simply Providing the charts you want to be really copying those charts printing them out make you hold me hold me to the standard
of if i know what i'm doing then it should be evidenced in this okay for you for the most part we've seen many times that occurring but for your learning you need to say okay this is when this was noted this is when the observation was made so how long did it Take for this to occur now since january is focused primarily on the daily chart obviously each daily candle when it paints and closes for the day it obviously takes 24 hours to do that so yes we can glibly say it takes 24 hours for
this candle to form and this is what it takes in terms of uh the setup or level being reached Over this period of time it could took three days or four days or two weeks you need to experience that you need to be being mindful of how long those things take especially on these higher time frame charts if you don't do this and you're new or you're just a relatively inexperienced trader some of you that are in my group that have been trading for a long time Know exactly what i'm referring to there's a big
gap in between learning something with examples in hindsight and textbook and even being taught something in a webinar or a workshop live where people say this is what happened in the marketplace it's missing that element of having to endure what needs to be weighted upon to come into your chart you can't just simply say okay well this is the outcome i'm expecting and therefore you know it Needs to happen on my time that's the part that kills traders it was very influential in my early days as a trader because i i needed it to happen
right away because i first started trading things were moving quick there were fast markets and then when i realized that it wasn't like that always it was a very big struggling point for me so just go in every day gather those charts Up print them out keep a running log of them in fact it's probably a good idea just to print them out every day and just get yourself a three ring binder punch some holes in it date them okay and then keep track it's a good reference point to go back on saturdays and sundays
on the weekend when we're not really doing anything go back and look at what was observed before the fact and then how long it took for these things to develop and Those levels to be reached and what was the response after it got to those levels okay so it's important you go through the mentorship with that in mind i'm not just showing you trophies or you know just things in passing i'm really trying to draw your attention to something that i want you to focus on and study how long it takes for these things to
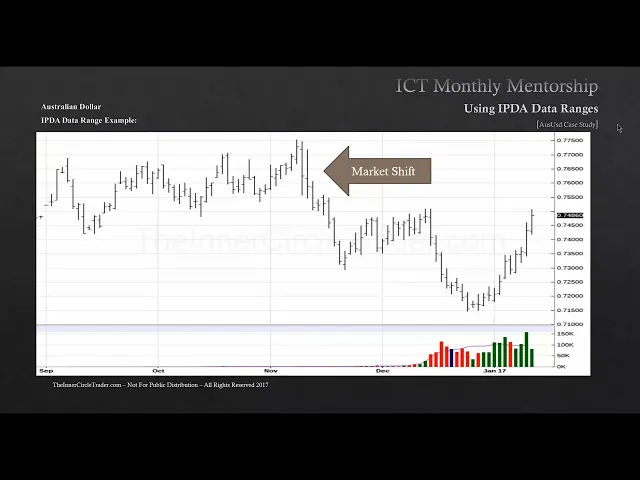
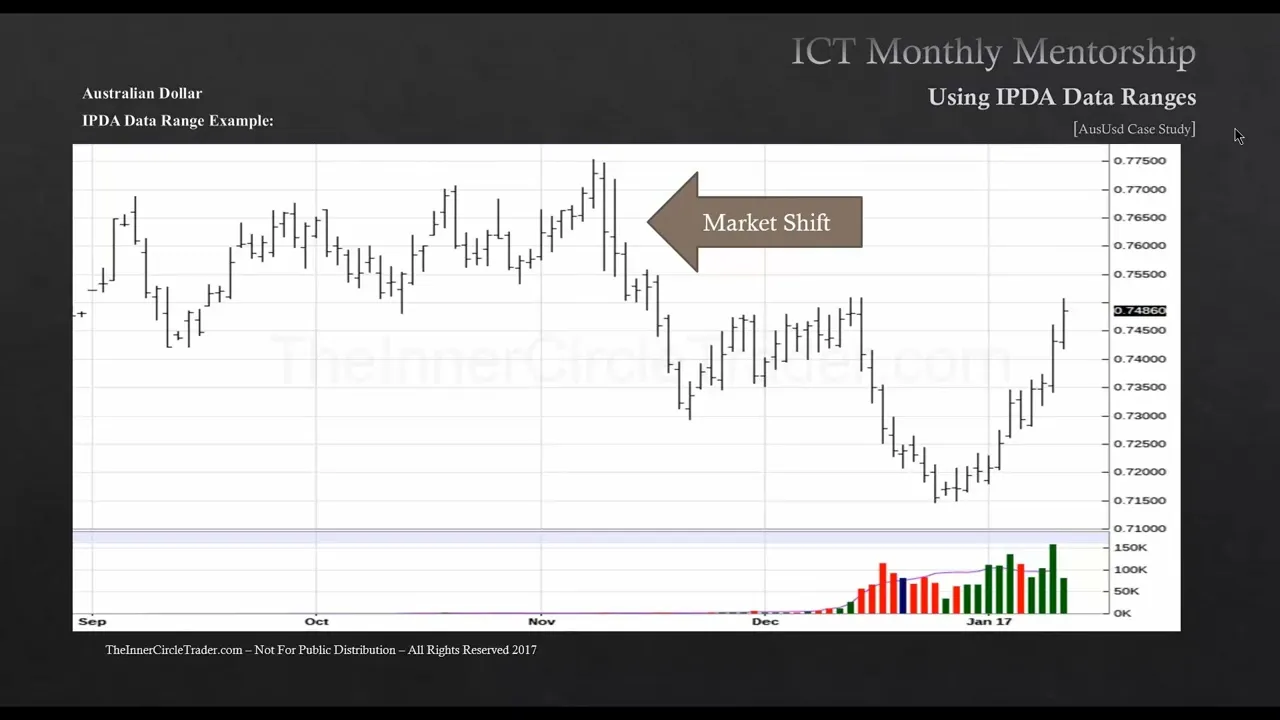
come to fruition Okay so get it let's get into the australian dollar example where the if the data range all right so we have here a futures chart okay this is the march contract the underlying daily chart of the futures contract of the australian dollar and by looking at the futures contract if we're going to be trading forex okay it's it's really important that you know that you can get a lot of insight just by studying The underlying futures price so since if we're looking at the australian usd pair as our case study we're going
to be looking at how influential the study of just the futures contract alone how that's paramount and understanding how that moves right into and segways beautifully into trading in the foreign exchange market if i were to do a poll right now if we were all in the same room together okay and we simply said Hey look um i've never traded forex or i've never changed futures if you were studying one or the other i guarantee you a large percent of you probably 80 or more never really refer to the opposite in terms of the analysis
so what i mean by that is if you're a futurist trader you've never considered what the foreign exchange markets doing or if you're a Futurist trader i'm sorry a forex trader you've never considered what the underlying futures contract is doing vice versa it's imperative that you understand what they're both doing to get a complete picture you want to be looking at both now obviously right away one's going to assume well it should be obvious it should be the same thing because the australian is leading the payer all of You versus the dollar so therefore the
australian underlying futures contract should be in fact the same thing we see in the foreign exchange market and by far and large it that's true but there are certain data points that you cannot get by looking at the foreign exchange market there's simply no way of getting that because foreign exchange doesn't give you volume it doesn't give you accurate volume like you can get volume from the underlying futures contract And we'll talk more about that as we go but i want you to take a look at this chart here okay and i'm looking at a
little bit less than six months i wanted to show just this data range because outside of this the chart becomes spotty because it is a futures contract and it's march delivery that means prior to march we had december's contract and that's already uh expired and now we're trading in the nearby contract which is march 2017 australian Dollar when we taught or rather when i taught the ipta data ranges okay obviously i i asked everyone to hold off sending me emails but some of you were just overzealous and want to know it right now and these
are things that are going to be building on your understanding as we go through the mentorship especially through january but i want you to focus when you look at your daily chart just simply go through And look at the last three months okay start whatever whatever time point you're looking at like right now let's assume we sat down with charts right now and this would be the first day we're looking at australian dollar we're a brand new trader brand new to the concept we're sitting down how will we how would we go about looking at
where the ifta data ranges are and if we're looking at australian Dollar you want to go from today's uh candle which is what's being painted here that and it's not a can i know it's open high low close but you have to suffer through that okay because i had to get these slides together and i promise there will be candlesticks shown but for now i want you to focus on this because the open high loan closes Important the most recent market shift okay in the last three months occurred back in november now i know some
of you that are hardline critics are saying well here we go again this is the hindsight thing this is where hindsight is gold you need to know what i'm going to show you in this teaching because it will clarify what the if the data ranges are Actually supposed to be doing for you some of you are thinking that it's going to call the high and low 20 days 40 days and 60 days away that's not what happens sometimes it can hurt sometimes it can occur but that's not what its job is okay the the question
that comes up a lot is when i'm looking for a order block to buy one or if i'm looking at an order block to sell into or if i'm looking for an area of buy stops or sell stops Which one should i expect them to go after which one are they going to respect how do i know if it's not going to keep on going through an old high and not be a turtle soup cell all those scenarios and those ideas while i told everyone in the beginning if you were just patient and waited and
all those questions would be answered but some of you are just really really impatient and i get it you're excited and you think that you're not going to Learn all this stuff in the remaining time of the mentorship but trust me i'm committed you will learn it there's tons of information coming to you but you have to let me go through the process of teaching it this isn't the first time i taught this stuff to trust me i've been successful in the past doing it okay so just go along with the process but if we
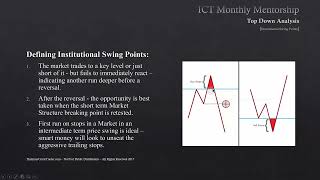
look at back in november we can clearly see that there was a major market shift in november 2016. Now what that does it gives us a great deal of insight we can't take a time capsule travel back in time okay and be back in november and go short there but we can use the information that our daily charts are telling us there that means there was a great deal of displacement by the large players or smart money when we see that in november what we're seeing here is the underlying futures contract of the Australian dollar
has a market shift right there that's a quarterly market shift over the last three to six months that's the most obvious one you can clearly see it if i was to ask everyone if you're all in the same room raise your hand if you can clearly see that that is the most obvious market shift in the last three to six months everybody invariably would raise their hand they would click Obviously if you can see it you can't deny it that's what you're looking for every three months there's going to be something like this occurring it
could be a sell-off creating a high or it could be a a low where it starts to rally but every three months i want you to look at your charts and anticipate finding that in hindsight now great that's wonderful you can see It in hindsight what do you do with that information see this is what i have an issue with like with elliott wave and all these other very they're just very highly subjective if the market really is influenced or controlled by smart money or if there is what i'm telling you there's an algorithm that
controls what price is going to do it's absolutely not random it's predetermined it's it's Running on a script that refers to specific data points that it will go back to over and over and over again the ipta data range okay you have a 20 day look back and cast forward range you have a 40 day look back and cast forward range and then you have a 60 day look back and cast forward range What i'm suggesting to you is if you are looking at price and you see a for instance they have a market structure
shift here and the quarterly shift occurs in november that means that now the market is in a cell profile from that point until it gets to a level of significant counter direction what would cause it to change direction or consolidate that's the other thing that's the vague green uh not green but gray area in the analysis Sometimes you won't see a clear retracement or correction opposite direction for instance it's been going down november it could have very easily been consolidating here going into january okay into february it doesn't need to be a counter trend move
like we're seeing unfold here since the last week of december it can be a consolidation and as we go further into the content For the january uh delivery of the information we'll talk about when it does or when to anticipate when it's going to go into consolidation and not have a a counter swing so back in november we see that there's a high made what's what's really going on that low here is broken so we have a shift in market structure and it breaks lower we know that we can see it because it's Taken out
an area of equal highs and we pierced above that taking out the buy stop liquidity pool and that's seen here that was the that was the basis and the framework around what caused the market structure shift that quarterly effect comes in uh to operation at that moment okay where our eyes go immediately back to november because you can clearly see it when you see that and you delineate that In your chart what you're doing is you're now identifying the beginning of november so you have to have a basis point where where is it where did
it all begin because if you don't get yourself in sync with what ipda most recently did and ipta is the interbank price delivery algorithm that's for your notes again you're going to delineate where the most obvious one in the last three months has been Then you're going to cast out 20 days go forward from the beginning of the the month that that market structure shift or quarterly shift takes place you're going to count out 20 days now it may not even be 20 days you may look at the chart and say hey this is an
obvious one right here something's really going on if you do that you're really doing too much anticipation You got to go back to the most obvious one and it may require you going back three months but find the most recent one where the market structure has shifted and there was a move that took place that was obvious bullish or bearish okay and it's really easy if you just divide your your daily chart into uh quarters like put one put a line on march put a line on uh june and september december and just keep doing
That your your eye will go right to where these uh quarterly shifts are happening they're not going to always occur on those months there's a little bit of gray area which is the reason why we have a look back and cast forward the ipta data range okay what it's really doing is it's highlighting you as the trader you're going to try to mimic what this algorithm is doing it's looking for The liquidity in the range of 60 days in the past where is the sell stops in the last 60 days where are the buy stops
in the last 60 days where are the fair value gaps where's the price gaps that price has not been efficiently delivered in the last 60 days where are the the liquidity voids where price has only Been delivered on the upside where it has to come back down to efficiently deliver price and balance it out by going back down and closing in that range optimal trade entries that's where that comes from where are the equilibrium price points does it have to return back to equilibrium did we get too far ahead of ourselves do we extend too
far do we Have to come back and retrace minor retracement before we see the next leg lower by looking at the market structure shift that takes place in this november time period we are in instance saying that this is a quarterly shift therefore because of the daily chart this is going to give us insight about what the market should do on a three-month timeline as much as six months But i like to just remind you that i'm only really looking for about three months horizon time horizon that far out i don't like to look beyond
that there's many many times i can show you in journals where i had it right but i really just because i had it right doesn't mean i was executing on every trade but many times i'm really accurate in about four to six weeks time horizon and it's about the half-life of a Three-month cycle so if i think that the time horizon is consistently derived at by looking at three months out by using the daily chart like this that's my belief i'm firm in my belief that i believe i can teach you how to do that
and have a three-month horizon by having that that is a great deal of opportunities for all disciplines of trading long-term positions swing short term intraday Scalping all that stuff can be done effectively by having this time horizon but when we find the clear market structure shift that happens every quarterly every three to four months or so we find it we identified the beginning of that month you gotta roll back to that first month why are we doing that why does it have to go back to the first month first of the month rather because if
an algorithm and i'm not sure if any of you Are aware of how computer programs are made or designed but when a systems analyst sits down with a company and they say okay look this is what i want the output to be or i need a a report generator that's it's going to give me this outcome or i need this information or i need this computation made i need this process done okay the system that's a system analyst Is going to say okay what what data points are you making available to me so i can
sit down with my team of computer programmers okay and the analyst will make a documentation stage where he sits down and outlines the overall macro process now because of what they're dealing with they are taught and learn computer Programming to some degree but they are not doing the programming they put all of the context around what is supposed to happen what processes are there if this is done then this should be done as well what checks and balances and it's basically the documentation stage of the process of a computer program then the computer programmers take
that information and they actually code it Out now a computer program and a computer programmer is completely utterly blind and useless if he doesn't have data points to use you can't have a computer program do anything of any value unless it knows where to draw data points from there has to be an array of information coming to it to process and do calculations so my here's My this was my epiphany okay when i was sitting down with the folks that were introducing these ideas to me and know they're not in the teaching circuits you're never
going to meet these people okay but when i was introduced on how the markets actually work and operate the the fast thing i the fastest and most obvious thing i learned was There was no ambiguity to how price moves around there was no randomness because they were talking about things that had a finite or origination where it wasn't like it could have been this day it could have been that year it could have been this month no no no no it's absolutely nothing like that if you understand that we're going to be Referring to things
that are numerical they are price related they are value based that means that we have to look at a specific level and price but how does the algorithm go just to end the old price how does the algorithm know that yet that that's where the large fund stops are see this is what's taught and permeated In the teaching uh circuits in in education for trading they teach and i've said these things before but i used it to communicate to you the idea because most people don't understand fund level trading they don't understand institutional trading they
don't they don't know those types of things they just think i got an account with my broker so therefore i'm trading and if i get stopped out it's my broker that did it to me and many times that's true But the delivery of price from the central bank level that movement that repricing is really not always but on the short term it's being repriced to take into account for large liquidity pools that are available on the large fund trading realm not your little mom and pop fxem not your owanda none of those none of Those
things okay are obvious or on the radar screen for what i'm teaching you here but they are in close uh they're basically in alignment with the same thing okay but they're this these movements for these runs on stops they're not looking at oh here's michael stop okay here's uh john jones from uh allentown pennsylvania stops okay they don't have that type of information they don't see you they don't have any Identification of you they don't have any identification to retail at all but because these ideas are taught across the board the same way because it's
been put out there to be done this way because eventually if you're if you are an accurate trader that's a retail based trader okay eventually if you're profitable to some degree what eventually happens to some of these people they get Very high-minded of themselves they think then they're great at what they're doing so therefore they're profitable and the first thing they want to do is prove it to the world by having everyone else give them their money and they're going to be a trader that manages funds no one wakes up and is born a large
fund trader they come up through the ranks of being a profitable retail trader so are they going to come into that realm and change The way they've been doing things absolutely not it's the same thing they're going to do there then the difference is they have a process on the fund level that they have to go through specific parameters and guidelines and stay within these to be compliant with whoever is running that uh that operation behind the scenes in other words just because you're a large fund manager unless you're operating alone and independent if you
go to work For an agency and you are a fund trader and you're managing under their umbrella then you have guidelines you have to work within there's there's rules and things that you can't do outside of these or you're you're you know you basically get canned you're out the door you're gone you can't manage anything don't you know they'll expel you but these ideas are the same so how can an Algorithm or a computer will just say it like this how can a computer program know where everyone's stop is it has to have a range
of data now just because we have the the numbers of price the value of price okay they have to have a look back period the look pack period is 20 days 40 days and 60 days and what you're doing is and this is what i want you to do with your your time after today's teaching while you're Waiting for today's daily recap video because there'll be two bits go up this is the teaching video for today and then we'll have a daily review where i do like 10 15 minutes talking about what's already happened and
i'll give you the charts and stuff to study i want you to spend your time this evening okay and even tomorrow while we're not doing any live session go back through your Charts and don't just look at the australian dollar look at every currency pair look at every commodity look at individual stocks look at indices and you'll see quickly by studying this it will become quickly clear that there's no randomness to it there's a specific pattern that this thing does all the time now it used to be a manual thing where the market maker was
a real person they sat there and they worked with a team of individuals That manipulated price to do these very things but because everything has become so streamlined and efficient by artificial intelligence ai the uh the effectiveness of algorithms okay that's been implemented now it's much more efficient to do that and there's no emotion it just does what it needs to do so if it's a computer program or i'm quoting with my fingers now the interbank price delivery algorithm that computer program we're going to call it From this point on for this teaching for it
to be effective it has to know where to look at to find stops they don't see orders that's not what's going on they don't see orders the orders are executed on by the traders at the bank level the algorithm just permits the price to Move to that level which gives the opportunity for the traders to execute on that run that's the real story that's what really goes on everybody else out there in this industry will tell you well it's this happening and this this guy here he's he's pushing a button and it's doing this to
have no it's not it's not that's not what's happening at all the algorithm will look back 60 days and it'll find it's very easy if you if You know anything about computer programming and you don't even have to do that but just look at this first of november if you look back 60 days in the past what was the highest high in the last 60 days there's going to be buy stops above that high what's the lowest low in the last 60 days there's going to be cell stops below That low in the last 40
days what was the last highest high and what was the last lowest low looking back in the range to the left from that november red line that we're dealing in november where are the stops below and above those highs inside of the range of 20 days 40 days and 60 days now i already know what some of you are thinking What happens if there's a low that's really really obvious that's just outside the range of 60 days that's the farthest extreme that's when the open float will move aggressively and go outside that normal parameter of
60 days and you'll see that big run the market will jump and skip right down into that old low that's just outside that 60 day range how do you know when it's going to be an Explosive move michael when you have that scenario if the last 60 days if they've already ran out the the stops below and low in the last 60 days or above an old high in the last 60 days and there is a larger higher high or lower low where the stocks will be resting above or below respectively then you know there's
going to be a big run on price and they're going to run for that liquidity Because that's the only other thing that's left the large funds have their orders above and below these old highs and lows you work just like the algorithm will in a 60-day range look back the last 60 days and then you watch going forward you cast forward 60 days and you can literally have this on your chart you go forward count forward 60 days you can literally go on your daily chart in mt4 And change your date 60 days forward to
make a vertical line and that way as price starts to paint you'll know you're approaching that 60 day that means it's going to be forming some measurable intermediate term high or low before that time and it's going to create a liquidity pool above an old high or below no low that's going to be influential for future Trades the same thing occurs by looking back on the last 40 days to the left of that november 1st look back 40 days what was the lowest low what was the highest low i'm sorry what was the highest high
rather and the lowest low your buy stops above the old high and the sell stops below that old low inside of that range of 40 days that's where ipta will look for that liquidity now it's not giving you directional bias yet I'm telling you it needs to use these reference points to find where the stops would logically be see the ai cannot it can't think for a human it can't do that but because human nature says that we will as traders put our sell stop below a low and we will put a buy stop above
an old high that's all the algorithms doing it's seeking to take price to that level When it gets to that level then your broker then the central bank can do a wild spike and send it above 10 to 20 pips think about it now 10 to 20 pips then becomes logical why they do those big spikes okay intraday 20 and 10 and 20 pips above and over high then it stops rate many times rate at 20 pips or 10 pips and then rejects it goes the other way It first has to get to those levels
based on a daily chart in the realm of a 20 pip 40 i'm sorry 20 day 40 day or 60 day look back and then cast forward so really what you're doing is you have 120 days of range from the past and going forward there's going to be a significant move now some of your press of course there's going to be a move michael come on i mean a lot can happen in 120 days yeah you're right But there's things that you have to look for that the algorithm is going to be doing to engineer
these types of moves you have to have these data points to know why the market's going to go at an old low what old low well where's the lowest low in the last 20 days where's the last 40 days where's the lowest low in that range where's the highest high in that last range and you need to be noting those because that's The one that they're going to run they're going to run rate for those if there isn't anything that hasn't been traded to in the last 60 days if everything's been wiped out above and
below the marketplace in other words the open float all the buy stops above old highs and all the sell stocks below all those in the last 68 darn your look back in other words everything to the left of that november vertical line at red line if everything's been cleaned out Above and below the highs and lows there's no more buy stops there's no more cell stops it has to create a new expansion so you have to identify what the next high and low outside that range of 60 days looking back where that is and that's
going to tell you where they're going to draw a price on this daily time frame it's more it's more confirmed when you Start applying it to the weekly chart in the monthly chart because you'll start seeing things align where that old low that's just outside of the last 60 days looking back there's an old low that may not be on this chart here i don't know i'm just giving you a hypothetical example if there's an old load it's just outside the realm of september in this example here say maybe there's august there's a Significant lower
low the market's going to reach for that there may be a high that's just outside the september boundary in august they may have turned around here and they make a run for that maybe it may be in the 78th uh price range for uh for aussie that's what you would be noting and you're going to look for price to be drawn to one of those two price points And you look for evidences that that institutional order flow is going that direction then you know where it's going it gives you directional bias because of the higher
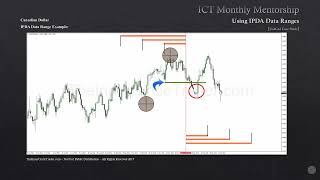
time frame nature of this daily chart and weekly and monthly so what we have here this is the look forward okay or cast forward of november this is 20 days out from the 1st of november so we have 20 Days here inside of that 20 day range there's going to be a significant setup that you can use for your trading it's moving up into the old load that was formed in october it goes into consolidation well here we have a condition where the market didn't create any significant shift but it starts to move in consolidation
then you count forward okay from here That's the 20th so you can go from the beginning of november to the 20th yes there was a price swing but using the information next stage would be 40 days out from that price point of november beginning we have here that is your 40-day lookout or cast forward and you're looking for again a potential major shift quarterly it can happen at that Point now it didn't give you the lowest low because if you go back to the left two two daily candles or bars the last down right here
this down candle that was the actual low we had a small little range in here and then we came down and hit this level here 71.50 that's the 40 days out from the beginning of november framed on the Quarterly shift that took place here so we're anticipating a potential change in in the direction okay 20 40 or 60 days out but that's the range it's not always going to do like what you're seeing here where it's almost calling the very day it moves and makes the change it's you're allowing your study to say okay the
price is going to move about 20 days and then we could see something if it doesn't happen in 20 days okay well In the next 20 days up to 40 days from where the market structure last shifted here quarterly then we're going to anticipate in the realm of the next 20 days it may happen so you have to be looking for signs that it's going to happen if you don't do these things you're going to marry the idea that the market's going to keep on going lower and never turn around It doesn't it doesn't do
that mark is not trading straight lines so if we see here on this day here this is 40 days out from the beginning of november very significant price move occurred from that price 71.50 i mean i would think everyone if we were all in the same room if we raised our hand if we were in agreement i think the majority of us if not all of us would Raise our hand say that's a pretty significant move off that level one of the things i learned when i was an indicator based trader i'd like to stochastic
i like larry williams accumulation distribution formula where it plotted an accumulative line based on the relationship to open the close and closed open and measuring that as some smart money buying and selling well sometimes that's true Not always and it didn't always give you a divergence i liked his william percent art and the reason why i liked his william percent are is because it has an uncanny ability to be one day before like if you look at stochastic you have to wait for the the candle to close and go to a new candle to see
if the k line crossed the d line or d line across the uh the k line or whatever it is i don't even remember what it was anymore but The the trigger line that uses uh the idea behind a crossover for stats for a stochastic that has to happen after the fact well the market's already moved when i looked at the percent r what that did it gave me many times the day before the real oversold condition would happen for instance if the oversold condition existed in williams percent r today that means tomorrow it's probably
Still likely to go down just a little bit more but that's going to be the buy day that's a very low low well that same phenomenon sometimes occurs with these ranges 20 days out you may get the if it doesn't turn it may happen on the 21st day or it may occur on the 19th day when the when it does occur but that's Not what you're relying on so it's important that while that may have magic in your chart sometimes you may see it happen it might do the very thing of turning on the 20th
day or the 40th day or the 60th day and you saw that in my first teaching for the month i wish i probably would have stressed it more because everyone seems to think that that's what's going to happen i i'm not telling you the market turns every 20 days every 40 days and every 60 days but It can and will sometimes do that what we're looking for is these quarterly shifts that take place once we identify one there's our beginning point okay but you have to roll back to the beginning of that month it occurs
in it occurred in the second week of uh of the month of november so we're now we're calibrated now we can start going forward until we see a equal or counterparty Uh to that move going lower it has to be a significant um you know retracement or correction or reversal it's indicating that here the last week of december why is it doing that because we've taken out december's high see that we're trading at a level where if this was continuously bearish it shouldn't be where it's at right now today Okay but my point in drawing
your attention to the 40 day is it was not the 40th uh i'm sorry it wasn't the fact that it made the lowest low and turned on that day but look at the low in proximity to the lowest low that was formed here inside to see this day here was inside the range of 40 days back to this point price point here so from this level of looking at the first day of november casting forward 40 days This whole turning point right here could have happened any time in the last 40 days now again that
for the summers that are cynical of course obviously this this is of no value it's a great deal of value because inside that 40 days just like when we look back for 40 days and look for the low for sell stops and we look for the high for the buy stops in this range here what is this That's a low below that low is going to be what cell stops yes we moved about 150 pips or so below that but we came to a level of 71.50 that's not random 7150 is a significant level it's
a mid figure level and it's happening at a time When inside of 40 days the if the data range is going to be looking to do something it has it has to do something every three months price is going to be pushed around it's going to be drawn to a level or it's going to repel from a level and it's based on what i'm telling you here it's seeking large fund liquidity now longer term where we're talking about monthly and yearly moves they are All driven by real fundamental things like interest rates but every quarter
there's going to be a ebb and flow that takes place a rally and a decline when this occurs that's all short-term in nature when you look at long-term trends that go for five years or 10 years three months is nothing that's like a five minute chart on the scheme of a weekly chart it doesn't mean anything there's no significance to it at all Long-term macro fundamentals okay are not impacted by three-month cycles they're not they can be used to get in sync with long-term macro fundamentals but the only fundamentals you're going to get from me
is interest rates which is going to talk to you this month as well so again in summary the 40 days and i'm not done teaching but for 40 days This range we're looking back because you know here we have a new 40-day look we're casting forward 40 days so that at that moment we're gonna have that in our charts from this point here we know 40 days from then this is where we would have our expectation of a shift but we also because we can do that in advance we can now look back 20 days
from there we can look 40 days back from there where's the lows and where's the highs Think about that if we know at this point here casting 40 days forward we can have a vertical line right here on our on our charts now to someone looking over your shoulder they'd be like why is that line even there why do you have a vertical line there i don't know i ain't telling you you weren't part of the mentorship But from this point here counting back that's good here's here's gotta count this day as day one one
two three four five six seven eight nine 10 11 12 13 14 15 16 17 18 19 20. okay to 20 is basically the the last day before you get to december so the second to the last day of november is 20 days back what was the highest high formed in that range it's going to be mid july uh mid December where it made those equal highs so there's going to be what's resting above that buy stops so what is the ipta algorithm going to do it's going to seek that liquidity it's going to go
up there and take that which high should i look for michael that one looking back from this point here because we know it from this point here casting forward 40 days okay going back 40 days well that's going to be in the range that's delineated here with this line that we've already shown this is the low is there any significance about that low well i'll count you to go into your 4 hour 1 hour and 15 minute time frame and put up 7300 on your aussie dollar and see what you see there's nothing random about
this stuff folks that low is 40 days inside the 40 day Range okay that is a significant turning point it's not the very lowest low but you can see that the low forms two days before that and then we have a market structure shift and the market starts to go opposite to what has been put in place in november you can now also from that price point there by having a vertical line on the arrowed daily range you can now start counting Forward 20 days 40 days 60 days until you see an obvious shift quarterly
there's a major structure shift okay it could be bullish or bearish whatever one it happens it doesn't make it that you're not trying to forecast that all you're doing is anticipating another significant move in price on a daily chart and it happens every three months but the point is the The if the data ranges give you a means of looking back 20 40 and 60 days from specific days and specific price points because then you'll know what stops they're going to be reaching for above the old high and below an old low it's not just
well i'm looking for the most recent obvious high and low no no no no it's not like that at all it's not like that at all you got to look back in a range of 20 40 and 60 And then if all those levels have been cleared out then you gotta look outside that range then you know you're getting may see a big move and if it has these characteristics then you know you're going to see a larger move higher or lower based on what those uh highs and lows would be outside the most recent
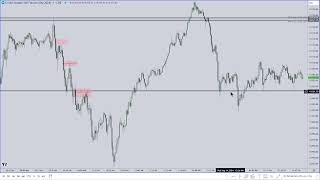
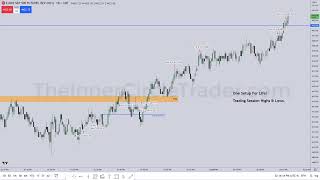
60-day look back all right so this is the australian dollar Candlestick you can uh rest your eyes a little bit and then we're straining your eyes on the open high-low enclosed bar here's that 70-50 level okay and why is that significant here we have a old low back in february of 2016 we have a last down candle but that last down candle has a range in it okay let me show you again this is what it looks like that wick Right in here right here look at that price movement up right before the last it
was the last week of february the big green candle right there we know that prior to that we saw the down close and that explosive range higher that high is going to be significant it's going to be sensitive okay but all The way down into the opening of that weekly range also notice that this last down candle here right before this big move up in the last week of may of 2016 that last red candle that was the bullish order block as well so we have a big range to work within then going into the
latter portions of 2016 the Last down candle in december that would be a bullish order block as well looking at the the high and the open on that candle would give you significant price points to go forward as well but look what happens when price hits this 70 150 level it's been down here before and they repelled aggressively away from that fundamentally must be something to it i don't know what it is but on a weekly Chart we're going to be using old highs and old lows and if those old highs and old lows had
significant buying and selling pressures it's evidence and you can see it here we have to be mindful of that and you can see that they have in fact traded down there we tapped it two times on a weekly basis and then moved out once we moved out away from that level you'd see that they're going to be Looking to do what they're going to be trading above these candles bodies and the wicks are next and we could potentially trade up into this last up candle in the last week of october of 2016. that's where the
bearish order block is so we have a range that potentially could take us up into 75 70 to 75.80 still For australian dollar let's go back into the daily or australian dollar and i want you to take a look at this chart for a moment stare at this for a second tell me what you see okay this is again this is the march contract for the australian futures market it's going to basically do the same thing our australian dollar pair does in Forex but what you're seeing here cannot be seen in trading forex and er
all these guys that get on facebook and on the internet and twitter and they know everything about forex and they know the insides and then and everything that's secret okay the buzzword smart money and now it's institutional trading everything is making its way in everybody else's curriculum now But none of them talk about this okay and this is where i learned the things that larry williams taught in his book how i made a million dollars trading commodities last year wrote that book in the 70s folks you know we're in 2017 now very very few things
have the longevity of what has been taught in his book i mean for less than it costs for a pair of shoes Today you literally can buy a book that if you have no understanding about how commodities move and how they're priced and all that business uh to me i think that is an essential part of every trader's library again the title is how i made a million dollars trading commodities last year by larry williams in his book he talks about how he was taught he didn't discover it he was taught this by His friend
and i think if i'm not mistaken i think he names his friend in that book but the uh if not you can find it on youtube you do a search on larry williams and open interest but the the fact that open interest is the most misunderstood data point in trading is a wonderful opportunity for you as a trader If there is now thing think just for a second if there is 100 control over price there has to be someone controlling it we're going to globally call that smart money if they are controlling it why would
they want to control it greed they want to make money just like anybody else does banks are not in the Business to go out of business they're in business to buy and sell money or provide means for you to borrow money to pay them interest on the usage of that money that's just one facet of it there's also speculation that is the mis most misunderstood realm because it's not widely talked about you have to be in that Arena you have to be there to know anything about it and you are forced to not talk about
anything so i had to create a language if you will okay to be able to talk where the things i understood are effectively communicated but also doesn't put me out there where i'm in trouble that's why we are in This teachings uh this this medium the things that i quickly learned that were apparent in the marketplace is that yes there is a entity out there that is 100 interested in offsetting large funds because they have real huge orders in the marketplace and if they can upset them or take them out of the marketplace they know
that their viewpoint will eventually get back in line because they're trend filing in nature they can Take them out of the move and take their seat in that position or they can take them in the wrong side of the move and then reprice aggressively the other way and they can profit from that they're not looking at owenda or fxcm's books and saying okay well you know we're going to really punish retail today retail is just following the you know the blind leader of all these textbooks all that stuff You know that leads you to losses
that's a derivative of you doing what you've been told to do and it doesn't have any basis in how the markets actually work once in a while they will work but you're not it's not because that it didn't happen because the divergence isn't stochastic it didn't happen because your wolf wave or your harmonic crab riding on the back of an eagle's Wings pattern doesn't that doesn't happen okay price is moving based on where the large funds orders are where that open float is on these higher time frame charts that's what's drawing price but because the
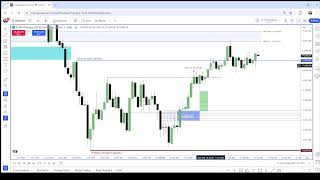
price is going to allow the bank level traders to get in and build positions in otherwise if it was really just the central banks repricing it would be like all the time big moves Moving up to an old high then down to an old low the traders have to have a opportunity to work inside that position to capitalize on the move that ifta is engineering for them how do we know when the banks smart money are actually going in and buying if we know that there's a likelihood that 71.50 when aussie dollar is potentially bullish
what evidence is there that there is in Fact smart money buying it well inside that blue shaded area in here i have a great deal of insight to share with you and some of you already know some about something about this but i want you to think about this every three months this occurs write this down your notepad if you're busy changing diapers okay doing dishes Hiding from your boss write this down every three months this pattern occurs where you're at a support level a major higher time frame support level if you see an expectation
that price should be bullish we have been trading lower and we hit the level like we're seeing here at 71.50 as we just let me go back one More time to show you the weekly chart there's that 7150 level down here we've been there before in may okay so look at that level here you can see that 7150 that level has been hit perfectly his nails it okay and it runs away as price hit it as price hit this level here this purple line in here i want you to look at what was going on
as price was Dropping down okay all through this market structure shift in november okay what's happening here yes prices repricing going lower it's allowing bank level traders to be short and capitalize on that move but also open interest is also declining why why is that happening why is open interest declining when this moves dropping down What what significance is that because if you read larry williams book he says his buddy told him if the market is in consolidation all through here all between 77 and 74.50 for august september and october price was in a big
trading range it's in consolidation then in november it creates a false breakout above 77 big Figure and rejects and trades lower open interest is taught that as long as a trend is going up or down and you see open interest increasing as the trend goes that's a healthy trend that works for bull markets doesn't work for down markets that's a misnomer that's misinformation larry williams says when open interest drops while you're in consolidation we're in consolidation all through august september and october Price drops down in here we have a big drop in open interest open
interest is the total open longs and shorts that are in the marketplace right now if the central bank is the storehouse for price it's their currency it's their commodity if you are trying to buy currency it has to be made available to you and it's going to come from a bank If this would have been gold okay uh the commodity is gold is there's a a provider or a liquidity provider of gold okay you have to buy up this position or assume a position in gold well for australian dollar if you're buying that currency it
has to come from somewhere it comes from the bank so if they are the liquidity provider for the price of australian dollar the central bank of australia if that bank is providing you the basis of the valuation on australian Dollars they are essentially doing what they're the counterparty to all the large funds not always not 100 percent because you have all kinds of smaller entities and institutions that could take the other side of other positions but from for the most part view open interest as every trade that the central bank is providing counterparty to basically
what A small brokerage firm would do with their own clients they are the liquidity provider well the central bank is the liquidity provider for australian dollar so if we see open interest increasing what does that mean that means the central bank is it's taking on risk it's providing liquidity for buyers of australian dollar if open interest has a 15 or more drop Or change lower like it does here this is extended this is a very significant drop while price is sideways this is bullish because what this is doing is every every time open interest increases
it's indicating that they have now provided liquidity for a buyer if they're not trying to provide liquidity for a buyer and they're trying to reduce their holding or exposure that means that they're not doing what to Offer liquidity to a buyer they have to be a seller open interest reflects the selling side of a provider of liquidity if this open interest declines aggressively like this that's indicating they do not want to hold the heavy short position they would be having by being a provider for those that want to buy australian dollar you see it rally
then but look carefully the extended trading Range is months long what's going on that whole time from this point here they start building in positions they're selling this thing as it's creating higher highs it's coming back it's they're selling more of it here and they're selling more over here every peak in the open interest from the low it creates here every peak in it is a high they sold more here They sold more here right at this high they sold the most right there they're selling into that rally you don't get that from leah williams
book you do get him saying open interest increases when we're in bearish markets and then for the consolidation it tells you if we see open interest increasing in a consolidation that means that the open interest is reflecting heavy net selling on the central bank level that's How i'm viewing it for currency trading but what he taught in his book was the commercial traders the large commercial users and producers of a commodity they're actually building in heavy short positions what i learned was by looking at open interest and matching up the highs to the peaks and
open interest you can actually see where they did their cell programs that's a sell they're selling it here and in the very highest peak they sold it there now Think about it if they sold it there and then we do have a market structure shift here are they gonna hold on to their short positions if they're naturally a hedger open interest is going to by natural order of things reduce as it's going lower because what are they doing they're covering those short positions they built in here that's what's happening all through this process of going
lower Open interest is declining you don't get taught in textbooks it's showing you that they are in fact in a cell program and they're profit taking as it's going lower lower lower lower lower open interest is going to decline then we hit a level like this major support are they going to want to hold on to a heavy net short position by offering liquidity to the buyers no way How do they upset that they do rapid price declines that knocks the desire for buyers that want to move away and get out of their way because
they don't want to be a provider and by by providing the sell side to buyers they don't want that risk and that's why they do these massive sell-offs in price you see these big moves that jump down to specific levels and they just keep going lower and lower lower They do that to take away and control sentiment on the near term you may have been bullish back here well that goes away real quick when they do this and they would keep driving lower all of a sudden there's no support levels until you get down to
71.50 they know buyers are going to come in so they have to reset and drop down quick boom they reset they take all their interest on being a sell side Liquidity provider and drop it down to its lowest point why are they doing that because now their exposure is not here their exposure starts down here and they go back to that same cycle now everybody's signing a buy buy buy buy and they will provide that liquidity because they've already profited down here from back here back here and back here all in the last Week of
september the midpoint of october and the second week of november where they sold and built in their bearish positions the telltale sign is inside that support level at 71.50 dovetailing this with if the data ranges and quarterly shifts we know that this is most likely going to occur and move all z dollar up and go back into the charts and go back into what i was talking about for Australian dollar i told you that it was going to go higher this is not hindsight cherry picking i'm telling you why i said these things and what
was behind the scenes that i can't go through i mean look how much we're talking about it now if i did this kind of talk on everything and every setup every single day i'd never get done i'd never see my wife and probably be divorced really quick but These are the things that you're going to do in your analysis it won't take this long obviously you'll know what you're looking for because of the teachings but the mechanics behind it all is that 7150 is support price on the weekly charts bounced there before we're in the
low end of the the range for the weekly um um well The lowest point which has been in a long period of time going back to go back to your weekly chart that i showed here in your notes and you'll see that that's the lowest it's been in recent time in the weekly chart so therefore it would be reasonable expect to see some bounce at 71.50 but i'm drawing your attention to that little area in december that little Massive really it's a massive decline in open interest right there that purple line when it tanked went
low real quick like that that's the central bank getting rid of any of their remaining short position so now they're they're done they completed their cell program first week of november mid part of december so now the they're ready they're prepared for buyers to come in They have reset their self there's no exposure on the upside okay against them by holding heavy heavy shorts so now they can start offering that liquidity from the low end because they made their book from 77.50 all the way down to 71.50 600 pips and believe me they're moving size
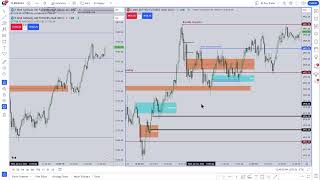
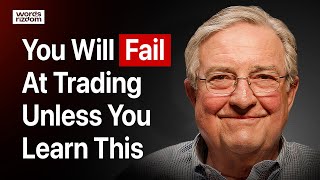
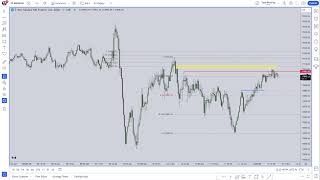
on all that so from that point on okay we had that delineation On this candle or bar remember earlier and looking back 20 trading days we put you right about in here that means the high is here that's where they're going to run liquidity that's where they're going to be seeking to take price now what does this mean for forex trading all right so this is what we've seen Price do here's that 40 day cast forward day that's the very day and this is that down candle or down open high low close candle that small
little one and then here's the the last one or the 40 day look forward from the first of november price goes higher from there creates a down candle price moves above that candle Here this becomes a bullish order block so if price was to ever come back down we could be a buyer there i said we'd like to see some bullishness on this candle here because we're on the left side of the curve this is all the cell side now if you're going to be bullish you're going to go look over here at every down
candle there should be some bullishness in here we saw some of that they have a down candle here If we had a retracement i would like to see it price come back down here i would be a buyer that was a potential scenario that could have unfolded if it didn't and we blew out the high of this candle this down candle is going to be the new bullish order block so it's high comes in at 70 350 price comes down hits it here yesterday finds some sensitivity there and expands up and closes in the range
the context of the move for australian dollar was i was Not bearish australian dollar i did not have you set up to expect lower prices on the australian dollar we were looking for this thing to come up here and close in this range and potentially up into this bearish order block and it's now confirmed that it wants to go higher relative to the things we just said based on that weekly chart and we described on the futures contract on its own daily chart we had a mean Threshold of the range from this candles open to
this candles close that's what this range is here we've moved through that so now what is it indicating it wants to go higher what's it going to reach for it's going to look for a clear run above this high here because that's where the buy stops are resting they're not going to take it just to this level here and be satisfied if they're going to allow this move to take Place they're going to punch it through equal highs now i know you're saying if you if you're new and you haven't really paid too much attention
to and equal those and you're only looking for like a perfect equal candle height this is in my opinion this is an equal level it's so close to one another in terms of proximity if you look at the buys of the cam they're almost the same I mean look at that i mean we have the open on this candle and the clothes on this candle since it's the same thing we only have this one little wick so the liquidity really is above here and in my opinion it's going to go above this level here so
that puts us around that 75 70 to 75 80 level like we talked about relative to that weekly chart so by taking this information and applying it to your charts It helps you map out while you have areas where yes this could happen we could trade down here but if it did we were buying we would be expecting to be a buyer down there it may not happen they may allow price to keep on going and give you no real retracement but you still had reference points to be watching and monitoring going forward this was
the new down candle okay it's going to be a bullish order block so therefore we should not see this candle Give way if it trades through it it did it traded above its high so now this has become the support level this level is where the banks are going to look to defend it on the downside so any movement into it like we see here this candle trades into the body and quickly rejects the next day it opens trades down it hits the bodies i'm sorry the candle it's high it's 73 55 goes a little
bit below look at the low 73 52 it only went three pips below the level we would be watching for and then look at the aggressive move through it trading in delivering price with a bullish side of price buy side delivery we had all down movement here between 74 34 and 73.80 prices moved from 738-7434 yesterday so having that having that move from 7380 to 7434 It closed in that fair value gap that we've we've been monitoring that occurred in december 2016 and then prices move through the mean threshold it's obvious that we'll see a
move above that 75 25 level how much further like i said 75 80 looks likely and if we do that we could really make a run all the way up into uh 76 i'd say 76.50 so 76.50 is likely upside Objective if we get really rolling higher but apart from that uh that that was the uh the dna or anatomy if you will of why the australian dollar moved up why we were expecting bullishness on it uh behind the scenes these higher time frame ideas that you're learning you have to learn to trust them on
these monthly weekly and daily in applying open interest to levels that you would expect to see Bullishness in every three months okay and this is the last point and we're going to close today's teaching the point at which these three month to four month moves that take place every quarter there's a major shift in market structure and while that may not undo the long-term bullish or bearish moves they are executable in a way where you Can make great deal of money you can take a lot of money out of positions if you're properly aligned if
you are not aware of these they will take you by surprise and you're like where'd this come from you know there's you know there's no worse feeling than expecting a move to go hard one direction and then see it do something like this like for instance if you're looking at this move here And say you were a fibonacci trader not necessarily optimal trade entry but say you were a fibonacci trader and you saw the 50 level here there's a guy on baby pips that makes a name for himself on trading at 50 level fibs and
i i use that as equilibrium but you could be looking at that say okay yeah and this day you would have probably felt good about the whole idea Of being bearish on australian dollar not by what we've been talking about and we mapped out very specific we even talked about that very day being bullish but in the retail mind this whole day right here that would look like okay well we have a double top now it's at a 50 level in the fib it's going to go down and trade down below here or i'll do
i'll do an abcd type move and I'll be looking for 70s on the australian dollar that's retail thinking we were not thinking that at all we're mapping that candle out as a reason to be a buyer so the things you're learning is completely diametrically opposed to those things that you learn in the retail world and it's like that because we have to capitalize on those ideas because those Things permeate large fund trading where the buy stops where the cell stops it's the same way human nature is going to repeat itself every large fun trader starts
as a low end trader just like you are right now just like i started grassroots we all start from the same place the beginning no one becomes a large fun trader managing billions and millions of dollars because you just felt like you want to Do it today try it try today if you're successful today try to get a large fund traders position by the end of the month you can do that i'll send you one million dollars through paypal you have to do some things you got to prove you know you can trade okay and
you have to go through a lot of uh rick morrow if you will if my if i can quote my grandmother to get to that that position You have to prove yourself it doesn't happen by accident so if they are doing the very things they did as a regular trader but they still have to do things with guidelines okay then it's common sense that their stops are going to be rate where everyone else is going to be placing their stops but they have a lot more money at risk they have exposure that you don't have
you're trading micro lots and mini lots And all these other things and i'm not trying to disparage you or or you talk down to you because i started the same way i started with small stuff but they don't see you you're not even a blip on the radar screen but they do see these large pending orders above old highs and below lows in the last 60 days in the last 40 days in the last 20 days and once you find a time marker where you can delineate when there's a shift that has taken place or
When you cast forward 60 days at that moment you know in the future 60 days from that last market structure shift quarterly you know that's a delineation in the in the future so you can already anticipate a significant move 20 days from that one back from it which would be not 40 days it would be 20 days back from that new market uh delineation so for what i'm Saying is by having these things on your chart you'll be able to look backwards and forwards and looking for the ranges just like the ipta algorithm will look
for where the most recent 20 day 40 day and 60 day stops are if they have been cleared out on both sides of the marketplace once they have been wiped out and we're in equilibrium you have to look at where The next range high and low is outside of the last 20 i'm sorry last 60 days that will tell you where the next big significant move is going to be and if you combine that with weekly and monthly charts it's almost like a no-brainer you just have to wait for it to happen it takes time
for that to unfold and most of us by human nature are not patient we're impatient some of the folks that have left this mentorship are classic Scenarios of that they're just impatient they want to know it right away they wanted to learn it all in one month you know they stuck it out for the second month the third month the fourth month it was too much i can't wait for it i gotta go okay i gotta just gotta toss it in and they'll be they'll regret the rest of their life trust me they're gonna regret
it when they look back they're going to feel like They've missed the opportunity of a lifetime and they have what you're learning you're not going to get that from anywhere else but it's going to require you to work for it i'm going to put your nose right where you need to be focusing but i cannot take away the lessons that by studying it will give you that has to happen by you doing it and if you can't be here in the live sessions they're recorded it's the same thing there's Nothing different by watching the recording
when we leave january's content we're gonna be applying all these things so that way when you start looking at me doing short term trading and weekly one shot one kill setups and we go deeper into the mentorship when we start going back into intraday trading you'll see all these things are the reasons why i'm being a buyer or a seller in london open or a buyer and seller in new york Session and why these levels i'm keying off of and telling you everything that you saw us doing in the september month where we were nailing
highs and lows what the market was doing almost daily all that was was me applying what i just showed you in this teaching i just didn't go through all the the mechanics behind it all i just knew it and applied it and just talked about it just you know whatever this is what's going on and it gives you a great deal Of confidence and for some of you it will create an air of arrogance don't let that become don't let it define you but you definitely will have a level of confidence this goes through the
roof because you're going to know with a great deal of trust that the market is trying to get to a level for a real reason and it's being manipulated it's being controlled it's being driven there it Has no other way of operating except for over time price will agree on a level that's arrived at what ipda is seeking last 60 days where's the high and the low last 40 days where's the high and the low last 20 days where's the high in the low that's where your liquidity pools are Okay last 20 days where is
the gaps where are the gaps in the last 40 days where is the gaps in the last 60 days that's where all your fair value levels are think about it what's where's the consolidations in the last 20 days the last 40 days in the last 60 days that's where your equilibrium price points are going to be when the market isn't going to move it's going to gravitate and hang at those Levels when you see me say i'm not doing it today the market's going to be sideways and you're all like well how did you know
that this what i just taught you today how to use the data ranges house tells you what you should be doing should you be expecting range expansion on the upside should you be expecting range expansion on the downside that is directional bias That's are you bullish today or are you bearish today if you are not in a range where it's going to expand and you're hanging around equilibrium in the last 20 days the last 40 days and last 60 days in other words what's that look like if you go back 60 days and you see
where price has made a small little trading range divide that range in half that's equilibrium if your price right now today is just hanging around and dollar Index is not trying to move it's probably going to be a z day that means it's going to go up a little bit down a little bit and hang around the middle of range until it gets some kind of manipulation what's going to cause that high impact news which is the reason why i started you in september looking at the high impact and medium impact news events for the
week draw those things together everything That you've been exposed to so far for the mentorship draw all those things together and apply the if the data ranges now all of you are trying to over complicate it and it's probably my fault because of the way i taught it and believe me it's a lot of things to digest it's not simply 60 40 and 20 and therefore everything unlocks you have to use those ranges looking back and see where the highs and lows are where the Gaps are where the fair value gaps are where equilibrium is
and it'll tell you where the institutional reference points are it's up to you to execute on them when they get to those levels based on what a weekly chart and daily chart is indicating bullishness for variousness just because it goes above an old high doesn't mean it's a cell it could be the confirmation is going to go to the Next buy stop level above it that's the next stage of january's content where we start building the ideas of okay using a monthly and the weekly and a daily chart nothing less than that what do we
do what do we look for what's the process what sets up the trades on these time frames because if we can identify and prove that this is what goes on in price it does these types of things that are repeating phenomenon Going back to our algorithm idea and computer program analogy if the nose simply by going back what's today's date everybody knows what today's date is it's january 12 2017. the computer programmer can can gather that information okay so what's 60 days from that backwards in time okay then the algorithm will simply say okay what's
the highest value of that asset That it traded to okay right there so now i need to go back up to that level that's what it's going to do it's going to go up there to allow the bank traders to position themselves once it gets close to that level then the bank level and broker level interventions and manipulations can come in but the the broker is not going to jump your spread 50 to 100 pips the central bank has to get it in close proximity to these levels then the lower Level manipulation that takes place
in broker level that's when that happens but your broker is not killing you and wiping you out with 50 pip swings that doesn't happen it has to allow price to be driven there and that's all central bank level so i threw a lot at you today children uh hopefully uh i haven't confused any of you hopefully uh i've given more clarity um you're gonna see examples of me actually using this information um But i have to give it to you conceptually first so that way i won't be uh inundated with a million questions about why
did you put a line here watch out you'll know why i'm doing it because i when i explain it based on what i've talked about here and what i've shown in the lesson 101.1 for january it'll it'll start making sense because we're not just going to do This one time and never come back to it we're going to be doing this throughout the mentorship and if you i'm not saying you should but when i start the signal service in the winter of 2017 um you'll know why i'm dealing with certain signals then if you if
you're able to watch it some of you will probably want just to see what you know what i'm Doing just to see how it lines up with what you learn but the the signals are all going to be based on what you're seeing here and it's why they're going to be so good that's why september was so powerful i had to show you that yes we can read price it's very predictable and if it's that predictable on the short term then it has to be that predictable in the higher time frame And you see now
that it can be it's all time and price time and price time is date on the higher time frame it's not time of day it's date calendar days and they're calendar days that the markets trade so if we know there's a range of 20 40 and 60 days that the algorithm will look Back then you know what high and loading you'd be focusing on if market structure is bearish what does that tell you where's the loan the last 20 days where's the loan last 40 days where's the loan last 60 days that's where it's going
to be reaching for it's looking for that sell side liquidity below those lows what happens if it has Two lower lows that haven't been traded to and it trades down below the one in the last 20 days it takes that low out and as a lower low 60 days in that range 60 days back there's a low and you know that it's possibly going to go down there but say it doesn't go down there and it rejects and it breaks market structure bullish what does that tell you you have a quarterly shift now it's Bullish
[ __ ] start finding the highs in the last 20 days last 40 days and last 60 days and you'll know what if there's dealing it's going to draw a price up to them everyone else is going to be looking at retail thinking okay this is a trend it's downtrend they're going to look for that old low 60 days out not because they're doing what we're doing but they're going to see classic support resistance ideas and they hold on to it they marry the idea it's getting going Down it's been going down so therefore it
must continuously keep going down and they just watch the market grind against them and all of a sudden we see what we're seeing in the chart right now australian dollar what happened what happened look look at the forums just for fun today what happened with an australian dollar i haven't been there yet i'm just prophesying They're probably saying what happened australian dollar well you all know what's happened in the australian dollar we talked about this before the fact why it's trading here why it went there and now you know the mechanics behind the scene what
what led me to believe that this 7434 was likely the mean threshold was uh um upside objective and why this currency's a leadership Currency why'd i focus on this one why why was i talking about this one and not the new zealand dollar that's a study for you this week as well share that with me on the forum show me what you discovered by contrasting the price action just like we just did here for aussie dollar do the same thing with new zealand do the same thing with euro do it with the cable you have
to practice folks if you only Do the things i'm only showing you you're cheating yourself of all kinds of learning opportunity the time that you have together believe me you want to maximize it i know some of you have businesses some of you have family obligations and this is a long-winded session but you know we only have two of them a week so suck it up the uh there's so much information i i Literally have 20 years of information i'm trying to share with you and it's a lot of information but this information still has
to be practiced you have to implement it in your charts you have to look for it you have to see it in your charts if you're not going to do that this is going to be it's not going to be enchanting for you to be here you're if you're wanting me to tell you This is how it is and it's always going to be this way and it doesn't require you to look for it and study it ain't going to work it's not going to work but you do have to do a little bit of
rolling up your sleeves get your nose in the charts but i promise you this is a guarantee if you do the things i'm telling you to do in this teaching and everything in this month of january It will give you every possible scenario for any type of trader you want to be and it will put you in the high odds category you'll be in the upper five percent you'll you will most likely be on the right side and far less time be offside on your trade and that's what the higher time frame whole idea is
about because you're trying to align yourself with smart money everyone that's on youtube is teaching smart money this is the market Maker i'm on a one-minute chart teaching this by by the way they're not on a one-minute chart they're not even down there they don't they don't even they're not looking at that they're looking at the orders on a daily chart that's what they're looking at that's what's driving price and outside of that it's a 15-minute time frame they're looking for liquidity pools and and Ideas around a 15-minute time frame five minute again they're not
looking at that but you can use a five-minute chart to find where there's a most likely uh a small little gap that would not appear readily on a 15 or an hourly chart so all these things dovetail nicely but you won't appreciate that dovetailing until you start getting in there and spending some time looking at price that's already happened Some of you a large group of you are so worried about that right edge tell me what that right edge is telling you michael when that won't make sense to you and you'll leave the mentorship if
i just gave you trades every day yeah you'd make money but when i'm done teaching and it's and that's happening i'm done when i walk away you've made money but you didn't learn How to trade and that's a waste of time and money you want to be focusing on what's happened on that left side of that chart because once you understand all that it's going to repeat itself because if in fact there is a smart money entity and they are manipulating and they are controlling things because they're motivated by money and greed they're not going
to change their mo their motive is going to be the same Thing going forward it's the same business model every single day it doesn't change it's not going to stop working the only thing is is if you share it with people number one you're just making it common knowledge and just you just don't want to do it you don't want to do it not because it's going to stop working but because you just want to be a part Of that small group that is profitable that is an elite that you know what you're doing with
your money you're not gambling this is not gambling you're not rolling the dice you're waiting for a scenario where those individuals that control price are in play their moving price and you're on the same side as them by default you have no other way except for seeing positive Results does that mean profitability maybe if you're in a demo account you can't make money on that but you learn a positive response and then therefore it teaches you this worked let me try it again wow this worked let me try it again why do you think i
tell you guys that it takes a minimum of six months because if you look at the things i teach you will see at least one market structure shift In that time period you need to see one because once you understand when it happens and you see it unfolding oh man the confidence level sends you through the roof you're like oh man i i'm never doing this again i'm never working for somebody else again i'm going to learn this business and i'm out of here i'm done i need to do this the rest of my life
and your passion level will go crazy And you'll know what you're doing you won't be just excited like a football game fan you'll know what you're excited about and why it's exciting because it's consistent it's over and over reoccurring it's never deviating it's there all the time very rarely do you hear these terms taught and spoke about in textbooks you know there's always a risk there's always this and it's always that the risk is You reading it wrong but this is always there in price the problem is is that you're going to let you as
the trader steer you wrong because you're going to look at something you're going to get so opinionated about something higher time frame it's hard to change directions a lot on that daily and weekly chart it's it's usually one direction for a while That's why you have to start there because if you start on a lower time frame you're changing your mind 20 times inside of the day and i talked to some people outside of our group they're still in a free membership area to just go on my tutorials and follow my youtube channel they send
me charts all day long i can't get to them i can't i can't keep up with the emails coming in but they send me their changed mind You know here's here's what i'm doing today in in cable i'm buying this and then okay here's 20 minutes later today okay i changed why i'm selling it they change their mind again this is all happening in two hours that's somebody that has no idea what's going on no idea what's going on by having the higher time frame premise by looking at monthly weekly and daily charts focusing on
the daily chart this is what we're Doing with a daily chart we're framing it like a bank does no one's teaching you this they don't give you the perspective okay from an institutional vantage point where how and why they're going to go to a specific higher level yes you can go back in time and look at a chart and say okay here's an old logo there's going to be sell side liquidity here or sell stops here all kinds of people on youtube that are Doing that now and yeah it's great but i'm telling you which
low and which high to go to there's a specific phenomenon that repeats itself over and over and over again and by having that as your routine every day you sit down your daily charts okay where are we at in the current range Where are we at with respect to the lowest low and highest high in the last 20 days the last 60 days in the last i'm sorry last 20 40 and 60 days have we cleared both sides of the board have we taken all the buy stops in the last 60 days in the most
highest high have we rejected all that and cleared out and back in the middle of the range because what does that mean you have to study are we at a large Larger longer term equilibrium where we could stay sideways for a while or now are we going to the sell side looking for the lows outside the last 60 days range having that and then start implementing inter market analysis that means you're going to start having ideas from the commodity market the equities market bonds all those things will start giving you More information and it'll tell
you where the opportunities really are that way even though we can be specific and specialist about i'm a euro trader i'm like i'm a crude oil trader i'm a gold trader you do want to have some diversity by having some exposure in other asset classes because it gives you a great deal of context about why you think your market's going to go up or down or Doesn't move at all canadian dollar is a good example if if the crude oil markets um you know acting and behaving a certain way the canadian dollar is going to
have a direct uh response to that and when crude oil is not of any effect in the canadian dollar you know will move just like the other currencies will but crude oil has a great deal of influence over that Particular uh currency canadian dollar having inter market analysis and relative strength analysis together and implying smt studies like the dollar index and the interest rate stuff that i'm teaching this month you'll have very very little opinions about what the higher time frames are Telling you and when you do that you are in line with what the
institutions are doing because you're not changing your mind every day this is what's going to do i don't care if i see two down days on a daily chart nothing's changed it just means it's retracing they're coming back for some more orders to buy more and that's when we go into discussions about building in larger positions with an underlying bullish move that's Already there we've already put in a position that's bullish we're retracing how do you add more to that where do you add more to it and how do you protect that position as well
and and what do you do to scale out do we ever hold for whole full positions yeah but you need to know all these things you know by the end of this this month to fully appreciate what we start Teaching in february march and april because they're going to repeat themselves and as long as you have a general idea of what is being taught in january i mean if you're completely lost then obviously you're gonna need to reach out to me after the last lesson in january but for the most part if you have a
general idea what i'm talking about when we start applying it every single day we sit down you'll see the data points i'm Looking at you'll know exactly why i'm calling this high being significant or this low being significant or this gap you know that that will make perfect sense to you then what order block am i looking at why why this order block and that not that one michael why'd you pick this swing high michael not that swing hi michael you just learned it today there's a range i'm looking for It's 20 days back 40
days back 60 days back then i'm casting forward and i know from that point on i know i can have a nude look back point where i can go 20 days 4 days 60 days back and wait for those new highs and lows to form that have not made its way into price yet when they form liquidity will build above it or below it based on what i see on the hard time frame I know what side the market's going to reach for when you do that same thing you're not going to send me emails
and text messages and direct messages do you think the um australian dollar is going to go down today i i think that the canadian dollar is going to go down today what do you think don't ask me what i think if you're watching my videos and you're in here don't ask me what i think the Whole point is learn from what i'm teaching you and you arrive at your own opinion and then when you're wrong would you what did you do wrong don't avoid that that's a learning opportunity take that as a big opportunity center
stage make me a better trader what can i do what did i what did i do wrong and what did i see wrong there so i don't repeat that same thing that's the Benefit of being in here you need to go through the lab experience go through the exercise okay and make the mistakes now you want to do those things right now when it won't hurt you it won't hurt your development it won't hurt your money it won't take anything from you it will build you up the folks that have left us they have they
have no concept of that they don't want they don't want to wait around they don't want to learn anything they want To be spoon-fed you are here to learn how to do what i do analyze the markets call the markets from where they are right now and where they're going to be at next in between those two price points there's opportunities and i'm going to teach you how to take those opportunities and manifest that in the form of trades keeping risk low Equity curves going higher and managing risk all throughout the whole process but you
cannot get to that level without some interaction on your part and it may require you to do things by watching videos like this is a live session you may be forced to do these things by studying the recordings do not think that this is not of any value because it's a recording has no it has no basis on that had no effect on it Staying committed to the development process is hard it's very very hard but i'm trusting that what i'm showing you here proves number one there is a real routine on how why price
goes to a specific level why it repeats why i tell you that it's not going to stop working why i tell you there's absolutely an algorithm that controls price because it does things that a computer program would naturally Do because i learned to be a computer programmer i went to school i have a degree in computer science specializing in information systems i know computer programming i know it so if i look at this stuff and i wanted to become a systems analyst when i was going to school that was my job i wanted to build
the documentation stage so i can sit down with the programmers and go Through them and if they had issues with the coding i would help them you know make this uh this process work but i wasn't going to be the coder i don't have the patience to do the coding but when i started learning the mechanics of what their what the price delivery does i didn't think about it it just jumped on my head this is the computer program This could be automated and by curiosity i went home and looked in the charts and said
okay if this is possible i should see it in price and here you go it was right there and i got nervous and excited at the same time i was laughing and crying at the same time because i thought i literally hit the lottery Like i had the winning lottery numbers for the lotto every week going forward i had it every tumbler clicked it made perfect sense i knew right away why i was wrong on everything i lost money on and i knew now going forward where's the next setup going to be why do i
have to wait for it and when will what how much time will it take for it to happen When is it most likely to occur where is that signal going to format before it even gets to that price level that's what this gives you it gives you every bit of clarity that you don't have right now once you understand what you're doing with it you'll have every bit of understanding about why you're waiting and sitting on your hands see some of you say oh there's no set up right now oh michael i don't hear that
Because i want you to focus on what's going on the price has to be driven to a specific level then i can tell you why this is what happened we said it was going up we told you the level is going to go up but why did it go there you learned that today going forward you want to be using these tools to vapor frame the ideas that lead to a trade setup as you go through more of the material small little pieces will start coming Clear things that you have questions right now you need
to not send them to me in an email be surprised by finding the answers in the future lessons and in your own study that's how you practice that's how you develop as a trader me giving you an answer isn't going to always satisfy because you're going to still come with 50 more questions i know that because it's the same thing I encountered when i think i needed to do something about something and i scoured the internet for it it created 50 more questions well wait a minute now if i came in with one one little
thing that i was unsure about i go in i start looking for it and i get the response and the answer to that but then it created 20 000 different scenarios that would create a what if scenario well what if this and What if that and that's the problem every one of you are in that stage and it's because you're overzealous and i i appreciate that believe me i've been there but you also have to just take a little bit of faith and trust the fact that i've taught this before you are not a guinea
pig scenario i've done this with groups of people and individual bases as well trust me i will get you where you want To be at but you have to allow it to happen but you also have to be a part of it by practicing and looking for it not looking for trades looking for the things i'm telling you the evidence that there is control if they evidence control and price that means that there's no reason for you not to trust the things i'm telling you in the future if there's something i'm going to teach you
in the future and i'll say okay Refer to the if the data ranges this is why this turtle soup false break below or low is going to happen and we can be a buyer down here because if i start saying okay look we're going to buy tomorrow's tomorrow we're going to buy today's low oh i don't know about that because if we sit in london and it starts diving 50 pips all in one candle i guarantee you 85 or more not buying that day you're not buying that low you're going to wait for a bullish
order block or an optimal trade entry or you're going to wait for it to move up 60 pips before you think it's going to go up you won't trust it and you've missed the whole learning experience you've got to go through the things i'm putting you in front of to do those very things pay attention what's being done right now I'm getting a thousand questions about why they can't get to october content right now i can't watch anything october i can't i can't look at what's going on in november why are you there that stuff's
there forever you have access to that focus right now on what's being taught in january i'm telling you it's a lot of stuff and if you are wasting your time on things that's already been taught to you and It's already in recordings you can go watch it any other time pay attention more than any other month closely to this one because i guarantee you if there's any month you're gonna have to come back to and study it's this one there's so much stuff in it it's dense it's very very vast you have no easy way
through this you've got to grind through a lot of this material and You're going to have to refer back to it many times and believe me you'll be back through this whole month content multiple times even when you complete the mentorship and you're going to find stuff that you didn't get the first time the 20th time the 30th time it's a lot of information it's two decades worth of stuff you want to be a big big time trader you want to be consistently profitable it's In this month you want to know when not to trade
and lose money it's in this month you want to know how to frame a trade before price ever gets there it's in this month you want to be a day trader it's in this month short term trader this month too you want a swing trader here your options trader it's here you want you want to be a trend trader you want to be a breakout artist you want to be a trader that sells options Rights options it's in here you won't appreciate it until we get to the supplementary teachings but everything that leads to you
being effective doing those other things stems from what you understand and being taught in january here all the content is being delivered it's going to be a lot more than eight lessons folks it's more it's sub teachings inside of these major eight topics Lots of it that's the reason why we're not doing these live sessions and i'm throwing an extra one in here today by time because i want to encourage you that what you're waiting for is exactly what you're looking for and believe me it's a lot of stuff and you're probably gonna your head's
gonna hurt you're gonna have you're gonna feel like man this is information overload and i'm already pre-warning you this month and i told you this of all the Other months in this mentorship this is the one it's a monster it's tons of stuff and you're gonna have to study you're going to have to study in february we'll resume back to a very standardized teaching model eight lessons supportive in nature and we'll be back to doing more live sessions you know throughout the week and then in march we'll be obviously in live session on a daily
Basis every monday through friday we'll be back in live session but you got to give me the time to give you this information and still operate as the mentor and answering emails and also running it too i mean there's a lot of stuff i have and i have a family so permitting me the time to build the lessons for you and change some of the things because i all my notes are all based on like commodities and Indices so i have to change some things and create some slides that relate to foreign exchange because i'm
predominantly teaching to a crowd that's come to me by way of fx but and when it's um it's necessary you'll hear me talk about it where um this is unique to a specific asset class you know like we talked about today with commodities the idea of having the open interest in your study that is Only going to come by way of looking at the futures market so since we're forex traders it it is important that you avail yourself that information that's available to everyone it's common knowledge it's free you can go in and get it
okay and it's valuable it's a gold mine and people that think they understand it while they may have a little bit a myopic view of of what one facet of it does for you What you learned today was the real mechanics of what open interest does it gives you the x-ray view of what the real smart money activity is are they really buying because if they're really buying they're going to dump open interest and it's going to drop 15 or more and it's going to happen at a t support level if it's going to sell
off and start going lower and if that was a real turtle soup cell Then that means prior to that turtle soup cell they should have been a massive increase over time with that open interest going up and you saw that in australian dollar because open interest high open interest indicates them offering the sell side they're only going to take part of that if they know eventually they're going to be able to sell that position off with price being going lower That's the only time open interest is going to go up and they can do this
on long term trends but it will shift every quarter they have to fund themselves for allowing the holding of that risk now you're probably thinking okay well michael if they're in control of price what real what real risk is there well what happens when a rogue nation nukes another nation You're not thinking that are you but that can happen what would that do what would that do if a nuclear bomb gets dropped in any nation it's going to freak everybody out uh oh we're in world war iii bombs are dropping when september 11th happened boom
markets are all over the place anything can happen look at the brexit look at donald trump look what that did There's risk okay but they take these risky and uh opportunities and they manipulate but they don't want to hold on to something and not make money so yeah why they will provide liquidity and sell to the buyers that see price trade higher for a period of time every three months look at your charts and see if they don't reset themselves every three months it's there it happens in s p it happens in stocks it happens
in Commodities it happens in bonds it happens in forex it's there every three to four months you'll see it it's there and that's how they pay themselves for holding on that risk offering the liquidity for the sell side of it providing the means for buyers to buy currency they will do what we're discussing here quarterly shifts and you'll see evidence is that in open Interest it will happen at points at which by looking back 20 40 and 60 days where those highs and lows are where those gaps are where equilibrium is those reference points in
that time field okay of 60 days is the maximum look back it's simple and here's another study to make it easy for you just go back 60 days from every month beginning start every month it was an exercise Every single month a calendar month put put a vertical line on at every new month go back 60 days find the highest high and lowest low and you see if they don't wipe that out you can take any pair you can be the dollar index it could be the well look at the australian dollar put a vertical
line on every single first trading day of every month okay Don't do them all at one time so that way your charts nice and crisp and clean but put a vertical line at the beginning of every month the first trading day of every month okay and draw out a line okay 60 days 60 trading days okay and delineate that and then find the highest high and the lowest low and then go forward from the from to the right of that and you see if they don't run those uh buy stops and sell stops above above
that and do the same thing for 40 days And do the same thing for 20 days doing that study that's exactly what i did the night that i've seen how this works that's all i did i said okay if i'm a data if i'm a computer programmer i need to be able to reference something how can they know what the orders are like how because in my mind how could they see Lynne waldock's orders because that's how i looked at it my my perspective was if what i'm learning to do in the marketplace to be
a market maker i have to know certain things and what i was learning if this is true then i should see evidences of it in price and i couldn't wait to get home I went home pulled out my charts and it was a swiss franc chart that was that was the actual chart i opened up my commodity price charts from commodity trend service and i literally turned the page and i literally in seconds seen it i said okay if i'm if i'm the computer program and i'm going to be able to reach up into aerial
orders it can't i can't know what every brokerage firm's Orders are there's no way it's dynamic think about it you might have a trade on right now and you might have a stop on it may be there but something might change and you collapse that trade your order's not there anymore every one of us are dynamic thinking we may have an order there think about what you did with your last trade how many times did you meet your stop-loss Think about it you were long you you moved your chair you shared your stop-loss up okay
and then you started seeing a little retracement you're like oh let me move that back and some of you probably moved back further than it first originated at you're dynamic so your orders are always moving around and that's why i say hey this is too much of a variable there's no way for them to know every single book that's out There so how can you standardize it the epiphany i had was go back and go back to the same number of days that i'm being taught to look for and just look for the high and
low that's where the buy stops are and that's where the cell stops are and there it was it was like solomon's mind just opened up all the Fort knox opened up everything happened that moment a flood of emotions flood of euphoria and fear like oh no did i just do something i wasn't supposed to do did i just learn something and see something i wasn't supposed to that's how i felt i had this big old textbook okay of information i had to digest and i literally didn't want to touch it anymore because in my mind
i had already cracked it i didn't want to go back I did not want to sit with these people and learn anything more than i had already learned there i went from that to the corn market in commodities it was there soybeans live cattle pork bellies they don't trade anymore a silver all the metals palladium platinum high grade copper cotton Lumber orange juice it's all there it's all there once you see it you're never going to forget it and you can't unsee it and when you see these things that repeat over and over again and
they are they're finite you'll prove it to yourself in a in the short little exercise like that pull up a chart i don't care what asset Class it is define it look back the last 20 days last four days in the last 60 days where's the high and low where's the liquidity voids where's the fair value gaps and where's equilibrium and you'll know exactly what price is going to do on that right hand side of your chart it's going to move to those levels now think in terms of overbought and oversold you will be able
to define a range by Doing that you don't need an indicator to tell you if your overbought oversold look at the highest level of liquidity in the form of a high in the last 60 days and the lowest low last 60 days that's your real overbought never sold you don't need to you don't need an indicator for that i've made fun of that stuff in my free tutorials and on youtube you know these guys talking about diversity i don't need a Divergence i need to know where's the range where am i in terms of institutional
overflow the real institutional overflow the what i'm talking about you don't hear this talk chris lori is not teaching this stuff okay online trading isn't teaching it youtube guys on there they're not teaching this these are finite things unless you came from where i came from you're not seeing or learning or even knowing about this Stuff it gets deeper than this it gets more specific than this this was just the beginning stages of what i i'm taking you whether you realize i'm taking you through the whole process of how i became ict the things i
learned the way i learned it the the process of how i got to it it's what you're seeing here one stage at a time and how do i know it's like this because I journal i've kept a journal for years and i remember certain things because i journal i go back in time and look at certain things i get to relive that moment that's why i'm so passionate about teaching you even before i started charging look how passionate i've always been i've always been passionate because i know what it was like for me to experience
it to go through the process In that euphoric moment when i finally got to what you're all aspiring to be knowledgeable knowing exactly what you're going to do with these candles on your chart what's this telling you what are you going to do with this information i'm making money with this i'm building a business i'm building a future for my family i'm building a means of being able to build a legacy for my family do they never have to be Supported to a employer you're going to make your own way with this information and i'm
interested in that i'm i'm passionate about that and when you do these things and you go through the processes of things i'm telling you to do with this month's content doing these exercises beyond the shadow of doubt it's going to blow your mind you're already here it's not a sales Pitch i don't need to sell anything to you you're seeing it but you're not really seeing it yet you haven't done that yet when you do as soon as you do it i'm telling you the form is going to light up you're going to be oh
you're going to be all over the place you're going to be throwing up char son sunday look at this it did it here it did it here this is it then then you are not gonna be able to sleep it's Gonna be like no doze forget about it caffeine you won't need it you're gonna be jumping around hopped up on goofballs because you literally won't be able to contain yourself because you know exactly what you're looking for going forward that's exactly what traders want you're asking for setups give me signals no that's not what you
want really break it down you want to know what i know you want to know when you are going to Take a trade because think about that's ultimate control because if you know where to find the next 20 30 50 60 trading opportunities you don't have to trade today do you contrast it to what you felt like this morning before the session opened up you're hoping i'll give you something right now because you want to take a trade and it only comes because you don't know anything right now You don't know what you want to
do you want to focus on the common goal is that this information is going to take you to the understanding of knowing what it is that you are going to do and when you don't want to do it to stop distracting yourself by going through old content don't even watch my free tutorials this month just focus on this because believe me it's a lot it's a lot of stuff then and only then Start amplifying it you know by doing the other stuff and the new things that we teach in february going forward but there's a
lot of things that you need to be paying attention to for this month if you miss this you're going to struggle the rest of the mentorship and i mean that and if you don't stay it's because you didn't take my words to heart right now because you don't you're not you're not Trying to do it and guess what there's no shame in that because if you don't want to do the work what's required here you're not going to make it in trading regardless if we had everything i was going to teach in this whole entire
mentorship it's all between your ears it's going to be the problem so this is the dividing marker for many of you if you can't submit to what's required and that you have to do in January you might just hang it up just you know forget about it don't worry about it and you know go back to watching free tutorials and youtube videos and and then be content with that and don't let it beat you up because you have now arrived at that's the final decision maker because if you're not going to be organized if you're
not going to be disciplined to do the work that's necessary you're never going to Trade not in fine profitability it won't happen it's not going to happen you want reality you want truth that's what this is you won't make money at all unless you submit and do the things i'm gonna teach you in january everything if you don't do these things with one thousand percent of surety You're wasting your time with me you're wasting your money with me and you're never going to be profitable with the things that i teach it's not going to happen
you'll have hit and miss results and you're going to undo everything because you're going to just go nuts you're going to just over trade trying to get it all back and you don't need to do any of those types of things you can be very boring about it and that's what you want you want to be Boring you want you want that same feeling when you go to work it's the same thing every day same people every day that's what you want your trading to be same thing i know in 60 days looking back that's
where i need to be focusing on last 40 days where that's what i need to be focusing on last 20 days that's what i need to be focusing on take that information cast it forward those levels cast it forward they're Going to be influential in the future and there's going to be new levels that create highers and lows 20 days going forward 40 days going forward 60 days going forward and by doing that you get a future level to draw a vertical line on and look back 20 40 and 60 days and if you get
an overlap that's when the magic happens and with that kids i'm going to close it Wish you a very good day and i will have the recording up as soon as i'm humanly possible can i guess i do have to do another session so this one might have to go on a little bit later because i do want to do a live recap another live recap but a recap of today's price action and then i'll have this one up afterwards so uh because it takes a little bit more time for this longer ones to compress
and Hopefully you guys found it insightful i'm going to wish you all a very good day and good luck and good trading