I've been trading for 7 years and I've tested hundreds of strategies ICT SMC supply and demand but the problem is all of those strategies are complicated or don't work in the last 3 months I've averaged $100,000 a month using one strategy that only requires one candle it's simple and repeatable but the best part is it doesn't require bias or to learn a 100 different concepts in today's video I'll explain the full strategy and back test it over a onee period to show you real results now before we get into the actual back testing we need to understand what this strategy is and how it only uses one simple candle now the strategy is very simple but it has a couple steps that I want to talk about so you know exactly how to trade it and then at the end of the video I'll show you the back testing results that this strategy had over a one we period of time if you only traded this one strategy so here's how the strategy Works number one you want to look at your previous Day candle your previous Day candle is going to be the candle that forms from 9:30 a. m. eastern to 4:00 p.
m. Eastern this is your previous Day candle the reason we want to look for the previous Day candle is because this is where the most liquidity sits at the highs and lows from previous days if you haven't seen my liquidity and Market structure video make sure to watch that video as well on my channel however the most liquidity intraday meaning in the day sits above and below the previous day high and low this is very important to understand because if you understand this concept then you know that if the stock breaks Above This level or is even near the previous day high or near the previous day low this is a level we need to pay attention to based off of how much buyers or sellers are sitting at these levels so what we do for the setup is Mark out the high and low of the previous Day candle from once again 9:30 a. m.
eastern to 400 p. m. Eastern now once we have the previous day high and low candle Mark we now wait for the first 5 minute candle intraday the first 5-minute candle forms from 9:30 a.
m. eastern to 9:35 a. m.
eastern so we wait for the first 5 minute candle to form and once the candle forms we once again Mark out the high and low of the first 5minute candle now the reason we Mark out the high and low of the first 5-minute candle is very similar to why we Mark out the high and low of the previous day high and low candle this is because the first 5minute candle has the most liquidity sitting there because it is the first candle that closed intra day and you have to understand the majority of volume usually occurs within the first hour of the day therefore the first 5-minute candle is where there's going to be the most volume and that is exactly why we Mark out the high and low because we know the most liquidity sits at previous day high and lows but the next level the most liquidity sits at is going to be the first 5 minute High and the first 5 minute low and from here all we do is wait for the break and retest now you may have seen my previous video on the 5-minute opening range how however now we're going to combine the previous day high and low with the 5-minute opening range to increase your win rate and we're going to talk about how to increase your win rate when we're actually back testing the trades and seeing real examples now all we're waiting for for the first 5minute break and retest is the stock to break above the 5 minute high and then retest for myself personally I trade on the 1 minute time frame so after I Mark out the high and low of the first 5-minute candle I go down to the 1 minute candle and then I'm simply waiting for the breakout of the 5 minute candle and then the retest there's a couple things you must know when you're looking for the retest to actually enter in off of number one we need strong price action on the retest level we're going to talk about price action in this video however I have a full guy talking about price action as well number two 9:30 to 11:00 a. m. eastern that is the time that I trade every single day I do not trade after 11:00 a.
m. eastern and therefore for our setup we will only be looking for setups this week before 11:00 a. m.
eastern number three we need a clear Direction in the markets and the 5 minute opening range will help us do that and you will see how that works in the actual back testing session number four we're going to need lowrisk High reward trades for myself personally I always need at least a 2 R multiple this means for every $100 of risk I need to make $200 of profit and therefore every trade that we take in the examples we will have a 2 R multiple per trade and finally something that a lot of people overlook keep it simple a lot of Traders will see this setup in this strategy and they will try to add even more confluences but the more confluences you add the more chance you have of having analysis paralysis analysis paralysis refers to the fact that when you see your entry you do not enter because you're scared to enter you're looking for too many confirmations so for myself one thing that I learned that really help me is to keep everything super simple and therefore when I see my entry I take it with the exact same risk parameters every time now if you're still a little bit confused about the strategy and how it works let's go look at some real examples to help you solidify this concept okay so here we are on Tesla and what we're going to do is back test over a 1we period like I said the first thing we have to do is Mark out the low and the high of the previous day now this previous day comes from 9:30 a. m. eastern to 400 p.
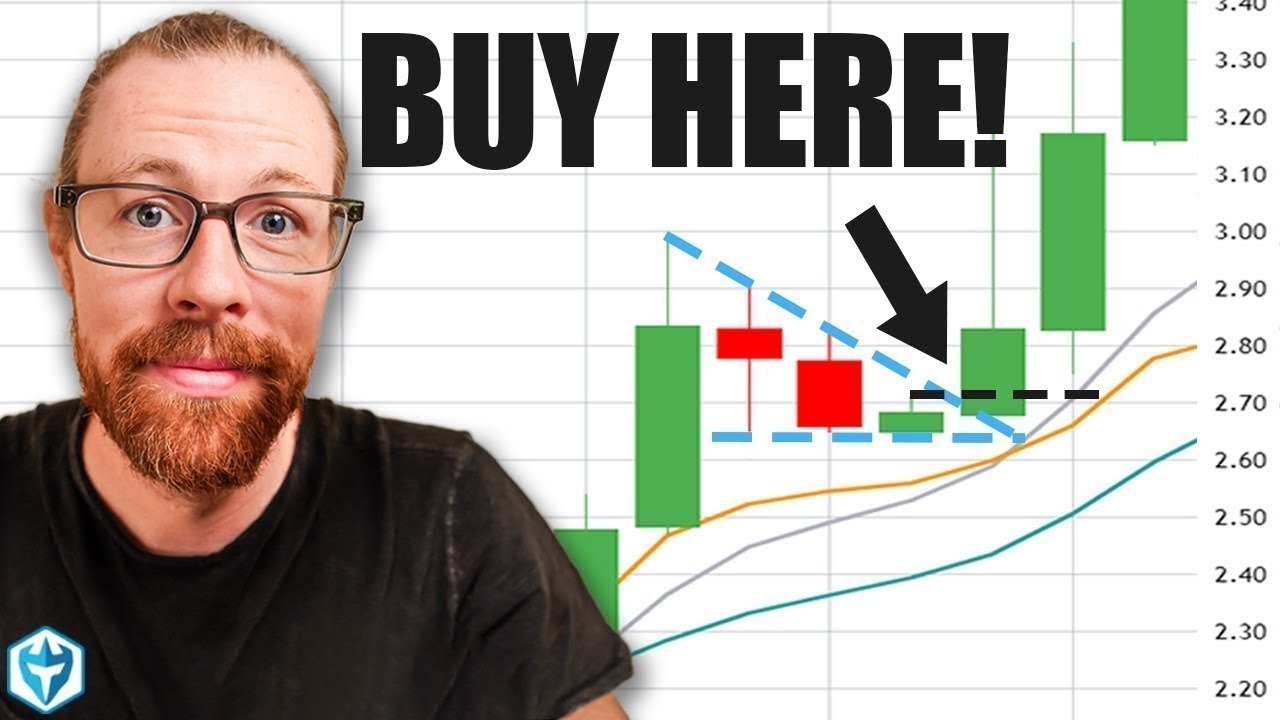
m. Eastern so the high and low of the previous day we Mark out as we can see we are currently in Pre market right here and now the next step is waiting for the first 5 minute candle to form so let's wait for the first 5 minutes 1 2 3 4 5 this is the first 5 minutes as we can see we have the 5 minute high up here and we have the 5 minute low down here this is going to be our first 5minute candle and as we can see we are in the range of the previous day high and the previous day low so the previous day high and previous day low like we know have the most liquidity and we are currently in the middle of the range but the first 5-minute candle can tell us a lot of information this candle here tells us that we broke to the upside so we actually had this pre-market High we broke the pre-market High could not hold above the pre-market high and came all the way back down putting in a very bearish candle right very strong upper Wick and we can see the body close below so buyers opened up the stock here try to bring it all the way to the highs sell rejected at this 5-minute high and we brought it all the way back down now until this 5-minute candle breaks we do not do anything we need to wait for this 5-minute candle to break but we go to the 1 minute time frame and now all we're waiting for is a break below this 5-minute range a retest of the 5-minute range for a move to the downside or we could even potentially look for a break below this 5-minute range and a retest of this previous day low for a move to the downside and this is of course because the 5minute is showing us that it's very weak and the stock is near the previous day low so let's play out this trade and see what happens as we can see the stock actually ended up breaking below therefore this confirms that we are looking for a downtrend but now the stock has actually hit the previous day low level so as we can see now what's happening is buyers are stepping in on this previous day low trying to defend this level so for us we're not trying to fight these buyers what we're going to do is if the the stock comes back and retests this previous 5 minute low this is going to be the lowest risk entry for us this is going to be the lowest risk because if it breaks back Above This 5minute range right we're not interested in the stock so we can have our stop loss fairly tight here but what we're going to be looking for is the move back down into this previous day low level and also low of day the reason this is is because now buyers are stepping in so sellers are going to step back in where at the 5-minute lows now the next time we come back near this level we're going to chip away at the buyers that are sitting here now if buyers are obviously too strong at this previous day low level right this is going to be used as support and it'll break back above the 5 minute range therefore the lowest risk entry for this trade to work is going to be the retest of the first 5 minute low so let's play out this trade and here we can see that we're retesting back into that 5-minute low now when we retest back into this 5minute low what do we see well this candle opened up right here we moved all the way back to that previous 5 minute low right here and what happens sellers stepped in and they created this big wick showing that sellers are trying to stay in control and hold the stock below this 5 minute range so what do we want to do in this specific trade this will be trade one we want to enter the trade here our stop loss can be the break of this 5minute candle right here or the impulse candle that broke the 5minute low and our profit Target here can either be at the previous day low which gives us a 2. 07 risk to reward or it can be low of day for this case scenario here we can just use low of day and this will be a 2.
78 r trade meaning for every $100 of risk we would make $278 now we're going to enter into a short position here and let's see exactly what happens for the first trade now as we can see we just hit low of day right there this was a $1,430 trade by simply using that 5 minute low as a retest having our stop loss at the break of the impulsive candle and having our profit targets at at least two R multiple now at the end of the video I will show you the results over this whole onee period but for right now let's go over to trade two all right here we are on the second day and what we have to do is Mark out the low of the previous day and the high of the previous day now once we Mark out the high and low of the previous day like I said all we have to do is wait for the first 5 minute candle this example here we can see that the first 5minute candle actually forms near where it forms right near the previous high of day right so previous high of day is right up here and the first 5-minute candle is right up here as well so most likely what we would be looking for is a break Above This previous High the retest into this previous high and then a move up from there the beauty of this is we can see that there is a lot of liquidity sitting here therefore if we do break that previous high and retest this is going to be a really high quality setup because buyers are going to want to keep the stock not only above the previous day high but also above the 5 minute High let's play out this trade and see the entry we get as we can see here what's going on well we're retesting here but we can see that this candle right here is actually still below the previous day close now you can enter in on this candle right here because it's retesting the 5-minute high and it's closing above the 5 high but we're going to wait for a little bit more confirmation to show that this trade is indeed strong enough and buyers are strong enough to bring it back above the previous day high level as well just because it's so close and as we can see here this candle does signify that buyers are stepping back up and therefore we want to hold this previous pivot level so we can enter into this trade here with our stop loss simply below this previous pivot level this would break back into the 5-minute candle as well and it would break previous day high therefore we do not want to break this previous pivot level and our profit target has to be at least a 2 R multiple in this case scenario 2 R multiple comes at this 214 whole psychological number this would be a 2. 11 r trade meaning for every $100 of risk we would make $211 let's enter into the trade here and see exactly what happens and just like that in 1 2 three candles all it took was three candles and this was a $22,000 day now if you were to take this setup on this day you would be done at 949 The Market opens at 9:30 so as you can see very effective setup to be done the day extremely quickly but also simple enough that you can understand this and actually execute it every single time that you see it so $2,000 day on day number two now let's go over to day number three all right here we are on day number three we're going to Mark out the previous day high up here and then we're going to Mark out the previous day low down here now as we can see we are opening up in range once again but we want to wait for the first 5 minute candles to open up so let's wait for the first 5 minute candles so this is the first 5minute candle we Mark out the low of the first 5-minute candle and we Mark out the high of the first 5-minute candle as we can see we are in range so therefore what we want to do is break out of the 5-minute high and low and retest so let's wait for that to happen as we can see here this is a good example of why we're not breakout Traders with this strategy because right here what happened well the stock came and it broke above the 5- minute High however it never retested and it never confirmed that breakout with strong displacement and we are now moving back into the 5minute range now so far we are in between the previous day high the previous day low and in between the 5 minute High and the 5- minute low this strategy also allows you to not trade on choppy or consolidation days in this example right here it seems like today is most likely just going to be consolid idation and this is because we are in the 5minute range and we are still in between the previous day high and low however we have to wait until 11: for the trade to actually present to us an entry and as we can see from this example it's currently 1123 a. m.
like I said I only trade from 9:30 a. m. to 11:00 a.
m. eastern time but the stock has not broken above or below previous day high and low or the 5-minute opening range it is consolidation and choppy this is when most Traders lose money most Traders lose money on days like today because it is so choppy and that's when they're trying to enter their A+ setup but they're forcing every single trade so what the strategy will allow you to do is get rid of all this noise right this is noise and consolidation me personally I'm a momentum Trader and therefore this simply just does not work with me now on day number three we can see that no trade presented itself before 11:00 a. m.
eastern now let's go over to day number four so here we are on day number four we Mark out the high and low of the previous day now as you can see that the previous day this was the consolidation or choppy day that we did not want to trade right there was no opportunity till 11:00 so with that being said for the day we are actually trading now what we have to do is wait for the first 5minute High and the 5 minute low so let's play out this trade so here's the high and here's the low of the first 5 minute candle now as we can see we are also above pre-market high and we're above the previous day high there for all indications are leading for us to break out of this retest and then look for a potential move to the upside so let's wait for this trade to break and then retest as we can see here this trade actually did move up however when we broke out we never retested this was more of a consolidation right we can see no displacement occurred displacement is simply the fact when you break out of a potential resistance when you come back for the support it's the distance in price from your previous resistance turn support to the high that you made however as we can see in this example here we never had any displacement right the next candle basically came back down and we Consolidated for a move up therefore there was no entry on this trade now we can see that we are moving back to the downside so now what we could be looking for is a break and then the retest of that previous 5 minute low or the previous day high so let's play out this trade once again all we're seeing really is consolidation I wouldn't call this a retest because there has not been a single candle that hasn't Wicked into this level you want to see the stock break out and then retest for a move to the downside so let's keep playing out this trade all right so now what we're getting here is actually the retest of that previous 5 minute low now this retest right here as we can see we created this low we actually got some displacement and now we're moving back to the upside so we can look for a short position here with our stop loss at a break of of this previous consolidation or this Wick high that broke this 5 minute low and our profit Target needs to be at least a two R multiple which comes essentially near low of day so let's enter into a short position and see exactly what happens as we can see right here unfortunately this trade did not work out we came back down and then we broke to the upside now the reason I'm back testing this over a onee period is to show you every single day what these results would look like most people when they make these videos they don't show you the losses so when you go and enter a trade it may be a good trade but when you lose you think the strategy doesn't work but in reality there will be losses with any strategy that you take and this trade right here was a good example of a loss this was a little bit of a choppier day because when we broke out of the 5-minute High We rejected all the way down to the 5-minute low but then now we're coming right back into the 5-minute range and therefore we know that this isn't a day that we want to trade now this was a 1, $640 loss like I said I will show the full results of every single trade that we took at the end of this video but let's go over to the final day all right here we are on the final day we're going to Mark out the previous day high and we're going to Mark out the previous day low from here we come on over to the 5 minute here we Mark out the 5 minute low and we Mark out the 5 minute high now all we're looking for is a break and a retest from this level as we can see so far we are moving to the upside very nicely therefore most likely we're going to wait for the 5-minute retest of this previous high as we can see here this is similar to an example we saw earlier however this is a little bit different it's because as we can see we did break this 5minute high and we are consolidating but look at this consolidation compared to what we had earlier earlier when we had consolidation the stock came up to this 5-minute high and it was breaking back below up back below and up right but in this example here we can see that the stock broke above the 5minute high and it's trying to hold above the 5minute high and we know this because the stock opens up here and then it breaks down because sellers are trying to bring the stock back below the 5minute high but the buyers keep stepping up and having these strong Wicks which means buyers are present and they are really trying to keep the stock above the 5 minute opening range so this entry right here you understand more using price action however this is going to be a good entry for us to go long on this position now our stop loss in this scenario here can simply be this candle low because if the stock does close below this candle low this signifies that we're breaking back to the downside and therefore we do not want to be in the trade it is very low risk we need at least a 2 R multiple on this trade this comes near 215 but as we can see here why do we keep marking out the previous day high and low levels it's because we can also use those previous day high and low levels as a potential profit Target or a potential retest level in conjunction with the 5 minute retest in this example here what we can do is we can mark this first to our multiple as a partial and then we can look for our final targets all the way up here at this previous high of Day level so this gives us a 6. 37 r trade but the first partials we take are going to be at our 2 R multiple so let's enter into the position here now if you don't know how to scale or take partials then you can of course look for this 2 R multiple and the trade would be done but if you do know how to scale and you've watched my video If you haven't make sure to watch last week's video it is a full guide on how to start trading and then once you watch that video then you'll understand how to scale as well and we can look for the 6. 37 r trade so let's play out this trade this is going to be our first partial right here this is a 2R trade so I'm going to take half of my trade off at this 2 R multiple right here and then we let the other half go all the way up for the 6.
37 r trade now if the trade comes back below this 5minute range then we will stop out the remaining position we have but still have realiz profits because we still took half off at the two R multiple so let's keep playing out this trade as we can see we came back for the retest of this previous pivot level right here we're kind of consolidating here right above this previous pivot level now and just like that we hit that previous day high and now for our full position we made $3,035 by scaling on this position but also using proper risk management while entering into a quality trade so with this being said now let's go look at the results for the full week all right so here are the total results for this week on the left side column here we have the total wins we have the wrist herward in the middle and then finally this right hand column right here is how much we lost now it is very important to talk about how much we risked or how much we could have potentially lost because you need to understand the risk to reward per trade it's obviously great seeing profits but when you lose you need to understand how much you are risking per trade so for the first day here we made $1,430 and we had a 2. 78 r multiple this means to make the $1,430 we risked $514 38 therefore if that trade went against us we would have lost $514 38 day number two we made $260 with a 2. 11 r multiple which means if the trade went against us we would have lost $976 30 day number three we didn't take a trade therefore we didn't risk anything nor did we lose anything day number four we actually ended up losing $1,640 now this was on a two our multiple therefore we already lost what we were risking is what we lost finally on day number five we made $3,035 now like you saw on the last example the final profit Target was actually a 6r multiple but because we scaled out half the position at 2 R when you average out the scaling it comes out to a 4.