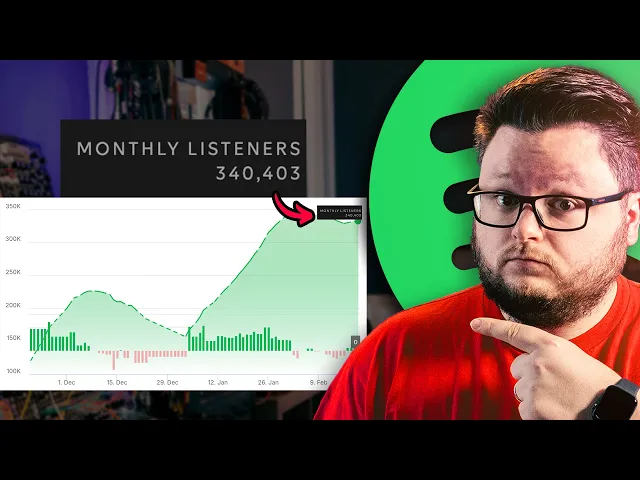
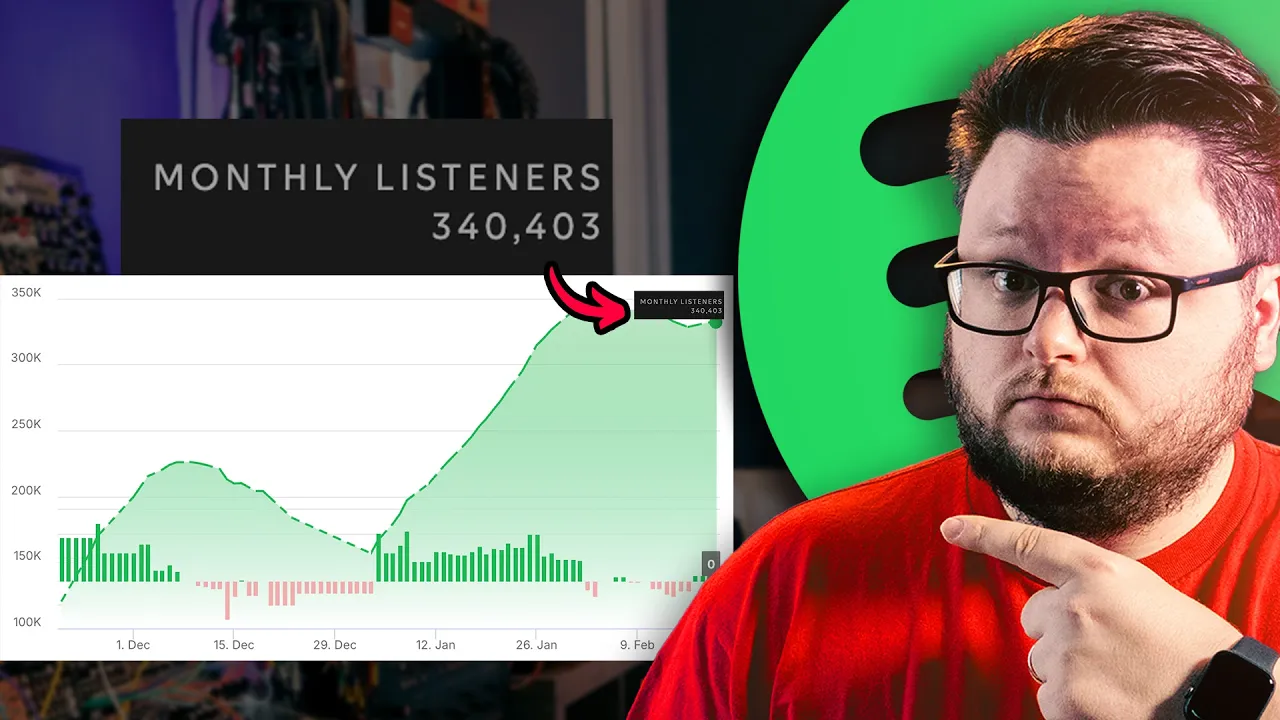
In this video, I'm going to walk you through some campaigns I ran where we got an artist from zero to over 300,000 monthly listeners, over 3 million streams [music] in about 3 months. So, if I look at the last 28 days, 340,000 monthly listeners, and if I look at the lifetime streams, it's 3. 2 million streams, and we started uh early November 2025.
And I'm filming this early February 2026. So December 1 month, January 2 months, and uh February 3 months. So about 3 months, over 300,000 monthly listeners, 340,000, and over uh 3.
2 million streams in the time period. So pretty crazy. This is an abnormal case study.
Anytime I do a video like this with big giant numbers, I'm I'm not trying to tell you that like this is how your marketing should go. This is the exception. This is not the norm.
But all of these numbers are exciting to talk about and um it's interesting going through the case study. So I am going to walk through the ad campaign, but I just want to point that out up front. I don't want anyone to say that you felt misled that like every ad campaign should go like this because this is not the case.
This is a very good ad campaign. Two ad campaigns. Um I did cover this artist before.
I can't say the details of who the artist is and what have you because it's a client of mine and and they don't want their name public, but they did say that I could show the the data and essentially how things were run from their campaign. So, we have EP1 here. They hit about 100,000 monthly listeners in something like 2 weeks and and this is the campaign I covered from that and it's it ended up being an overall $5,000 spend with an average of 16 cents per conversion.
So, essentially the way these ads are run are we're running these ads on Instagram only. We have some simple visuals with with kind of cool vibe footage with lyrics playing over them. People see that, click on the ad, listen now, and they jump to a landing page where they can choose to go to Spotify or Apple or whatever.
Most people go to Spotify, but there are a ton of streams on Apple Music and YouTube Music and other platforms as well. Not 3 million, but I it's a couple hundred thousand across each of those two platforms. So, it is actually a significant amount, just not compared to the ridiculous numbers we're we're getting on Spotify.
But all in all, we've spent about $7,800. And you might be thinking, that's crazy because it is a crazy amount of money. But keep in mind, this this artist has gotten over 3 million streams from this.
And, you know, the the country distribution here is mostly US. In the last month, it's at 67,000 US listeners, which is by far the winning country. Overall, I would assume about $3,000 per million streams.
It's not a crazy assumption. Even if we assume it's about $2,000 per million streams, they've still made their money back, right? Because this would be 3.
2 times 20,000. 3. 2 times 2,000 is $6,400.
So even assuming a very low number, they've made their money back, right? Cuz we have Spotify and then we have the Apple and the YouTube. But assuming a somewhat higher number, cuz I have a feeling it's probably closer to 3,000.
Um that would give us uh 9,600. So, this is actually not only like a very cool case study that grew their audience, they're going to make all their money back with a little bit of margin and longterm they're going to make way more than than they put in. This this anytime you get a campaign this good, this is one of those ones you can just kind of keep dumping money into it.
In fact, I wouldn't be surprised if they want to add more money onto this first one at some point as well. So, that being said, let's look at two different things. one.
First, I'm going to walk you through how the streams developed in Spotify for artists, and then we're going to go into the ad campaign to take a little bit of a peak of how the campaign's set up. I I can't show certain things like the ad creatives just because it gives away the artist essentially, but going into Spotify for artists, we're look at active versus radio versus other versus algorithmic. And I'll just I'll put up other and editorials as well.
So, we got almost everything on here. So, looking at this graph, let's look at streams because I think it it's more relevant here. The bottom section we can see what the biggest sources of streams are.
Active sources are one of the biggest chunks. This is 1. 3 million streams.
Radio is 1. 5 million. And then algorithmic 266.
So we have no editorial, completely blank. Almost no third party playlisting. In fact, we didn't do any third party playlisting that that I'm aware of.
Well, we didn't do any for them, but I don't think the artist did any elsewhere either. And then other is is very small as well. So we can go in and prune this just for the sake of simplicity.
Um so we'll come up and we'll turn off other editorial editorial and we'll and other as well we'll turn off. So we just have the main three. These are the three biggest places.
Um we have 1. 3 million streams active 262,000 algorithmic which which is the algorithm but also radio is algorithmic too. So about 1.
8 eight to 1. 9 million are from the algorithm and then 1. 3 million are what we've actually driven with our ads.
This artist doesn't have a big social following. I think there's a couple hundred Instagram followers and maybe a 100 Facebook followers and no Tik Tok. So small social following.
This is this is all the ad campaign. Now if we zoom in, so at first it's largely the blue is the active and the radio actually happened within a couple days which is rare. Usually, you're not getting a significant radio push a week into the life of a song.
This is like a crazy situation. By a week into the song's life, we're getting more streams from radio than from our ads. And that happened ba basically for the rest of the life of the song minus a couple weeks here where active took back over.
This this is one huge reason why this campaign did so well. And we have we have more algorithmic streams in total than non-algorithmic streams. Um, what usually happens is this radio lags.
So, you have just blue for a while and then you see the radio slowly grow over time and then you get some spikes of algorithmic. So, it'll be several weeks before you see anything and by month two is maybe when you're getting significant numbers. That would be a more typical scenario, not one week into it.
And you might be wondering what happened here. The radio algorithm just went absolutely ba na. And a couple things happened.
We did release a second release in December and that's why the active started going up. This blue line started going up because we started running another campaign for their next release. So the blue starts going up.
But this big radio jump is actually because the artists became eligible for discovery mode starting January 1st. So, the Discovery Mode in this case took their daily radio streams from about 8,000 streams a day, maybe 10,000 streams a day, up to 30,000 streams a day. [laughter] [gasps] So, you know, Discovery Mode's a controversial tool because Spotify takes a 30% of the royalties you get from the discovery mode context, which is radio and autoplay essentially.
But it took the song from 10,000 to 30,000. So even if they take 30% of 30,000, it's it's like we're getting paid for 21,000 streams. So it actually doubled their radio revenue even after Spotify's cut using Discovery Mode doubled the artists radio revenue.
And we're talking, you know, 21,000 streams a day they're getting paid for out of a total 30 plus thousand. 30,000 streams a day is gonna pay like $90 a day. And so that's a pretty huge jump, right?
Getting paid an extra $30 a day for free from the algorithm is is a is a big nice jump to get for doing absolutely nothing but check a box to opt into discovery mode. So So that was the biggest jump. This is what allowed the artist to jump from 100k monthly listeners to 340 essentially.
Like we this second campaign helped a lot, but the biggest reason why they grew so much in about a month span was just discovery mode. Unfortunately, February is off to a reasonably good start as well. Discovery mode is kind of a random thing.
Like every month it changes. You never know it's going to go up or down. So, it's kind of scary to rely on it.
Um, but that's what we have our ads for to to gain an actual audience. Now, flipping over to those ads. Um, I did cover this first campaign in the previous video, but I'll open it up real quick.
All right. So, I did some checking. These bottom three adets are for the first EP1, and the top two adsets are for EP2.
So, um, in a nutshell, this first campaign was 16 cents. It almost all went to this R&B category. We did try targeting pop music and we did try targeting R&B artists.
So, if I go in here to this R&B one, um, we are using dynamic ad creative, but we're targeting our tier one and two countries with Spotify narrowed by just some R&B targets. Contemporary R&B, rhythm and blues, soul music. The pop music one is very similar except it's targeting pop music.
The R&B artist is targeting just a few like poppy R&B artists. Not even a full extensive list, just a list of a couple. That kind of makes sense.
And then the ads are running solely to the main four Instagram placements. Uh in a nutshell, that's the campaign. It's very simple, right?
We have the ad creators and we do have I think eight videos. They are all actually Kashi visuals. So they are quite simple.
I'll put a an example of one of the videos right here with no audio so you can see what I mean. Um maybe I'll put a couple there just so you can see the style of of videos that we're using. They're very simple, nothing fancy that we're using Kashi.
I do have a link for Kashi below if you want to try it out. It's a way to make ads really quickly and and cheaply. We did try other videos in here, too, but this just worked for the first one, so we just kept going with it.
And then we did it again for the second one and it's been going just as well. But on that note, if I flip back in, the same kind of story ended up happening for the second one. So R&B was ended up being the winner and then R&B artist did okay, but didn't get many conversions.
And it's the same exact targeting for both of these. I think it's worth showing from this first campaign, if I go into the charts, how did the money actually get spent over time? And I talked about this before when I when I talked about this campaign in that other video, but we were up to 5,000 ad spend now, right?
So, I think a lot of people might be interested in how did the spend develop over the life of the campaign. When did we raise the budget, when did we lower it, etc. So, we started the campaign.
I guess we actually did start it on October 31st. I thought we had a couple day lag, but it did go live on release day. Let me zoom in.
Um, we actually stopped running it on December 17th, which is roughly when the other campaign started. And if I look at the amount spent, you'll see that the campaign went live at about $22 a day, which is fairly typical, I would say, for us. I don't I'm not a fan of the launch your campaigns at hundreds of dollars a day approach.
I found it just most of the time leads to artists burning money. They'd rather not burn. I would rather find out if a campaign's going to go well before I raise it instead of waiting until I burn half my budget to just to realize if it's going good or not.
So, I always start lower. This artist did not start with the 5,000 planned I had spent. It started off at I much less.
I don't remember what the number was, but after we get this proof of concept, like cool, let's start going crazy. $100 a day, $150 a day, $200 a day, $150 a day. um we hit the spending limit of whatever we initially planned and then there was a gap and then we got approval to go for more budget and then we had um $100 a day, $150 a day and then some ramping down until we hit the $5,000 mark.
Okay, so that's the timeline. um it probably could have been done a little bit better and maybe it could have been scaled up further and obviously having a gap in the middle is not ideal, but these are the realities that happen when you're you're running campaigns for other people and there's but fixed budgets in mind, right? Like we we can't just keep spending money.
We have to go to the the the client and be like, "Hey, um do you want to add more money? " And then sometimes that takes a while to make a decision. So, uh, for release two though, it is essentially the the same story.
If I go and I adjust the time frame to December to now, this one's still running. This one hasn't been cranked up, but it's been doing great, and we've been a little more cautious with it. We're back looking at the first campaign.
The cost per conversion started at 10, and then when we cranked the budget up to $100 a day, that actually brought our cost per conversion up to 15 cents a day. um and it actually crept all the way up to 16 cents. So So this is the price you pay when you're increasing your budgets.
This is why I don't increase budgets right out the gate or if if I don't think it's it's worthwhile. Like if you have a campaign that's 50 cents a conversion, cranking up to $100 a day is probably going to make her up to 75 cents a conversion. Maybe not.
But that's why you kind of want to incrementally take things up. In this case, we just went for the gold. Like it's 10 cents a conversion.
Who cares if it goes to 15? Like whatever, right? Uh that's still a fantastic result.
And it did actually kind of settle, right? It didn't keep growing up. Now, this other campaign, it's a little more stable.
It actually has improved since running. We don't have any big increases in daily spend. I don't actually know why we lowered it here, but the the cost actually like has gone down through it, and that's because we haven't like jacked it up.
Now, one thing a lot of people don't know about meta ads, you can go in this breakdown and you can see a lot of different data about who's converting and who's not. So, for example, I can go in and look at age and I can see what is the age distribution of everyone converting. Uh, in this case, it's mostly 18 to 34, which given the style of music makes total sense.
I can go in and I can look at placement. And I know we're doing Instagram only, but where on Instagram, right, in this case, it's Instagram reels. And for the first one, it's also Instagram reels, which I also would kind of expect given the style of music and the younger age group.
More people are going to be on Instagram reels than than many other places. The gender, I would expect this to be more women, but let's see. Um, it is, which makes sense.
It it this is like young woman is kind of the target demographic with this. We set up the ads where we're targeting like a pretty broad thing. I'm actually don't know why there's a 65 plus in here.
That's definitely a mistake. I never include 65 plus. It ended up being fine, but keep that in mind.
The the actual age group target, I believe, was 18 to 45 or 18 to 50. 18 to 50. Now, actually, this is where one of those annoying advantage plus things come into play.
Meta was treating our age as a suggestion. So, we should have turned this off. This can actually ruin your entire campaign.
So, we actually just kind of lucked out that it didn't. And I'm not going to mess with it now because the campaign's working fine. But this is why we had some budget go to 65 plus is because we had that toggle on.
Meta kind of sneaks these things on you from time to time. But another interesting metric is going to be geography. So we can look at country and uh we're doing a tier one tier 2 approach.
So we're just giving basically most countries. We're not doing like India, Philippines and Pakistan and and Africa and stuff like that to be like really cheap. We're doing tier one, tier two, which is like the tier one is kind of the countries you'd expect like expensive um like US, UK, Australia, most of Europe, and tier two is Brazil, Mexico, Malaysia.
I think I think Spain might be tier two, but either way, it's like cheaper countries, and then tier one's more expensive countries. 15,000 conversions total. We have 5,000 from Brazil, which is about a third.
We have a couple thousand from Brazil, but then 3,000 US. So, this one is is a pretty big chunk US. Now, the first campaign we ran out of 31,000 streams, 7,000 were US, 4,000 Mexico, 9,000 Brazil.
So, so actually both these campaigns, Brazil was the number one country. And this is a thing that I have said a lot of times, but I'll say it again because it begs repeating and I keep getting it brought up a lot. Even if your number one country is Brazil, you probably will end up with the US being your number one country.
And you just saw our number one country for both of these campaigns is Brazil, right? No other country has more conversions in either of these than Brazil. Yet, when we go to the stats and we go to locations, our number one country is by far the United States.
Brazil is a number two, Mexico is number three, but the number one's the US. And this is because your algorithmic traction has nothing to do with the country that caused the algorithmic traction. So, one reason why you want to include the tier 2 markets in your ads is it allows you to get enough data onto your song of actual people engaging with it, saving it, adding it to playlist, listening multiple times and then Spotify uses that to find you more people and a lot of the times that it ends up being in the US.
Part of the reason why US is a huge country compared to a lot of other countries in the world and there's also a lot of paying Spotify users. Now, the other reason why you you want to include it is because, in my opinion, if you're like a brand new artist, I don't think you should be picky about where you you find your fans. I think you should just be worried about let's just build up some momentum, learn some stuff, get some results, get in the algorithm, and then maybe start getting more picky because there are a lot of valid reasons, especially if you're an American artist, to say, "Hey, I want to grow my fan base in the US.
" Namely, touring or shipping out merch or selling physical media. It's really hard to do that internationally. And so there is a lot of value in growing your audience where you live.
That being said, when you're focused on streaming, it's better to do a more global approach because of this fact, right? Brazil and Mexico, but specifically Brazil had the most amount of conversions. Brazil and Mexico combined had the most, but the US has more listeners than both Brazil and Mexico combined in there.
And that's going to largely be because of the magical algorithm. Now, if you want to learn how to run campaigns like this yourself, you can check out this video to see the entire process from start to finish in excruciating detail. Uh, and make sure you subscribe and ring that bell so you can see other awesome case studies like this, other tutorials for to learn how to promote your music.
Thanks so much for watching and I'll see you in the next video. Bye.