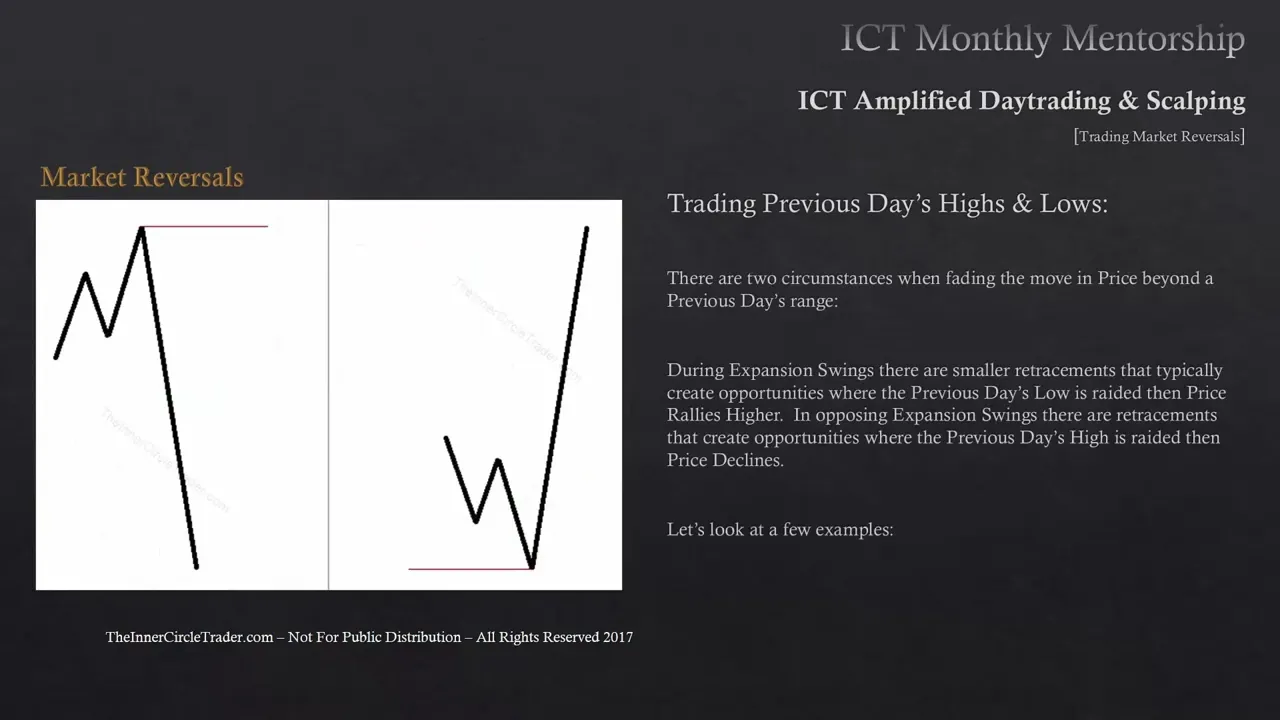
okay folks welcome back to lesson five of the May 2017 ICT mentorship ICT Amplified day trading and scalping this lessons teaching trading Market reversals all right Market reversals I'm going to cover the eight reversals that I think that can be effectively traded with consistency and the first one we're going to talk about is trading previous day's highs and what we're doing is we're looking for opportunities where the market will blow out the previous High or previous days high specifically raid the buy stops and then reverse and trade lower there's certain criteria that I like to
look for and back on baby Pips when I first introduced myself to the Forex community at Large they were given a exercise by me to buy and sell previous days highs and lows and that exercise was to draw your attention to the fact that there are instances that will lead you to seeing opportunities by rating the previous day's lows cell stops and reading the previous days high for buy stops not every previous day's high or low is the same in terms of an opportunity but there's a criteria that I look for when I'm looking at
previous days high there's buy stops above that previous day's High there's banking levels there's uh intraday algorithms that go up to those previous days highs and down to its previous days lows the secret liquidity that will be resting below or above it respectively knowing the conditions that leads to a raid on the buy stops on the previous day's high is one of the gems of this teaching and conversely the opposite is seen when we're looking for previous day's lows where the market reads the cell stops and then reverses again in this teaching I'm going to
give you like one of the Little Gems in my my repertoire where I look for previous days lows and previous days highs to be rated out and then a directional bias is seen as a reversal I get a lot of questions a lot over the years you know how how can I sell above an old high and not fear it continuing going higher and or how can I buy below a previous low and not fear it keeps trading lower well number one again I've said this many times in free tutorials and all throughout this mentorship
I don't know with 100 assurity what price is going to do but I do have a collection of generic scenarios that tend to repeat themselves when there's other fact there's Incorporated in those conditions by itself you know we don't simply just go in here and try to sell old high or buy old low there has to be other things that blend well with all the teachings I've already given you thus far foreign is the intra week High where the market trades above the highest high it's made for the week so far rates the buy stops
and then reverses now as I give you these scenarios I want you to think in terms of those weekly templates that provided you in earlier months those templates in conjunction with the conditions that we're talking about here they will unlock as we get closer and closer to August where you get a basically a flow chart format from top down where we go right into specific concepts for specific conditions but for ancient week highs what I like to do is look for scenarios where the market has already been trading for instance higher for a period of
time and we have yet to meet a premium array that eventually gets traded up to say maybe on a Tuesday or Wednesday or Thursday and it hits that on that particular day but it also does it on the heels of running out of previous intra week high I really like that scenario because Traders are going to be looking to have their buy stops above that initial intra week high for instance they could have made a a high on Tuesday and then trade higher on Wednesday up into a higher time frame premium array once that higher
time frame premium array is traded to it's coupled with buy stops that will be resting above for instance Tuesday's highs so traders that would be looking to sell short on Tuesday because maybe many times Tuesday can create a false decline or false high and then Wednesday will come up here and blow it out and then that's the high of the week think about those weekly templates this is one of the scenarios I like to look for and those raids on those buy stops I'm going to be selling right into that same liquidity pool just like
the banks will okay Ops is obviously seen in the form of an intra-week low where we see the the lowest low on the week be violated on the downside and the cell stops be rated and the market reverses now again for day trading purposes and scalping it's these are really high odds uh trades where even if it doesn't continuously move higher as a reversal many times you get a tradable bounce that is 30 60 even 80 Pips depend upon what type of Market environment you're looking at or what you're trading in at the time but
the weekly low that's formed in the middle of the week now that could be Monday it could be Tuesday it could be Wednesday it could be Thursday whatever that low is if it's traded down below it into a higher time frame discount array that coupled with the running out of a previous intra week low to take those cell stops out for those individuals that want to try to capture along they're going to be premature many times and the market makers will engineer liquidity for that very thing to happen so for instance if there was a
low of the week on Tuesday and it rallies up and then Wednesday it trades down below Tuesday's low but then on that Wednesday it hits that higher time frame discount array it could be a fair value gap on the daily chart it could be a order block on a weekly chart it could be anything on the higher time frame PD array Matrix that is a wonderful opportunity to look for a reversal entry week intermediate term highs now this is going to be a little bit longer term it may be a high of the previous week
or a week before it so it's going back a little bit more in terms of time and what we would be looking for is a run above an old high basically and those buy stocks that will be resting above that old high they would be rated in the market reverses now this can be a little bit tricky because the old highs and old buy stops that will be resting there or just above it you have to look at the the context of the marketplace at the time again it's not just simply okay I'm we're trading
above an old high so therefore you know it's going to be resistance let's just sell it there no you have to look at what what's the purpose What's the storyline behind why price would be permitted to trade above that intermediate term High yes they're looking to take those buy stocks but there's a storyline behind it is it pairing up those orders to go in to an exit of Longs or is it going up there to engineer liquidity to put people on the wrong side of the marketplace and then go lower those ideas had to be
at least considered when you're looking at it so not every old high is one to be selling short at many times it's going to be trading through an old high and can continuously go through it so you have to look at the context of the marketplace at your current time of analysis and weigh out whether or not are we in a mood that's going to most likely continuously go through that high or are we due to to reverse because above that old intermittent term High fulfills a higher time frame PD array or does it go
above that high after a long prolonged uptrend where logical profit taking would be met and obviously the reverse would be seen as an intermediate term low where last week's low or a couple weeks ago previous month that type of scenario where price trades down below that old low and it raids the sell stops and then the market reverses just as we said with the intermediate term highs we don't simply just buy the sell stops and anticipate a reversal in every old low there has to be a context that's used What's the storyline again what is
the purpose for the market makers to permit price to trade down below that old low is it scooping up sell stops to use as a exit for their short positions they've been in or are they looking to knock off those individuals that were already going long and they want to knock them out and unseat them and take their long positions over okay New York session reversals now when we look at New York session generally it's a continuation the characteristic of New York I like to view first and foremost is it's a continuation generally of what
was already established in London if London was a bullish uh rallying making the low of the day that means I'm going to be in first looking for signs that there's a continuation on that move going higher from New York's open going into London's close but there are instances where that if London created the low of the day or what would be an initial law of the day it rallies up and goes into New York but in New York reverses and goes lower and then you end up having a lower close on the day that occurs
when the markets trade into a higher time frame premium array in this case as I was outlining or the reversal scene if London starts trading lower creates the high of the day then New York creates the low of the day reverses and ends up closing higher on the day above all the range that was created in London so there's New York session reversals they occur when price eventually trades to a higher time frame discount or premium array and the London close everything I just mentioned for New York session reversals applies to London clothes but also
intraday obviously on large range days when we have a five day average daily range that's exceeded for instance say we have a an average daily range for the last five days in the euro dollar and today's ADR for last five days is indicating that it should be 100 Pips well let's say it rallies 160 Pips when we get into 10 o'clock and 11 o'clock in the morning New York time you can anticipate a London close reversal for an intraday Scout where price will want to come back a certain measure of that range and we'll talk
about that later on but London clothes can be a reversal of sorts just like I outlined for New York but it also always has the potential to create an intraday scalp but I like to only do it when the average daily range of the last five days has been exceeded at least one and a quarter to one and a third percent in other words if it's a hundred Pips ADR I want to see 125 Pips or 130 Pips like that or more and then at 10 o'clock going into 11 o'clock if I see some measure
of weakness or if it fulfills the numbers as we taught last uh lesson before this one you'll learn that there is a measurable and tradable retracement back into the daily range but I don't like to do that type of trade when the range is smaller than the last five days average daily range or if it wasn't really explosive the better trades are when the market has a real big extrapolation one-sided and it moves a lot real quick then in London close you generally get a lot of profit taking on an intraday basis and you can
see some retracement of that total daily range so when we're focusing for Market reversals we're looking for number one a clear indication that it wants to go the opposite direction but let's look at each one of these a little bit more detailed foreign trading previous days highs and lows now again looking at this example here this is pretty much what I was trying to get people to look at when I came on the scenes in baby Pips and I said look you know let's take a look at um the previous day's highs and lows and
see if there's any reversal characteristics there and again it's to get people thinking about how the market moves after running buy stops and sell stops for the most part the neophytes that you know haunt these forums they're always in in confusion they're always trying to figure out what they should be doing and they're chasing things that don't lead to a greater understanding so generic things like time of day highs or lows formed in London the opposite end of the range in the enclosed forms New York is generally a continuation rarely will it become a reversal
in New York but times when it reaches its higher time frame pdra that's when you anticipate that New York session becoming a catalyst for rehearsal well when we look at previous days highs and lows every single trading day you should always refer to how price traded today after the close in relationship to the previous day's range did we work the daily high or the daily low of the previous day or the date prior to it or the day prior to it so what you're doing is you're always referring to the last three days counting today
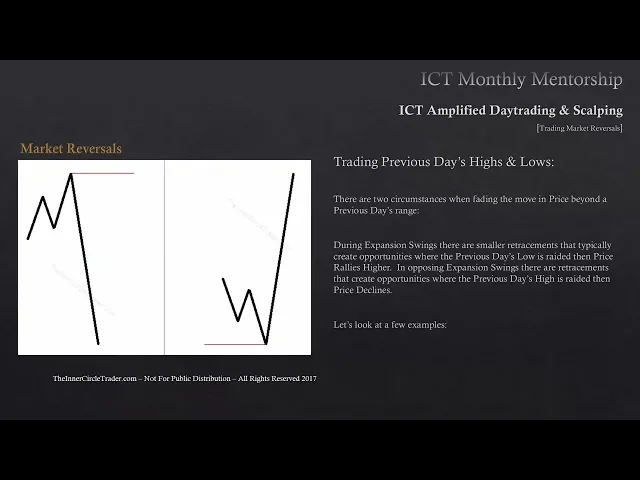
is one day you'll see that there's a lot of influence over that liquidity that's resting above or below those respective days highs and lows now there's two circumstances that when we're looking to fade the price beyond the previous age range there's characteristics there's things that we look for and in my opinion this is the kind of like the crown jewel of this particular teaching during expansion swings there are smaller retracements that typically create opportunities where the previous day's low is rated then price rallies higher in opposing expansion swings there are retracements that create opportunities where
the previous day's high is rated then price declines obviously it's the concept of turtle soup which is a false break above an old high or false break below an old low but it's one step further than that okay so when we're looking at previous days highs and lows when is it that I'm really looking to trade below the previous day's load to be a buyer or above the previous days high as a seller but when I'm looking to trade the previous day's load and I'm anticipating higher prices in this example you can see price was
moving higher as a part of a larger expansion swing and during a normal retracement lower into a fair value Gap price finds buyers under the previous day's low using the previous day's low and anticipating a market reversal after the previous day's low is rated one can be a buyer intraday so take a look at this candle right here this candle is open trades down and closes in the fair value Gap and then rallies up and has a higher close to Candle prior to it and notice it trades down below that candle's low so you could
already be thinking about being a buyer below that candle is low because the fair value Gap exists below and it's throwing a retracement you're in understanding of institutional order flow in a higher time frames are going to assist you here because while markets generally retrace those retracements what you're looking for is a move down below the previous days low and also into a discount array like in this case it's a fair value Gap price trades under the previous days low that's where you're going to find buyers the Market's going to come in with a great
deal of institutional sponsorship and they'll send price higher intraday now we look for confluences of PD arrays to support the idea of buying Under a previous day's low but we don't simply buy under the previous day's low on the sold basis that price moves below the previous day's low there has to be context behind it all now trading previous days highs if I'm bearish on the market and institution overflow is suggested to go lower in the higher time frames I like to look for reasons to see price move up into a short-term premium array and
then having and I can be saying this example here price was moving lower as part of a larger expansion swing during a normal retracement hire after a fair value Gap was filled news the Gap has already been filled but after that Gap has been filled price finds sellers above a previous day's High this candle here trades above its previous candle when price trades above that previous day's High the market finds sellers and you could be a seller that day now obviously again using context not just simply looking at okay but we're above yesterday's high so
I'm going to be a seller it doesn't work like that you have to have the understanding of what institutional order flow is indicating in this case we're looking for institutional order flow on the weekly the daily or four hour suggesting prices are going to go lower if we have that and price trades up into a premium array and it's during a retracement in other words it's been moving lower and now we're having a little bit of retracement bounce up once it goes to a premium array that's what you couple it with then if it trades
above the previous day's candle High you could be a seller right above that high and anticipate an expansion on the downside trading entry week highs now in this example we can see price was trading above equal highs on Thursday of this particular week now price rated the buy stop liquidity pool as a premium array now when we use intra week highs and we are basically anticipating a market reversal after the buy stops are rated when you see this happen in your charts this is when you can step into the marketplace and be a seller intraday
you hear me talk about we've mentioned a lot about it in early teachings of this mentorship and throughout my free tutorials too when we look for equal highs we know that that is like Candyland as we call it it's very easy to see that retail is going to have their buy stops resting just above that and any rate above it 10 or 20 Pips above it we'll scoop up those buy stops and then many times banks will go in and sell right into that and that'll give you your day trade as a short now obviously
like we said with everything else we're not looking just to sell right above an old high or even old equal highs because sometimes old equal highs can be just targets for a longer term price move higher but when the conditions are suggesting that we're in a neutral state or in other words we're consolidating or we're getting ready to turn the tide if we go up to a higher premium array which would be existing just above the equal highs in this case here if we see confluences of PD arrays to support the idea of selling above
an intra-week high then we can step in as a seller at London or New York but also think in terms of what price may be unfolding in terms of overlapping these reversal Concepts see we have a Tuesday high and then Wednesday had a slightly lower high but it's basically equal highs we know there's going to be bias that's above that so on Thursday price rallies above it at that time it could also be seen as a New York reversal so you're blending a couple different things when you see an overlap of these types of reversal
Concepts it makes it even stronger trading intra-week lows now this in this example we see price was trading below the equal lows on Tuesday of this particular week and price rated the sell stock liquidity pool as a discount array now if you look I've shown a load that was from the previous week as the double vertical lines that's a Sunday you have equal lows on the previous Friday and on Monday so those two equal lows are traded down through on Tuesday violating that old low so you have an inch a week load that can be
Blended in with the previous week's range as well especially if the reversal occurs on a Monday or Tuesday as we see in this case here Now using entry week low and anticipating a market reversal after the sell stops are rated you can be a buyer on an intraday basis now again like we just said with the entry week highs we're not just simply looking to be a buyer below an old low or equal lows there has to be a context the move that drops down onto Tuesday below those equal lows that's formed on Monday and
Friday of this example in the chart that's trading down into a higher time frame discount array when you're staring at intraday charts and you don't have any reference point on the higher time frame you're going to miss these beautiful scenarios where you can clearly see where the manipulation is going to take place and where they're going to run the cell stops now obviously like we said with the previous examples we're not just simply you know buying below no low we're looking for confluences from the PD arrays to support the idea of buying below an interweek
low and we simply don't go in buying below and low just simply because the price moves beyond the entry week low trading intermediate term highs and lows all right in this chart here you can see price is trading in a large consolidation and the periods when the market is not trending One Direction they offer ideal conditions you know for shorting above an old high and buying below an old well from a previous week or longer in time so when we look at reference points in terms of classifying as intermediate term it's beyond just yesterday and
it can be as short-term as intra-week or previous month or two months ago old lows and old highs like that they're gold mines because think about who would be having their stop losses below or above those reference points the whales those large fund Traders when they have their orders in those markets they're going to be placed around these higher time frame highs and lows so if the market trades back to them they're gunning those stops now studying old highs and old lows and incorporating The pdra Matrix that's going to assist you in finding higher odds
day trades now the setups tend to pres and then more in terms of a dynamic response in price than that of just simply looking for what would be considered like an optimal trade entry or looking for a simple order block again none of my concepts are Tennessee is be all end all they don't stand alone they have to be blended with other things so when you incorporate these setups with the PD array Matrix and higher time frame institutional order flow you're going to find Dynamic reactions and it's going to be always a bonus for you
as a day trader because we need Movement we need to have displacement we need to see a rapid movement to get paid before the end of the day so we're always battling time and we're always battling the uncertainty of whether or not we're going to get magnitude of our move so While most statistics state that day Traders don't make money consistently over time because they number one they don't look for the conditions that are ripe for day trading this week we had some instances where in our live sessions we were able to call very precise
what the market should be doing and where it should go next there was other instances once my objective for the week was met you saw how I was off on my analysis but I was not going into the marketplace and trading anymore so that skill set comes by experience you're not going to be able to do this just simply by taking these Concepts and saying okay plug and play I'm going to be good it takes it you know a level of experience doing it for a while seeing it and developing a feel for it and
that experience Factor can't be communicated in a teaching it has to be well it has to be earned and you have to do that through time now when the market lacks directional Trend and uh one-sidedness those conditions they offer more opportunities to trade like this than not so when traders that identify range-bound conditions see that in their charts once you do this several times in practice once you see it in examples in the past when you find yourself you on a Saturday morning you wake up before anybody else gets up in the house and sit
down with a bunch of charts like I used to do this for years before I had children I loved it but you know that I don't love my children but I love the fact that I could spend my time doing that and I would be uninterrupted I wouldn't have any distractions and I could literally pour over charts and really build scenarios of why price going up here who would they not them you know why would they knock those individuals out what was the purpose of going up there um because when I first started trading I
thought that buyers just stopped running out of buyers okay and in the market topped and there's a lot of people still teach that premise in the marketplace that's not what it is the absence of the market makers selling it to them at a higher price they don't offer it any higher because believe me if they want to offer at a higher price they can all they do is offer the price and they'll put whoever they want in that that price because a market order is a market order to get in right now and they can
couple that with a ridiculous price level that would be outside the normal range once I understood what price was actually doing and the behind the scenes view of what takes place for runs on liquidity the concept of reversal trading was much more in my opinion my cup of tea I liked it which is the reason why my London open strategy became like my repertoire for Forex because essentially what you're doing is you're looking for reversal patterns every single London session because the Judah swing when we're looking for bearish moves it's going to be rallying higher
what we're doing is trying to time that intraday reversal so these reversal concepts are large in scale with intermediate based ideas as we're describing here but it also is minute to the point where we can reduce it to the lung and open for Judas the CME open for the New York Judas and Asia it has its Judas at eight o'clock and then New York time or CMG zero DMT and then you have it also in London close on days that create lung enclosed reversals as we'll talk about okay New York session reversals when we look
for new recession reversals obviously the first remind yourself is that the weekly templates that I provided in earlier teachings this is going to provide you the basis for studying current market structure and then also learning to anticipate what the New York session is going to do in terms of continuation or reversal now while a reversal can occur on any day of the week we learn that certain weekly templates are more likely to unfold over another knowing the higher time frame PD arrays and the if the data ranges the market is presently respecting scenarios can be
outlined in our analysis if there is a higher time frame discount array that is below the market price but yet has not been met yet the day it trades down into it during London's move and Crosses over into New York open this is the classic New York session reversal condition now obviously you reverse these conditions when you're looking for a opposite Market reversal in a New York session in simple terms when we see price trade down into a discount array on a higher time frame chart and it does it at the time New York opens
that is when the most likely chance of a market reversal occurring in New York session is going to be seen as long as New York has not traded down into a hard timeframe discounted rate or up into a higher time frame premium array New York session will always be slated as a continuation of that was seen in the London session so in simple terms again unless the New York session opens up at a premium array on a hard time frame or discount array on the higher time frame New York will always be expected to be
a continuation of what was seen in London so if it's a high formed in London and we're expecting to be bearish New York's going to be a continuation that changes if London trades down lower and then crosses into New York but New York trades down into a higher time frame discount array anticipate a market reversal going higher reverse is said when the London session creates the low today it's been rallying up crosses over into New York open into a premium array once the New York session trades up into that premium array expect the market reversal
in New York session trade higher into that premium array just to go lower on the day you expect that New York session reversal the characteristics are simple but what many of you are not getting is that you have to see it you have to study it you have to look at it and if I give you one or two examples it's not enough you need to go find it in your charts and see it make notations draw up some um some notes on your charts and look at them repeatedly go over and over and over
and over again but by having the higher time frame PD arrays outlined on your daily transfers over to your lower time frames you won't be blindsided by these reversals when I talk about the likelihood of seeing a market reversal profile in New York session every time I mention it I got 30 to 40 different emails from members in our mentorship and it's always a repeating question how do I know it's going to reverse because I didn't see it trading into a hard time frame PD array if it's trading up to that higher time frame PD
array it's going to most likely reverse there's no mystery here it's a simple concept of knowing what the hard time frame PD arrays are if we're trading into a level that would be bearish and it does it at New York expect the reversal it's simple as that all right let me close reversals now London clothes can be used for intraday reversals on large range days again like I said in the earlier portion of this video for scalps the large range day that exceeds its five-day average daily range tend to retrace about 20 percent of its
total daily range at 10 o'clock in the morning to noon New York time in longer term conditions the London close can time a market reversal that can lead to a series of days of one-sided Direction This is best determined with the use of the weekly templates and study of the current market structure as I indicated in previous slide about the New York session reversals the same thing applies to the London close time period as well so everything that I mentioned in the previous slide about New York just take New York out and then put in
London clothes for all the things I said without having to repeat it all but there are times when you anticipate the New York session causing the reversal and then later on London will go back to that higher time frame PD array and blow out the stops on the New York session as you see here in this example so always be mindful that even if you're expecting the New York reversal London can come back and act like like we see many times in London London open you expect to hide the form it creates a high it
trades down 30 40 Pips aggressively and then it comes back one more time knock those stops out and then it sells off well when we're expecting New York session reversals the London close can be that second swipe for those the individuals that are really on the right side of the marketplace and they're buying the reversals in New York or selling the reversals in New York London clothes can many times go up there one more time or down there below to knock out those stops for those people that were right anticipating the New York session reversal
so if you see that occur step right in there again and buy it below the New York uh low if you're looking for a bullish New York session reversal if it comes down again in London I'll step right back in there again and buy it again and many times you get really wicked low pricing and it quickly moves away the other way and everything's reversed on the on the sell side but as you see in this example the reversal occurred on the Wednesday and at London close this price occurred and the reversal occurred at a
higher time frame discount array and was expected to trade higher as a result London like New York can reverse the market it's not just London open that creates the reversals it can be done on the New York session and the London close so hopefully I've taught you something with reversals here that will obviously build on your understanding um some of you are going to help me scratching your head saying well I need a little bit more refinement and I'm going to tell you that that comes in time it comes with many examples it also comes
with a later months teaching that brings us to how to study these reversals now the best place to go is inside your charts okay the best practices the first scour through your price charts for examples of all of them experience seeing them how they form is crucial there will many times be very similar in a lot of ways but then there's going to be some things are going to differ these subtle nuances are only learned with study on an individual basis in August we'll be going through a specific set of templates that will be used
for top-down approach that will lead you to a reversal mindset these are the eight reversals I look for so you'll know what to be looking for based on that specific criteria so I understand some of you like to have 50 different examples but you don't need to have 50 different examples you just need to know what the concept is go into your charts and see it times a day study what was the market doing pick one pair go back over the last three months and outline where the reversals occurred what was the context what did
they go up for for buy stuff to what they go down for for sale stops by doing this until you go through your charts you're not going to understand that the best teacher you have is your charts and the time you spend over top of them and your personal note-taking the app peoples in this mentorship that enjoy study of price action will build a collection of each reversal concept discussed here seeing how every lesson prior to these Concepts fit together you'll be aided in your analysis again as a reminder we never know for certain what
price will do next but we can anticipate generic price behavior that repeats over and over and over again so until next lesson I wish you good luck and good Trading