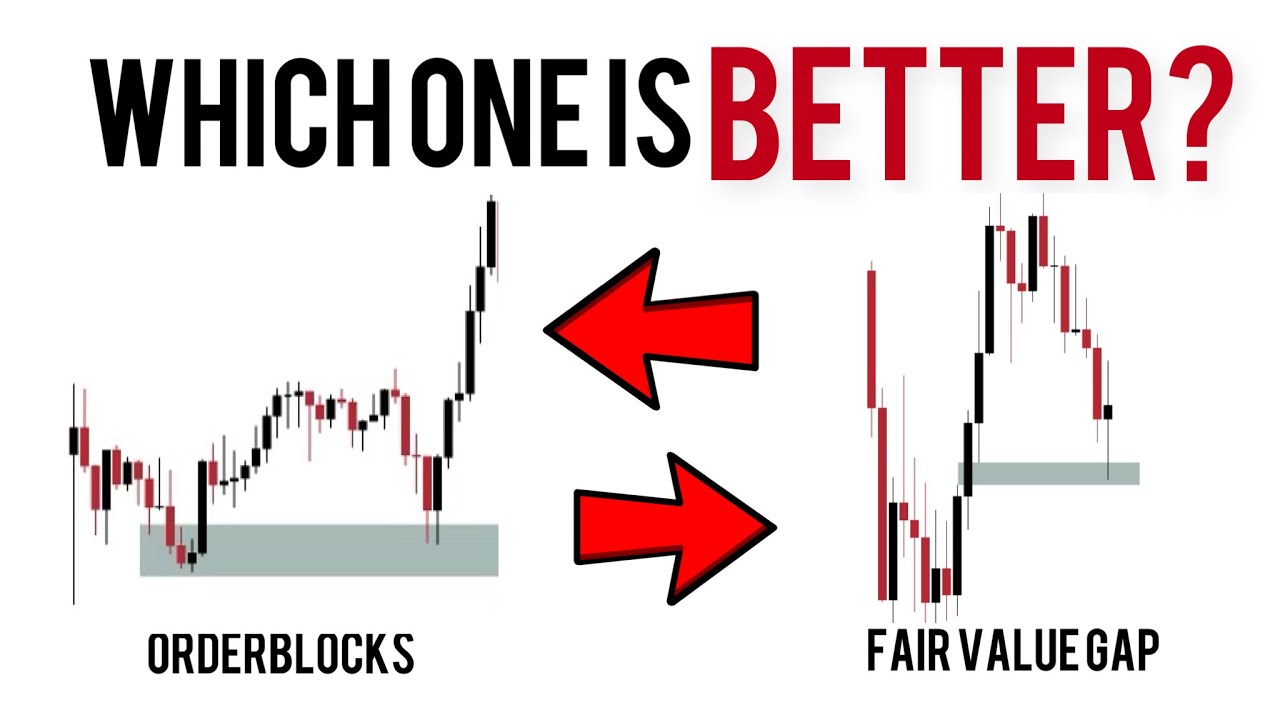
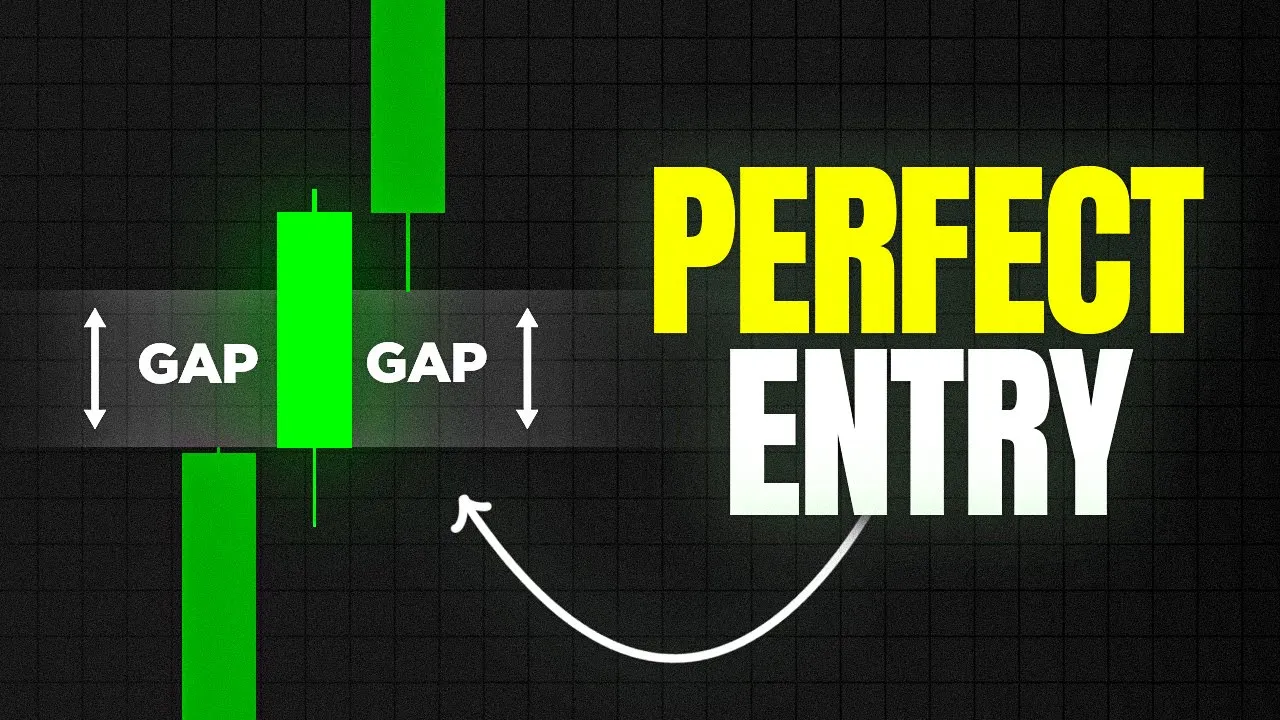
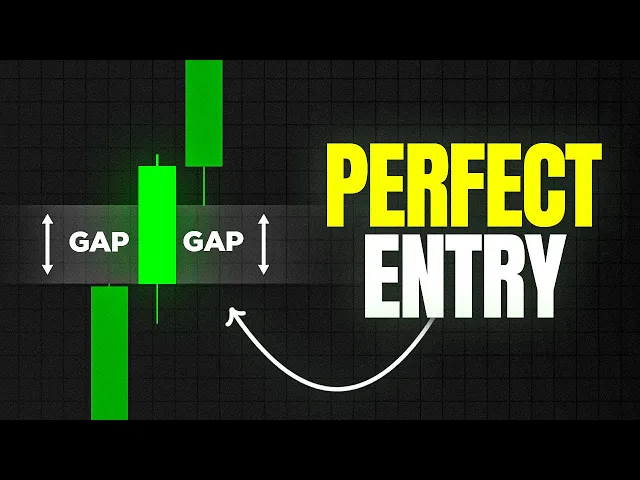
this is a fair value Gap they're a Hot Topic in the trading world with countless videos claiming they're the key to success and exactly what you've been looking for but what exactly are they truthfully how do they work today we're cutting through the hype to give you a clear non-nonsense overview of fbgs and how you can effectively use them in your trading with clear and practical use cases and examples so buckle in and let's get started you've heard them referred to as imbalances or fvgsqsgyxtm not the same in simple terms an imbalance is a blanket
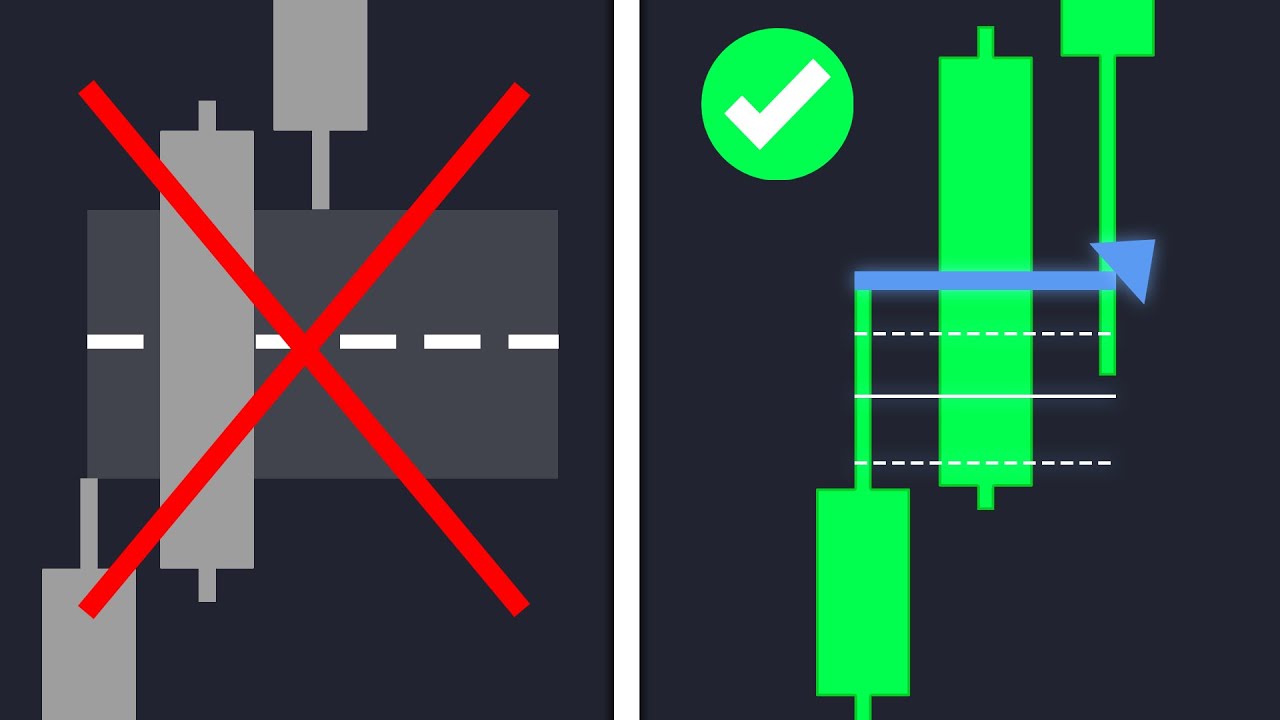
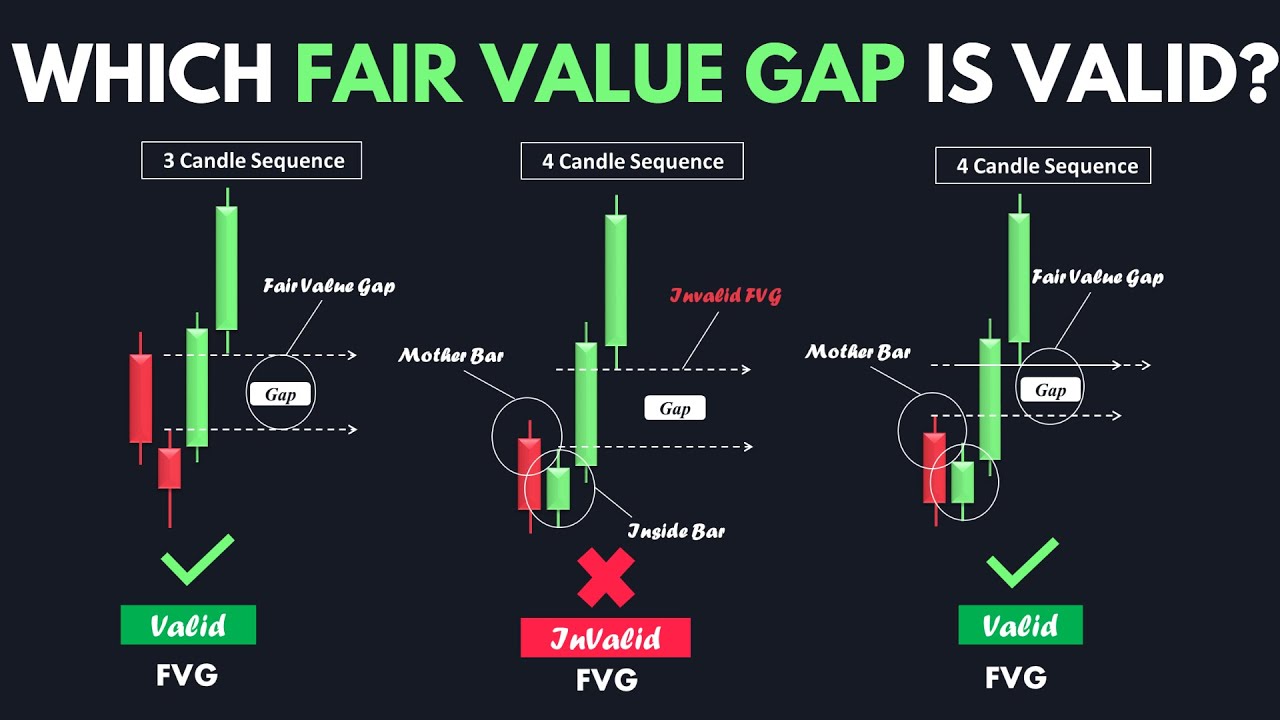
term used to describe a disparity in the value of an asset it means the asset is trading in a way that may not reflect its true or fair value now depending on how the price structure forms fair value Gap is just one of the terms used to identify the imbalance the fvg formation is a three candle formation where the first and third candle does not overlap this leaves a gap within price and that Gap is what is referred to as the fair value Gap if this is formed while candles are going up it's a bullish
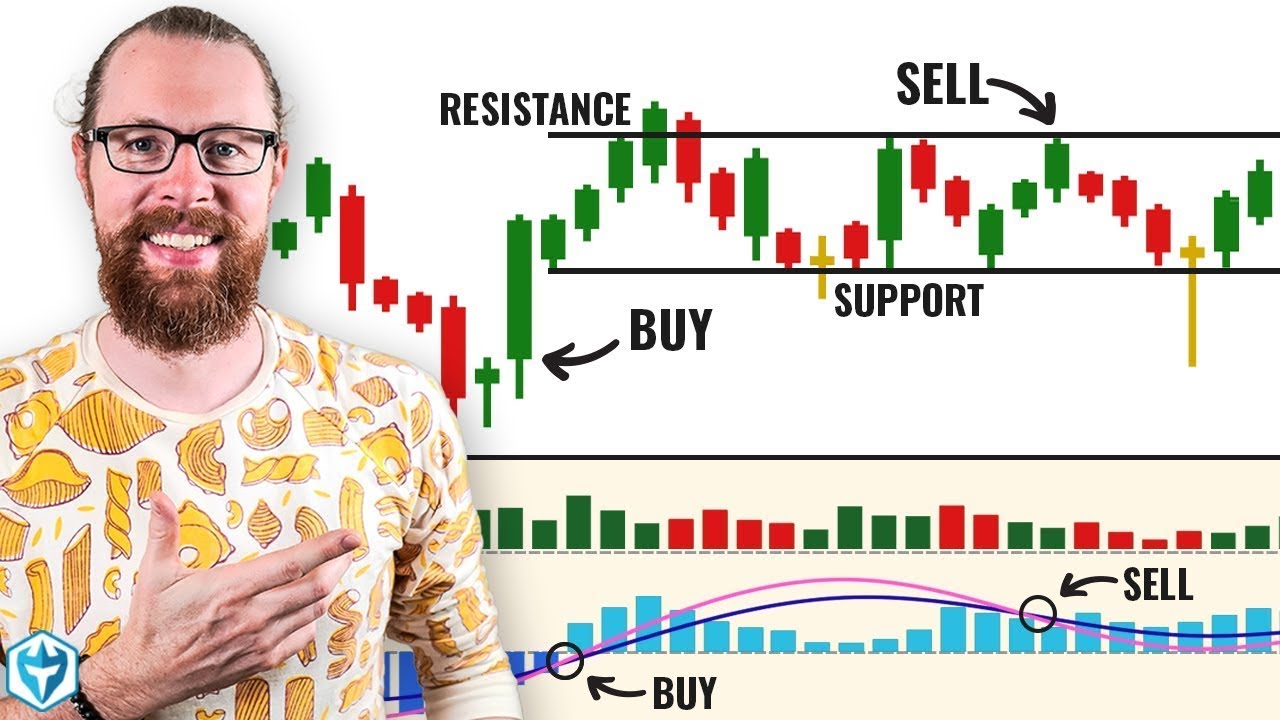
imbalance and if it forms while price is going down it's a bearish imbalance now remember an imbalance means there is a disparity in price and if so it needs to be corrected so when a gap is identified you can think of them as magnets that will pull price towards them but here's the kicker no one talks about how difficult it is to know when price will go towards them or which one's price will respect but there are in fact things you can do to identify higher probability imbalances and we'll talk about that shortly if fair
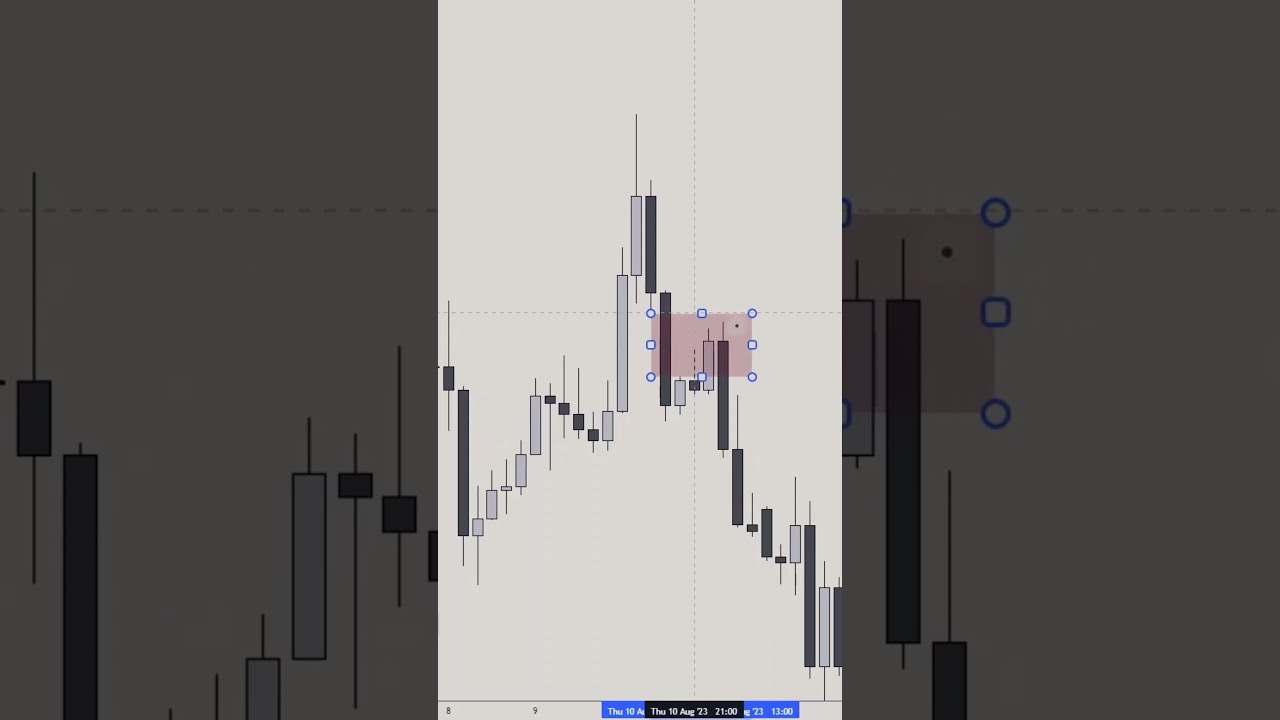
value gaps are just one type of imbalance what are the others well there are also double fbgs inverse fbgs volume imbalances and opening gaps just to name a few Lux algo offers hundreds of completely free indicators and some will automatically identify each of these imbalances on the chart for you check them out at Lux algo.com library but for this video we'll be using the price action Concepts toolkit it has the ability to identify several types of imbalances in a single indicator now let's Dive Right into some examples here we have an fvg detected at the
low of this market price needs to go through or tap into that level now notice price has tried to go down before but seems to consistently reject always within the same exact region this is sometimes a sign that an imbalance might be resting below these levels that needs to be filled just like we have here when the price does get to this imbalance it is important to find Confluence this is a scenario where we could use the signals and overlays indicator with traran signals to see if any are also detected within this fair value Gap
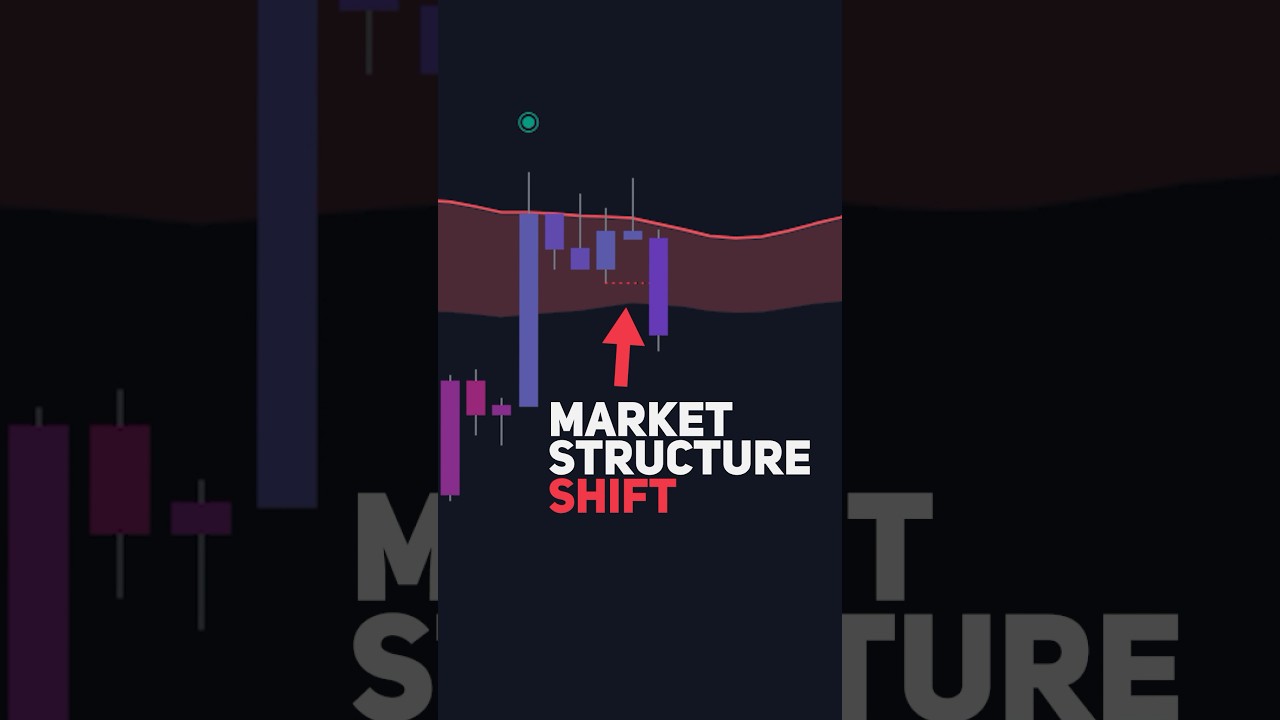
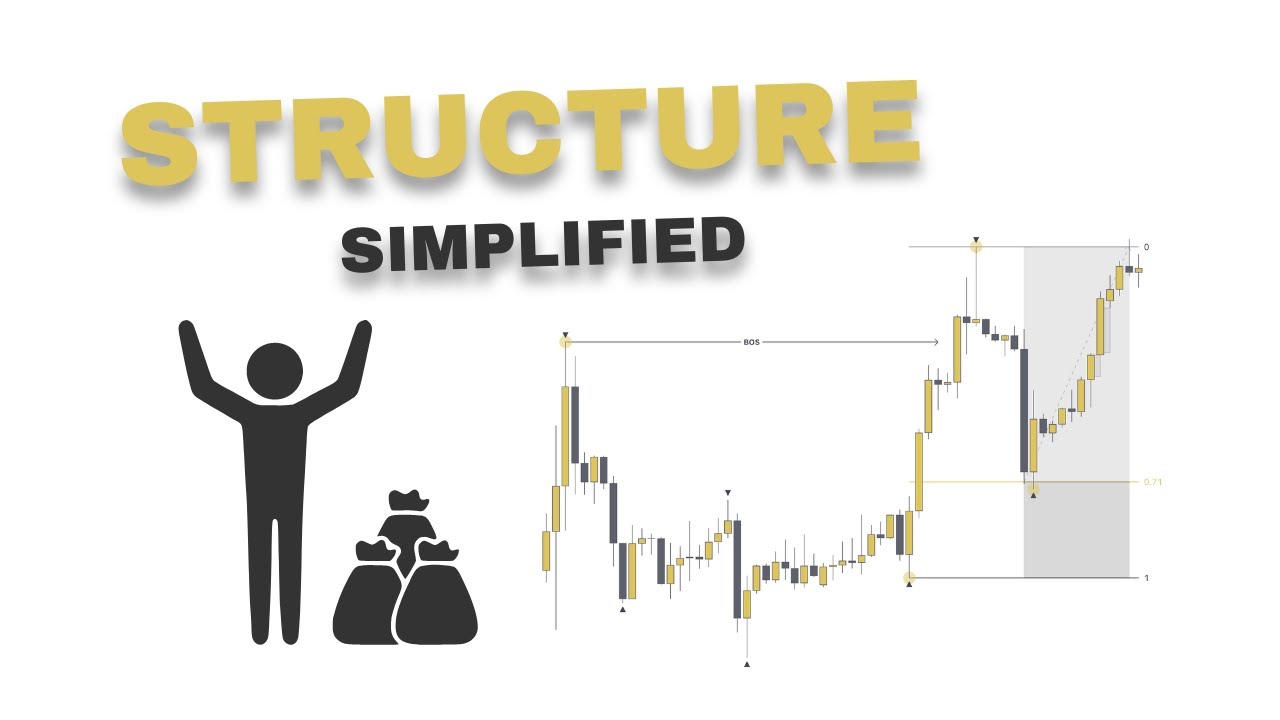
if there is there might be a higher chance of the price reversing if you don't have the signals in overlays toolkit you can also consider using the reversal signals indicator to form Confluence which is available for free within the Lux algo Library another way of using these imbalances is through multi-timeframe analysis if an imbalance is detected on The Daily time frame when the price enters this fvg you can drop to a lower time frame to see the changes in Market structure and know when to enter a position as soon as the market structure starts to
shift bullish and if you're using the price action Concepts toolkit you can simply stay on the lower time frame and set the imbalances time frame to daily to see the fvg on The Daily time frame without changing your chart and once a break of structure is detected you can enter a trade and Target the order block above you can check out the price action Concepts and the signals and overlays toolkits for 30 days risk-free at lual go.com


![How To Trade Futures For Beginners | The Basics of Futures Trading [Class 1]](https://img.youtube.com/vi/TC8b9bL0900/maxresdefault.jpg)