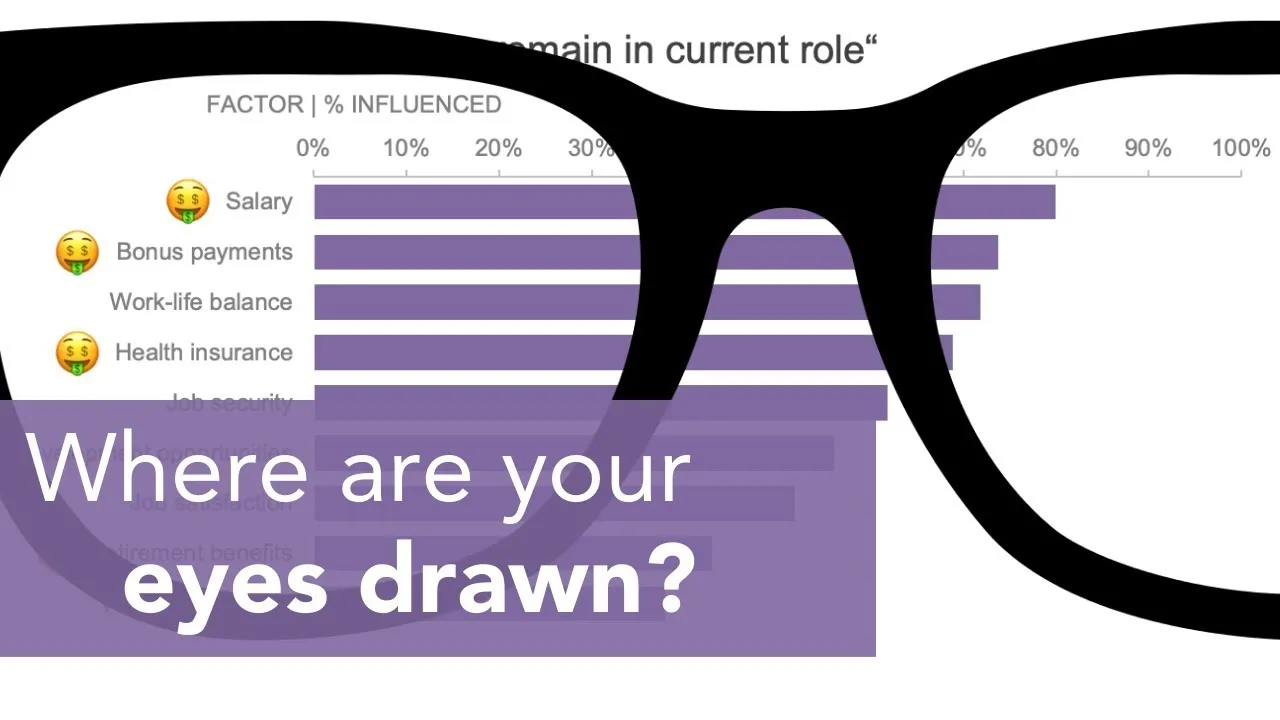
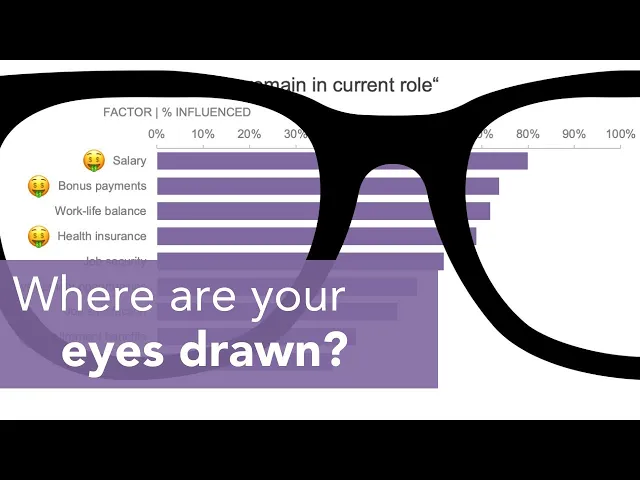
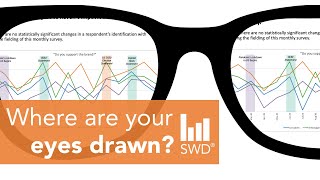
if you've had the opportunity of checking out any of our videos in the where are your eyes drawn series then you'll know the power of just taking a second or two looking away from your chart or graph and then looking back and seeing which elements of your content your eyes are first drawn to the goal of this test is for you to feel confident that your audience's eyes will quickly spot the key messages you've identified in your work let's test this now and I wonder where are your eyes drawn in this view likely most of
us would have spotted those emojis and in that respect they've done a pretty good job of capturing our attention that's the upside the downside however is that while they are no doubt attention grabbing they also feel a little bit unprofessional is it appropriate in a business setting to use imagery like this when discussing a serious Personnel matter in this example we are looking at employee survey results and specifically motivational factors that influence decisions on whether to remain in the current role the original Creator wanted to highlight the factors that were driven by financial compensation and
chose to use emojis to achieve that while we can't deny that the Emojis are attention grabbing we can achieve the same level of audience focus in a less risky way with more common techniques for example we could remove the Emojis and instead replace them with sparing color on the bars representing those important financially driven factors to compensate for losing the legend we'll also add a descriptive takeaway in text to the top of the graph where are your eyes drawn now our audience will instantly understand what the bars represent by reading this takeaway and then connecting
the color text to the colors in the graph perhaps you have an unbreakable attachment to these emojis okay let's bring them back but while doing so look for opportunities to make them more effective now while our eyes took us to the left hand side of the chart this isn't really where we should be looking or at least not where we should be looking if we want to evaluate the responses from this survey in the most efficient way can we incorporate these emojis in a way that retains the same attention grabbing effect but also affords us
instant evaluation of the data well let's find out together first we could narrow the width of the bars to achieve this simply click the bars right click format data series and increase the Gap width to 300% with the bars narrower we can add a marker at the ends of the bars creating a lollipop graph the approach I like to use to do this is to create a scatter plot to represent those markers to do this we can select the data and add a data series name equals emojis the Y values well they're going to represent
the same percentage values we have currently this gives us an extra bar now all we need need to do is change this new bar to a scatter plot once that's done we can go back into select data our X values become the same percentage values we have currently and the Y values are just a simple list of numbers based on the categories we have one to 9 I'll tidy up the Axis to ensure our markers align with our bars and once that's done we can format the markers creating our lollipop chart I increase the size
of the markers to 20 to better match the size of the Emoji now we can move those emojis from their original position near the category labels to the markers of the bars relating to financial factors conducting the where are your eyes drawn test one final time still directs us to the Emojis but this time they are located in a spot that encourages us to scan down the ends of the lollipops and evaluate the results when there is only one thing that is very different from all the rest it's almost impossible not to look at it
whether you decide to use common techniques or more unusual attention grabbing elements being intentional and strategic with your design choices is essential to drawing your audience's attention to the important parts of your data and the communications that contain them do you prefer the Emoji lollipop view or maybe the more traditional bar chart let me know in the comments and also check out our wear I your eyes drawn playlist for more examples of visual transformation until next time thank you very much much for watching and goodbye


![Papi Hans - Ако случайно завали [Official Video]](https://img.youtube.com/vi/AWitsreNh_I/mqdefault.jpg)