So today we're going to talk about something really cool, and I think you'll enjoy it. Let's get started. So, the rules say ignore this, but hello world, how are you?
Hey everyone, welcome to statistics, and welcome to the first section of chapter 1, which is an introduction to the practice of statistics. So, I just kind of an FYI here, chapter 1 is a lot of vocabulary, so you might find it difficult in the fact that you have to learn some new lingo, if you will, but it's not technically difficult other than just sort of the memorizing function. And it is really important that you learn the verbage or the vocabulary because I use it a lot, and if you want to know what I'm talking about and be able to keep up with the conversation, you really have to sort of ingrain it and practice it.
So, we develop a whole chapter devoted to this. So, as you're going through, it's gonna kind of seem simple at first, and that's just because you're learning a lot of new words. When I ask you to recall all of those words, that's when it becomes a little more difficult.
So, just kind of keep that in mind as you go along. Think about how you best learn. If folk, you know, are index cards, flashcards, something like that is a good method for you for memorizing, go that route.
If it's just rewriting notes, but it's just re-watching the lecture, just things to keep in mind as you kind of go through chapter one. Alright, well that is my spiel. So, let's get started with section 1.
1. So, first of all, what are we studying? What is statistics?
Well, statistics is the science of collecting, organizing, summarizing, and analyzing information to draw conclusions or answers to questions. So, it's that whole process. In addition, statistics is about providing a measure of confidence in any conclusions, and so as we get towards the end of the class, we'll talk a lot about margin of error and confidence intervals and things of that nature.
But in the beginning, we just kind of stick to the basics and then move our way to what we call the inferential statistics. So, the information referred to in the definition is data. So, that's what we're collecting.
Data are facts or propositions—I'm gonna try that again—used to draw conclusions or make decisions. Data describe characteristics of an individual's—I'll get my highlighter here—so data is what we're collecting. We're gonna talk a lot about collecting data.
A key aspect of data is that they vary. So, one of the things that when I'm in the classroom is I'll say to the students, "Is everyone in our class the same height? " and of course the answer is, well, no, right.
Everyone's not the same height. Does everyone have the same hair color? And again, the answer is no.
And that's sort of the point: there is variation in our society, in our world, in our universe. And a lot of what we collect and analyze is trying to get this sort of consensus on the group overall, even though we know there's this variation that happens within the group, and sort of trying to identify and get a characteristic and see if we can push that out to the entire group. So, in fact, data vary when measured on ourselves as well.
So, for instance, I could ask you on Saturday night, "How many hours did you sleep? " and then I could ask you on Monday night, "How many hours did you sleep? " and I could ask you on Wednesday night, "How many hours did you sleep?
" and the answer is gonna vary. I mean, even if you sleep about eight hours, if I start to really pin you down on the exact number of hours, it could vary by seconds, minutes, hours, just depending on what's going on that night. So, do you sleep the same number of hours every night?
No. Do you consume the same number of calories every day? Most likely not.
So, one goal of statistics is to describe and understand these sources of variability. And so, we are looking to see well, what is the reason why we're not sleeping enough, or what is the reason why we eat too much? What does everybody have in common?
So, here's a nice graphic—switch pen colors here because I get bored of pen colors really fast—and we're going to talk about what a population is versus a sample. And so, the graphic kind of gives you an idea here. The population is all the possible data.
So, when we think of population, we generally think of, what's the population of a city? What's the population of a town? And what we're seeing is all the people in that city or all the people in that town.
And then we have a sample, which is where we look at just a handful of people, or more than a handful but not everybody, basically is what a sample is. So, an entire group of individuals to be studied is called the population. An individual is a person or object that is a member of the population being studied.
And a sample is a subset of that population. So, here this circle represents that population, and then these little circles inside are a subset or a part of the population, but not everybody. And so, that's a sample.
And so, we'll talk about that a lot. Population versus sample. Is the sample representative of the population?
That's a big question that we end up answering. The next definition we need to look at is what's descriptive statistics and a statistic itself, and then what's inferential statistics and a parameter. So, you'll see those highlighted and underlined.
So, descriptive statistics consists of organizing and summarizing data. So, this descriptive statistics is just very objectively describing the results of what you collected: twenty percent of people said yes, thirty percent of people said no. We don't make any subjective calls; we don't say this is good or bad; we just very much just lay it out objectively.
Descriptive statistics describe data through numerical summaries, tables, and graphs. The definition of a statistic is a numerical summary based on a sample. Now, we're going to go to what I have previously mentioned, which is what is inferential statistics.
Well, actually, inferential statistics is what you're getting fed almost every day. It's the methods that take the results from a sample and extends them out to a population and measure the reliability of the results. So, when we see statistics given to us on the news or on Facebook—make sure you look at the source—or any other place we're getting the inferential statistics, basically somebody went out and did a sample and they collected all that data and then they push it out to the population.
So, when we look at political statistics: what's the chance that somebody's going to get elected or vote YES or support this? They didn't sample everybody—that would be the population—that's almost impossible to do. They went and grabbed a sample, they decided that their sample had a margin of error, whatever that is, and then they push out the statistics to us.
That's inferential statistics. Descriptive statistics is just the values of the data they collected. All right, so to go along with this population idea, we have inferential statistics, but we also have a parameter.
So, a parameter is a numerical summary of a population. Now, we don't get those very often because like I said, it's really hard to collect information on the whole population. So, a lot of times we just go after a sample.
But if by chance we do have the information on the population, that would be called a parameter rather than a statistic. Okay, so homework on this is going to look like the following. Example number one: identify whether the data represents a statistic or parameter.
Remember, statistic deals with samples; parameter deals with the population. So, number one: suppose the percentage of all students on your campus who have a job is eighty-four point nine percent. What would you say is that a statistic or a parameter?
Well, since they tell us all students, they're making that the population. We have the information for all the students on campus. This would be a parameter only because the population values are given.
Now, let's contrast that to number two: suppose a sample of 250 students is obtained. Obtained from this sample, we find that eighty-six point four percent have a job. So, now this, because they've sampled only 250 of all the students, this would be a statistic.
And this is what we usually are given. So, this is a statistic because we were given a sample summary. All right, so different.
Now, one thing I want you to notice here is they were measuring the same thing: how many students have a job. When they surveyed every single student, however they got that information—maybe it's not a very big school—who knows. They got a job rate of eighty-four point nine percent—unemployment rate of nine eighty-four point nine percent.
Now, when we went to the sample of 250 students, they got a rate of eighty-six point four percent. Eighty-six point four doesn't match up with eighty-four point nine, so there's a margin of error. And that's something that's very important when you sample.
It's very hard to hit the population value exactly, but it's a lot more reasonable to sample. So, we know there's a margin of error and we accept that margin of error because otherwise we would just be taking steps at the dark, just trying to guess. So, sampling is our best technique, and then we'll talk about good sampling and all of that fun stuff in a bit.
All right, so let's go to the next page. I move down here a little bit. So, a little bit more verbage on the data that we collect.
When we collect data, we call the questions we're asking we're measuring variables. So, do you like the color red or blue? That would be a variable and the answers will either be red or blue.
And so, variables are the characteristics of the individuals within the population. So, whatever you're asking them, and I know that's a very technical definition, but it's just whatever you're measuring with your questions, whether they're survey questions, however you go out and get that information. Now, when you measure information, that information can either be qualitative or quantitative, and you'll hear these two words quite a bit because we deal with qualitative data very differently than we deal with quantitative data.
So, what is qualitative data? Well, qualitative or categorical data—our variables allow for classification of individuals based on some attribute or characteristic. Basically, these are questions you ask that don't have numeric answers.
So, that takes me to quantitative, and then we'll kind of talk about them all together. So, what is a quantitative variable? A quantitative variable provides numerical measures of individuals.
So, again, it's the very technical definition. Arithmatic operations such as addition and subtraction can be performed on the values of the quantitative variable and provide meaningful results. So, qualitative—so what would be some examples of qualitative variables?
If I asked you your gender, I can't do math with gender. If I ask you your nationality, if I ask you your phone number—I'm putting in phone number because it's numerical—but does math make any sense with phone numbers? No, you can't get—you can't add up all the phone numbers and get an average phone number, right?
So, that's a good sort of self-check. So, qualitative variables are non-numerical variables, non-numerical questions, or numbers that don't make any sense mathematically. So, all the rest is quantitative.
So, a quantitative variable could be: I could say, "How many siblings do you have? " I could ask you your weight, your height, your age, so on so forth, and it would make sense to get an average weight of the group, to get an average height of the group, to get an average age of the group, to get the average number of siblings of a group. So, again, that's a quick self-check.
So, qualitative remember is not numerical. One of the ways that I remember quantitative is numerical is it has the N in it, where qualitative does not have an N. So, quantitative think number, numerical.
Okay, so let's do a couple of examples here. So, classify each of the variables considered in this study as qualitative or quantitative. So, researcher Elizabeth Kovac and other study factors that effect the eating habits of adults in their mid-30s, and they asked information about these particular questions or these particular variables, and so we want to know are these variables qualitative or quantitative.
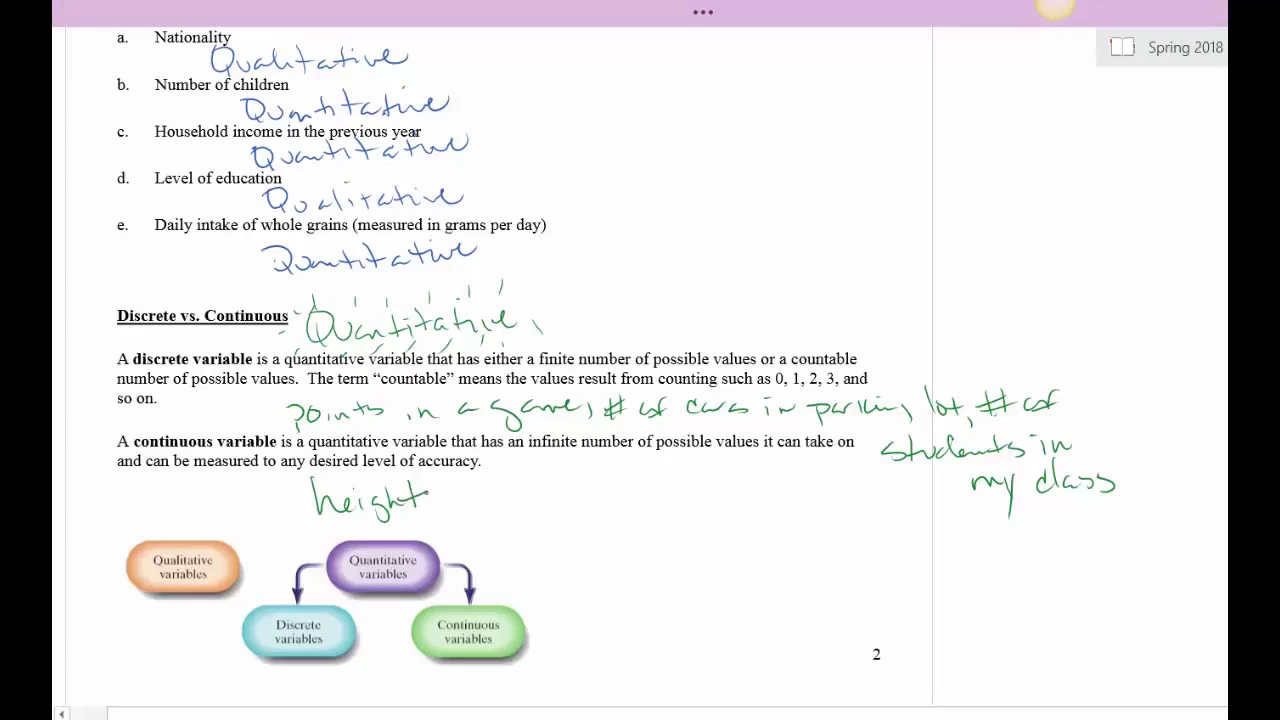
So, a nationality—qualitative or quantitative? Well, we said above that nationality would be qualitative. So, if I say, oh my heritage is German, or my heritage is Mexican, or my heritage is Laotian, or you know whatever it could be, I can't do math with that, so that would be qualitative.
She also asked the number of children, and so in that case that would be quantitative. I can do math with that. Household income—again quantitative.
Level of education—so this one they didn't give us much information here, but different—usually when we say level of education and we're taking in data, usually the categories are something to the effect of some high school, graduated high school, some college, graduated college, graduate school, postgraduate school, degrees, something like that. So, that's qualitative. Now, if they happen to ask what year you went through—usually which doesn't make sense for college levels because we don't usually say, hey I'm in 16th grade—but if we were maybe doing those lower grades, then maybe something like that we could consider quantitative, but generally in this situation it would be qualitative because it's it's just a you know, like I said, some college, some high school, high school graduate.
I can't do math with that. And then a daily intake of whole grains measured in grams per day. That's pretty easy.
That one's gonna be quantitative. Okay, and just to kind of let you know, since this is our first video together, if I'm ever going too fast, remember, pause it. Another thing that if you want to do that's really helpful and sometimes I'll tell you to do it is if you know that I'm gonna get into a list of examples, pause the video, work the examples yourself, and then see if we match up, and that will kind of let you know that if this is working for you and if you're understanding the concept, or if you maybe need to go back, re-watch those definitions again, and then see why I'm coming up with my answers that may be different than your answers.
All right, so we've got statistics, we've got a parameter—remember statistics deals with samples, parameter deals with population. We've now got quantitative and qualitative variables, meaning what kind of data are we collecting? Is it numerical or not?
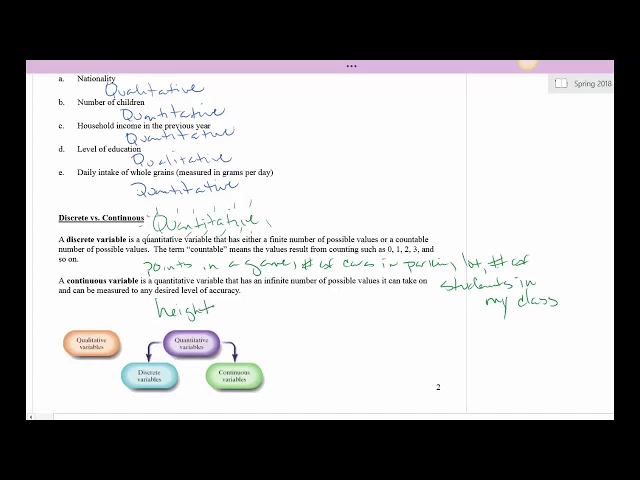
Now, we're going to talk about discrete and continuous variables. Now, in this case, discrete and continuous variables only deal with—switch colors here—only deal with quantitative. Quantitative—why can I not spell quantitative variables?
Because we're talking about whether they're countable or not. So, we do have to be dealing with numbers in order to decide if a variable is discrete or continuous. So, a discrete variable is a quantitative variable that has either a finite number of possible values or a countable number of possible values.
The term countable means the values result from counting, such as 0, 1, 2, 3, and so on. So, discrete means there's no in between numbers. You're just going one, two, three, like counting the number of points in a game.
We usually don't do partial points. A number of cars in a parking lot, number of students in my class. There's not partial students—that would be gross.
All right, so those would all be discrete. I can count, and the counting ends at some point. It's not infinite.
A continuous variable is also a quantitative variable—so we talked about that, we have to be quantitative, remember quantitative—that has an infinite number of possible values it can take on and can be measured to any desired level of accuracy. So, you're thinking, wow, how can you have an infinite number of possible values? Well, you just decide how much you want around two.
So, continuous variables are variables that are measured. So, for instance, height. Now, we've usually answer height in feet and inches, but do you think everybody whose five foot four is exactly five foot four?
What if you went down to a tenth of an inch or a hundredth of an inch or a thousandth of an inch? Juice kind of see where I'm going here? Ten thousandth of an inch.
So, we do things to make our lives simple, but really if we wanted to measure to a more significant exact value we could, and the answers would be different, and so that's sort of what a continuous variable is. It's something where you're rounding—we're basically rounding right? We're rounding to the nearest inch for height.
Weight is the same thing: you can weigh to the nearest pound, to the nearest tenth of a pound, to the nearest hundredth of a pound, thousandth of a pound. You decide or society decides to what level of measurement we want to go and what unit of measurement. What's a couple others?
Time, temperature, speed. Right, if you've ever watched the Olympics, they don't just measure to the nearest second when somebody's running, right? And they have a race or swimming, they go down to the usually the thousandth of a second, and sometimes even then there's ties, but that's by choice, and they could go to the ten thousandth or the hundred thousandth, but we are always rounding those numbers.
So, whenever you're measuring something, you know that's a continuous variable, you know there's in between numbers—that's a continuous variable. So, countable number of cars in a parking lot—you can't go wrong. Continuous—how much do you weigh?
Well, depends what unit of measurement you want to go to. Okay. And so, you see this nice little flow chart here: you have qualitative which just kind of stand on their own—don't worry, I'll get some categories below them in a minute—but quantitative now we can break into two parts.
So, we can either be discrete or continuous because these are numerical. All right, so let's move down now. If you want, you could try and answer these four questions for examples on your own before I do.
So, if you want to pause, go ahead and do it now. Otherwise, I'm gonna go for it. So, 6a example: 6a classify each of the following quantitative variables considered in the study as discrete or continuous.
So, 6a: goals scored in a season by a soccer player. So, are there any partials? Is there any rounding?
No, that's countable. You can count the number of goals somebody scores. So, this would be discrete.
Good: b) volume of water lost each day through a leaky faucet. You're measuring, so this would be continuous. c) length in minutes of a country song.
Again continuous. Now, we usually measure songs in minutes and seconds, but if we wanted to get into decimals, a song could be 3. 0 3 minutes 3.
0 four minutes 3. 0 three minutes, so again we have to decide. Even if we say just minutes, that doesn't mean nearest whole minute.
So, even in minutes, even if I limit to just minutes, I still have infinitely many possibilities depending on how far down the line I want to go as far as how many decimal places I want to measure. Alright, and then the last one: d) number of sequoia trees in a randomly selected acre of the Sierra Nevada National Park. And of course, we could count the number of trees and that would actually be really fun to do.
So, this would be discrete. Alright, so we have our variables, we have either qualitative or quantitative. We now know discrete and continuous, and the last piece of vocabulary I'm going to throw at you is what we called levels of measurement.
So, we have four levels of measurement, and this could either be for qualitative or quantitative data, either one. The first two will be for qualitative and the second two will be for quantitative. So, we have nominal, ordinal, interval, and ratio, just in case you were wondering.
So, what is nominal level of measurement? Well, nominal is the type of data we collect that's basically just a name or a label. So, nominal level of measurement: right here, if the values of the variable name label are categorized.
In addition, the naming scheme does not allow for the values of the variable to be arranged in a ranked or a specific order. So, an example would be: what your favorite sports team? You're just gonna get names out, right?
So, should I put a call in there? You see the Giants, the A's, and then somebody always says the Dodgers—I don't know why, but it happens in every class. Yeah, I'm talking to you out there.
All right, so you can't order them. You can't put one before the other, although I could definitely put one last all the time, but that wouldn't be the typical way of doing things. So, gender would be nominal: you know, male or female.
One doesn't go before the other. So, it's just when you're asking questions and the answers you're getting back in our categorical or qualitative and there's no real order to them. So, let's contrast that with ordinal.
So, let's talk about ordinal. Ordinal level of measurement is ordered names. So, let me read the definition and then we'll kind of talk about this.
Ordinal level of measurement: if it has the properties of the nominal level of measurement and the naming scheme allows for the values of the variable to be arranged in a ranked or specific order. So, ordered names would be something like: freshman, sophomore, junior, senior. It's a well-recognized order of these names, and so for that reason, we would call this an ordinal level of measurement.
Another ordinal level could be: 1st, 2nd, 3rd, 4th. It's not quantitative because I can't do math with it, but there is an order—a natural order—to those labels. Alright, then so these guys—I'll put this here—these are your qualitative levels of measurement.
And then we're going to do two levels that are quantitative. All right, so we have interval and ratio. So, interval level of measurement is if it has properties of the ordinal level—meaning you can put it in order—well, of course it's numerical, so no problem—and the difference in the values of the variable have meaning.
A value of zero in the interval of measurement does not mean the absence of the quantity; it just could be the starting place. We'll talk about that. And arithmetic operations—such as addition and subtraction—can be performed on values of the variable.
So, the interval level of measurement are numbers where—so remember, because it's quantitative—numbers where zero is not the beginning point but the math makes sense. So, an example would be—I'll switch colors here—you can see temperature. So, for instance, zero is not the beginning of our temperature scale, right?
There may be places and the United States—depending on when you're taking this class—that could have a temperature that's below zero. Definitely somewhere in the world, though, you know there's somewhere in the world now. That also depends on the scale that you're using.
So, we typically either use Fahrenheit—in the United States is pretty typical—Celsius almost everywhere else in the world. But there is a there is a temperature scale that does start at zero. Does anybody know what that is?
It's Kelvin. So, if we were going by Kelvin units, which typically only scientists and labs do, then that would have zero as a natural starting point, and that would be a ratio level of measurement, which we're going to get to next. But our temperature—that our scale that we use—is interval.
Another one is year of birth. So, if you were born in 1983 or 1993—probably some of you—or 1999, 0 is not the natural starting place of our of our years. 0 is just we have a b c and we have a d, so we're just in the ad level.
If you go before 0, it doesn't mean there's nothing there—those are just our BC years and they count in the opposite direction. So, for us, the way that we measure time in years would be considered interval level of measurement. Okay, so now I'm sure you're dying to know, so what's ratio?
Well, ratio is everything in the interval level except that zero is the natural starting place. That anything before zero doesn't really make it since. So, for temperature and time, it made sense to have something before zero.
Ratio level of measurement is nothing before zero makes sense. So, I'll write that down: numbers where zero is the beginning point and math makes sense still. So, that hasn't changed.
Okay, so for instance, you could say, oh the energy used this month in your house. Right, anything less than zero doesn't make sense. If you were to say the value of a car, value of a house, something like that.
So, even though we can try and give meaning to what a negative value of a car is, typically we don't use negative values of cars. So, zero is sort of that natural starting point of whatever that variable is that you're measuring. Versus interval level: zero is not the natural starting point—it's just one of the many numbers that can be taken on in that in that question.
Okay, so let's look at the homework questions. So, determine the level of measurement for each variable. So, remember you're going to answer one of four answers.
You're gonna have nominal—and I'll write them down here—nominal, which is names; ordinal, which is ordered names; interval, which is numbers where zero is not the starting point; and ratio, which is numbers where zero is the natural starting point. All right, so nation of origin—well, we know that that's just a name and you can't order that. So, this would be considered nominal.
b) movie ratings of one star through five stars—well, mmm, don't be tricked. It may seem numerical but you're not doing math with this. You can't add up two movies and get a six star rating that kind of thing.
So, but we could order that. So, this would be ordinal. c) volume of water used by a household any day.
So, this is numerical. Is zero the natural starting point? Yes, it is, because this is in a day.
And so, in this case, we would say this is ratio. d) year of birth of college students. Well, we talked about year of birth and how zero is just the difference between 80 years and BC years.
So, zero is not the natural starting point of our years. So, we say this is interval. e) highest degree conferred: High School, Bachelors, and so on.
So, we see that those are names. Do they have a natural order to them? And most people would say yes, they'd write high school first, bachelor's, master's, PhD, so on so forth.
So, we would say this is ordinal or ordered names. f) color—definitely just names, you can't really order our eye color. So, in this case we would just stick with nominal.
g) assessed value of a house—can you have anything less than zero? The answer is no. I'm not talking about what you might wanna know if it's worth nothing, it's worth nothing.
All right, and then this is one that stumps a lot of people and we usually get into a big debate on this in class because it's tricky: h) time-of-day measured in military time. So, if I said time of day measured in regular time—is zero the natural starting point? Well, it is for that day.
But does that mean that there was nothing before it or it doesn't make sense? Well, no, anything before zero on one day just means what it was the day before yesterday. So, in this case, there is really a very natural explanation to what's before zero.
And so, you see this kind of circular time issue. And so, time of day measured in military time doesn't really change that argument. It just means the day before happened, and even though we don't call it negative, there is still something before zero.
We just changed the date is all that happens. So, time of day measured in military time—time in general—is considered interval. I know.
And all right. Okay, so last page I just want to talk about the process of Statistics and sort of put this all together for you. So, what do we do as statisticians, and what does that process look like?
It's actually a lot of work and it's misused a lot unfortunately, and we're going to talk a lot about that in this class. But but there is a process, it's a very important process, and it's a very clearly defined process actually. It just kind of matters what people are in it for, and that can be somewhat unfortunate sometimes, but generally if you dig deep enough you can get some really good information.
You just have to be a good consumer of that information and make sure you can weed out the good from the bad. So, what is that process? Well, first thing you have to do is identify the question you want answered, and we call that the research objective.
So, a researcher must determine the question or questions that he or she wants answer. The questions must be detailed so that it identifies the population that is to be studied and the questions that are to be answered. Once you do that, you go out with step two and collect the data.
So, collect the data needed to answer the questions posed in one. Gaining access to an entire population is often difficult and expensive when conducting research. We typically look at a exam—I mean, a sample.
The collection of data step is vital to the statistical process because if the data are not collected correctly, the conclusion drawn conclusions drawn are meaningless. Do not overlook the importance of appropriate data collection processes, and we will discuss this step in detail in the next section and beyond. Okay, so you've identified what you wanted answered, you go out, you collect the data.
Step three: you describe the data. So, obtaining descriptive statistics—remember this is no fluff, just what happened when you collected your data—allows the researcher to obtain an overview of the data and can provide insight as to the type of statistical methods the researcher should use. We discussed this step in detail in chapters 2 through 4.
And then the last step is perform inference. Remember, inference is when we take the information we got from the sample and we push it out to the population. So, apply the appropriate techniques to extend the results obtained from the sample to the population and report a level of reliability—so that's your margin of error.
We discussed these techniques for measuring reliability in chapters 5 through 8, and then inferential techniques in chapters 9 through 15. So, we go through chapter 13 in this book. So, we do quite a bit of work in this class, and we get a lot of good information.
And that's really my my goal for you is that you walk out with a real appreciation of how much work goes into this and what good statistics looks like and what terrible statistical work looks like. Alright, so last question: number 6. Gallup News Service conducted a survey of 1026 American adults aged 18 years or older August 31st through September 2nd, 2009.
The respondents were asked: "Of every tax dollar that goes to the federal government in Washington DC, how many cents of each dollar would you say are wasted? " Of the 1026 individuals surveyed, 35% indicated that 51 cents or more is wasted. Gallup reported that 35 percent of all adult Americans 18 years or older believe the federal government wastes at least 51 cents of each dollars spent with a margin of error of 4 percent and a 95% level of confidence.
So, we see these numbers a lot. These this last line is what we'll study starting with chapter 8, but for chapter 1, we're just going to answer these five questions. What is the research objective?
What did they go out to learn? And so, they obviously wanted to know in particular the number of Americans. So, they wanted to determine the number of American adults who believe that the federal government—and notice how detailed we're being because it's not the state government, it's not the local government—that the federal government wastes 51 cents or more of every dollar.
So, notice they were very specific. Now, 51 cents is a particularly popular number because that is a majority, if you think about it, right? 50 is half, but 51 cents would be a majority of the dollar—you went over the 50% mark.
So, that's sort of a tactics for headlines. B) What is the population? Okay, so who does this sample represent?
Right, because we only sampled what we—I wasn't a part of this poll—1,026 individuals were sampled. So, who did they represent? Well, American adults aged 18 years or older is all the information we have about this sample.
So, that's who this this that's the population that this sample should represent. So, all adults Americans. And remember, since I said adult but 18 or older is the definition right, because we're not talking about people from a different country, we're not talking we're talking about Americans.
That's because that's who they limit their sample to. So, what is that particular sample? Well, in this case, the sample would be the 1026 adult Americans surveyed.
What are the descriptive statistics? So, remember the descriptive statistics, it's like if you were a machine just spitting out a computer spitting out the results, what would they give you back for this survey? Well, for us, if we read through this, Gallup reported what of the thousand 26 individuals surveyed, 35 percent indicated that 51% or more is wasted because that's the question they asked them.
So, you're just giving the results of the question when you answer that with the descriptive statistics. It's all—switch colors here—so of the thousand one thousand twenty six surveyed, 35 percent indicated 51 cents or more was wasted. So, you're just reporting back in what came with with the data collection.
Now, what could be inferred from this survey? So, you've got 35 percent, which is not a majority of Americans, right? But you've got 35 percent that think 51 cents or more was wasted.
So, 35 percent is about a third of adult Americans. So, do you think you could get away with this? You could say that many Americans—and I should add adult right, because we're not talking about kiddos—believe that the federal government wastes much of the money collected in taxes.
So, do you think that's the only way to write that? So, the point of this is what they wrote is not a lie—many is true, right, because there's really no limits on the word many. They couldn't use the word majority because 35% is definitely not the majority, but many.
So, that's kind of a you know, interesting word choice: "Many Americans believe that the federal government wastes much of the money collected in taxes. " And they could even say majority there. And so, this gets into a good discussion about headlines and inference and when you're fed this kind of information as a headline.
If it agrees with your sort of innate bias and you think the federal government just wastes all this money, then you kind of shake your head and say, yeah, that's exactly what I thought. That's it, yeah, that sounds right. If you don't agree with this, then you may dig deeper, or you may just assume you know it's not true all together for whatever reason.
But what I really encourage you to do is click on the article and read the article and see the 35% and then make a decision for yourself. Is 35—cent—thirty-five percent of the population is that really many? Because that means that you know 65 percent didn't answer that way, and you can kind of start to make your own conclusions.
And that's one of the things that in society that we really struggle with right now is letting headlines drive our opinions and not digging into data. Okay, well that is it for section 1. 1, and I will move on to section 1.
2. I hope you enjoyed that first lecture. There's many more to come.
To be continued.