hey guys and welcome to another episode of smart risk analyzing the market structure is important for both new and professional Traders since it can reveal current Trend potential reversal points and overall market conditions in this video we will teach you how to read the chart like a professional Trader we will explain the basic and advanced ICT Concepts about how to read Market structure and find its direction so if that's something you're interested in please smash the like button to show your support and subscribe if you're new see you after the intro [Music] [Music] before we
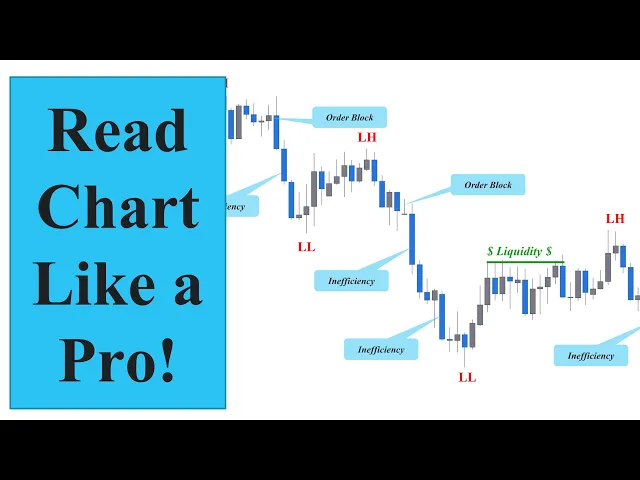
start what is the market structure when we talk about the market structure we talk about the swing highs and lows price movements and the areas that the market has shown a reaction earlier we consider all these items part of the market structure and these are the skeletons of the movement let me show you some basic concepts about ICT Market structure as you know in an ideal uptrend the market continuously makes higher highs and higher lows every time Market breaks a higher high to the upside we call that a break of structure and it shows that
the market wants to continue in the same bullish Direction on the other hand if the market breaks a higher low to the downside we call that a change of character and it signals a possible Trend change so here is a key point a break of structure is valid even if the market Wicks above the higher high and the demand Zone it created makes a valid trading opportunity but for the change of character it takes a break and close below the higher low to confirm it otherwise we consider this Market still as bullish but the market
barely moves this clearly so here is the question which of these breaks are valid and considered a change of character to answer this question first we must identify our swing lows in the bullish scenario the lowest point between two consecutive highs is identified as a swing low here we have two consecutive highs so the lowest point between these two is our swing low as long as the price stays Above This level it represents a bullish market and we will only look for buying opportunities and for a valid change of character we need to have a
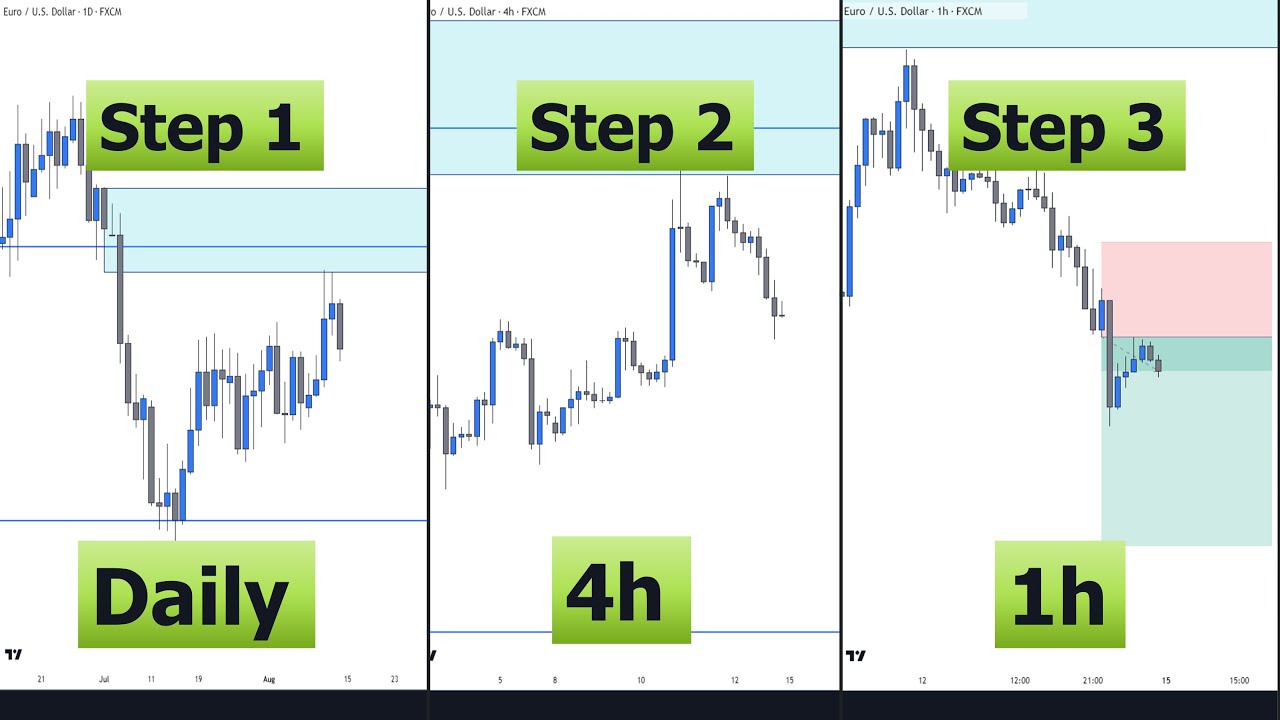
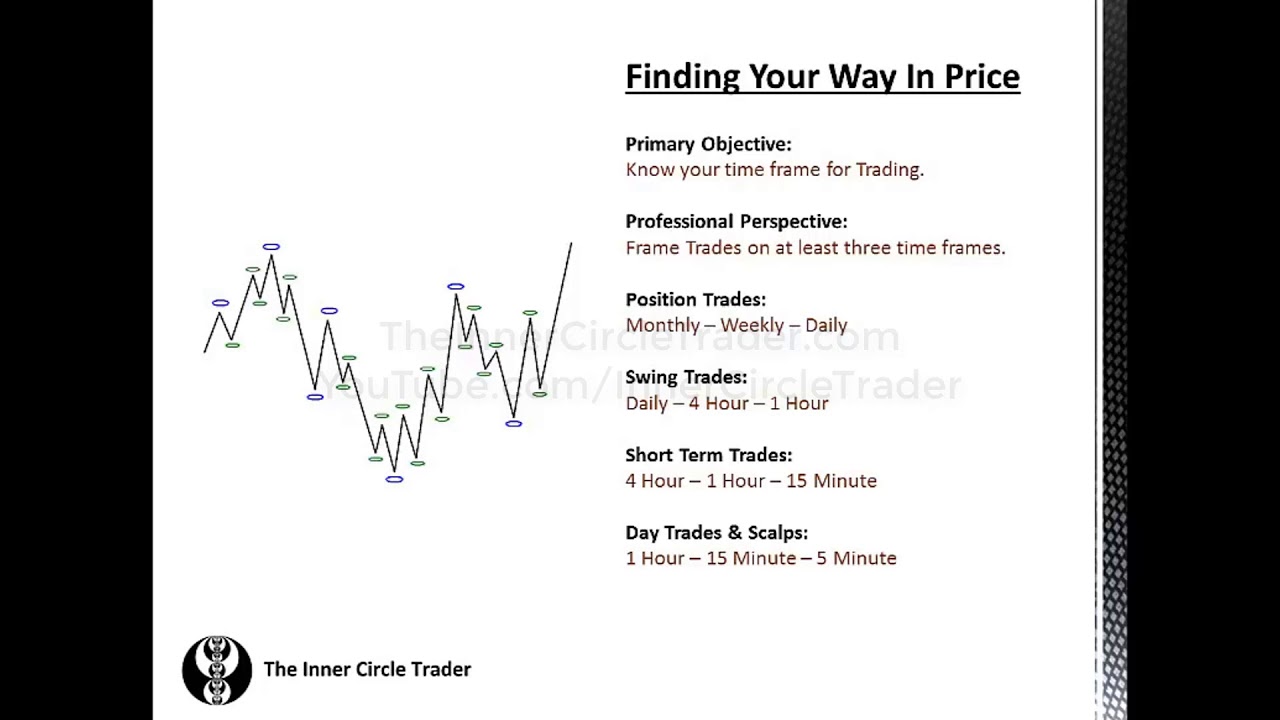
candle that breaks and closes below here we have another break of structure by this move so the lowest point between two consecutive highs is identified as the swing low once again another two consecutive highs and a swing low we have keep in mind that the same concept applies to the bearish scenario now here comes another question when can we confidently say that a change of character will reverse the trend to answer this question you need to understand the fractal nature of the market imagine we have an obvious uptrend in the four hours time frame with
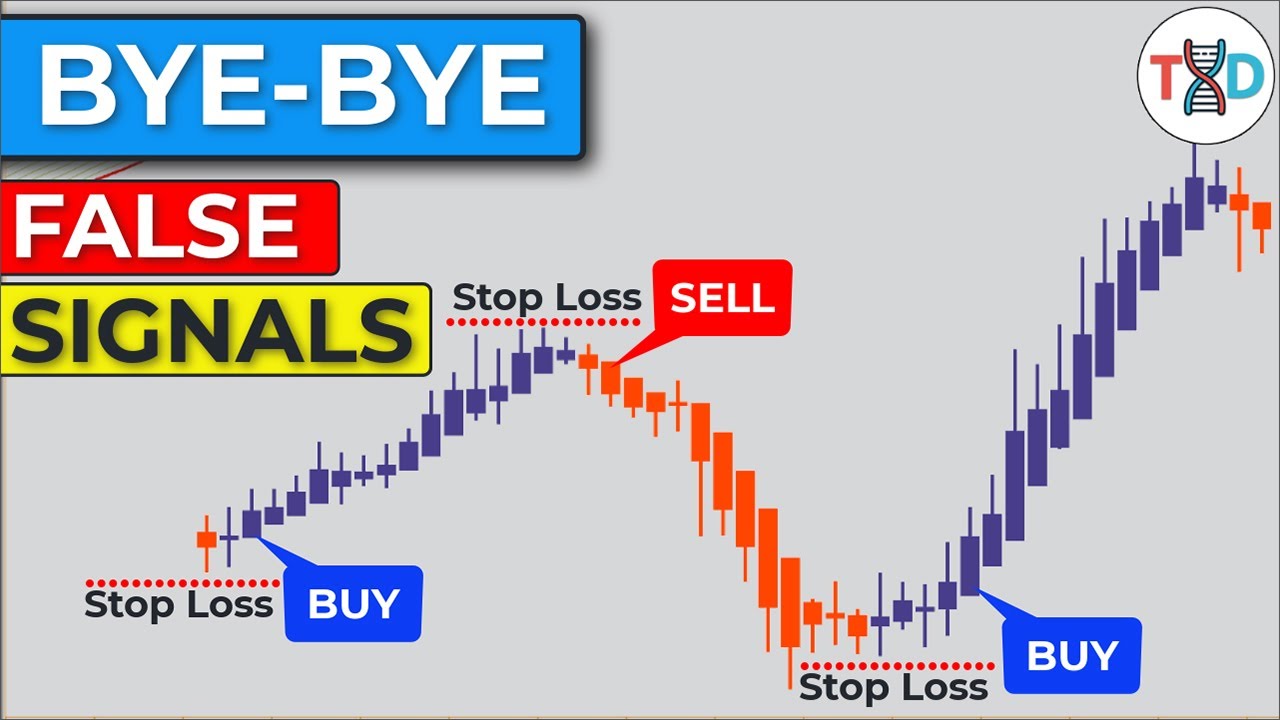
a series of impulsive and corrective moves Market continuously makes new higher highs and respects the higher lows if you zoom into the one-hour time frame you will notice that this four-hour impulsive wave consists of impulsive and corrective moves that respect the higher lows in the perfect scenario but in the imperfect scenario the price will create fake breakouts before pushing the upside to develop higher highs when Traders see these fake outs they think that the price will reverse and they go short in the supply Zone and get stopped so if you have in-depth knowledge of the
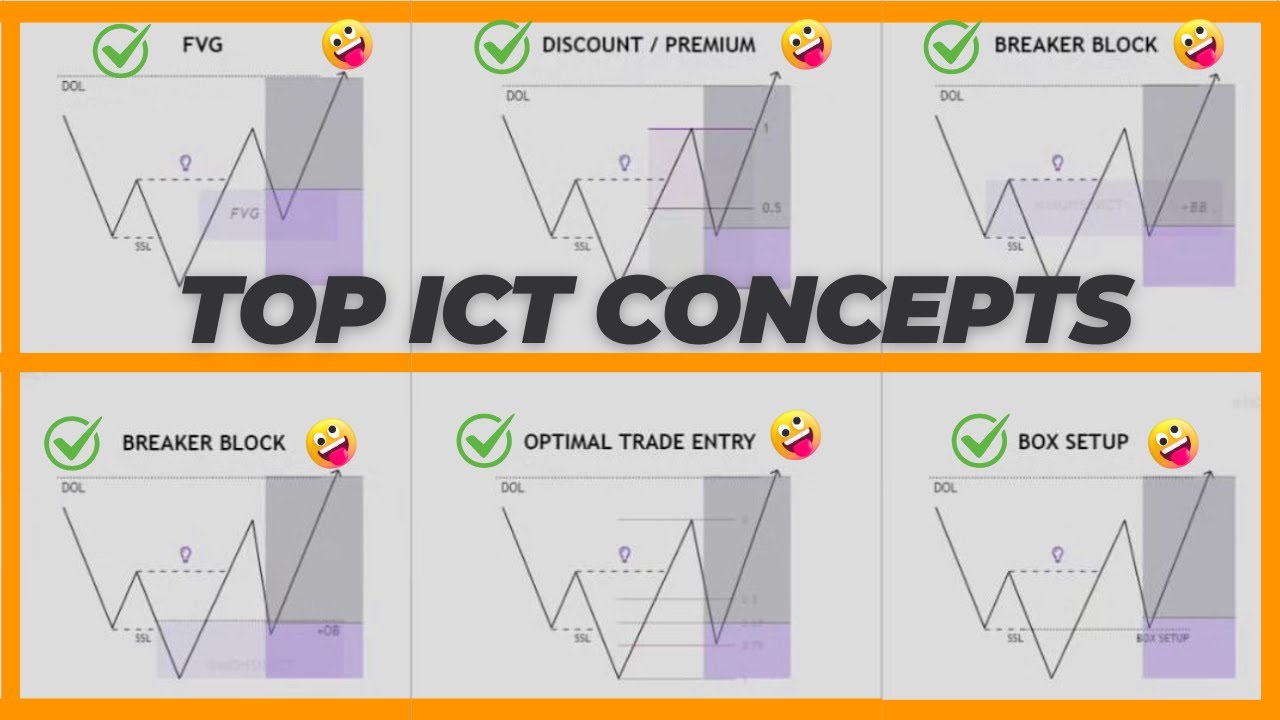
market structure you will realize that since the higher time frame is bullish you will find an order block and go with the dominant trend so here is an important point the best trade areas are where the lower time frame and the higher time frame are in the same direction here on the euro dollar one minutes chart these are the impulsive and corrective moves that we see but if we zoom out to the five minutes we only see these ones so in the areas where one minutes and five minutes are in the same direction trading will
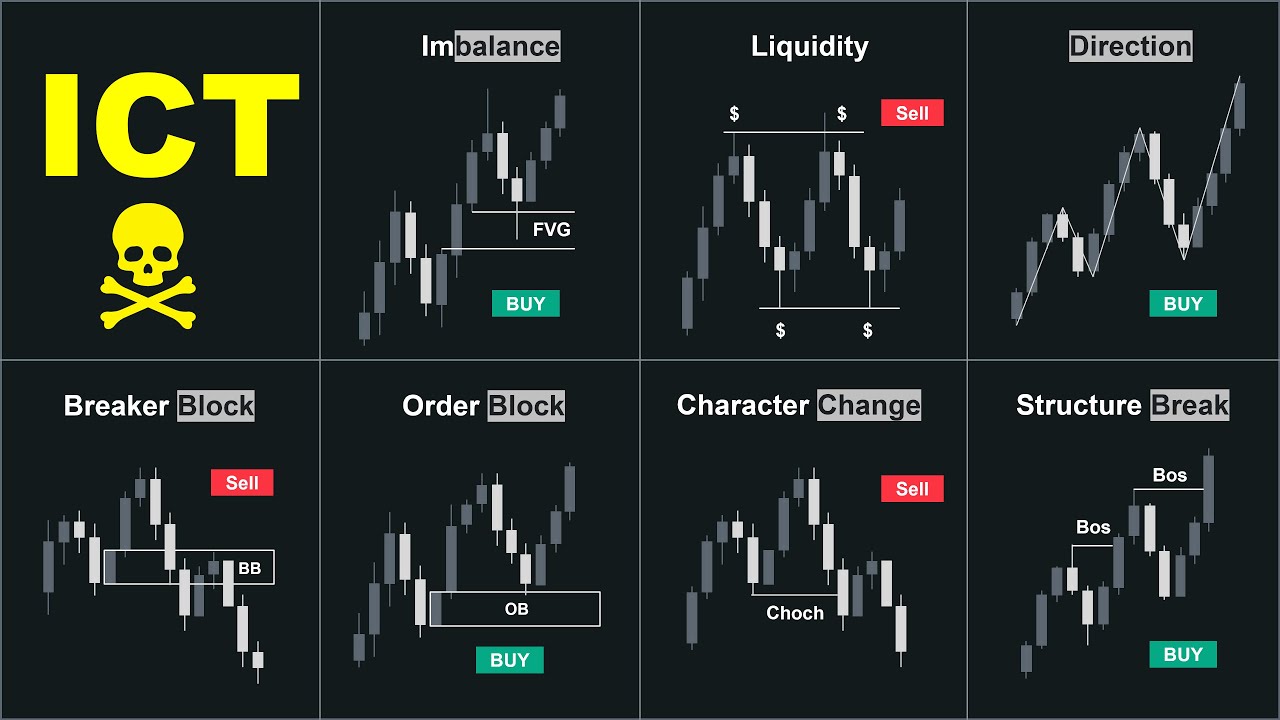
make more sense now that we explain some of the basic concepts about Market structure let's move on to the advanced phase but before we continue if you have enjoyed this video so far please give it a thumbs up and subscribe since it goes a long way to support us for making more videos like this also comment below and tell us what topics you want us to cover in the future since we always look at them to decide what video to do next when discussing the ICT Concepts Market structure is all about who is in control
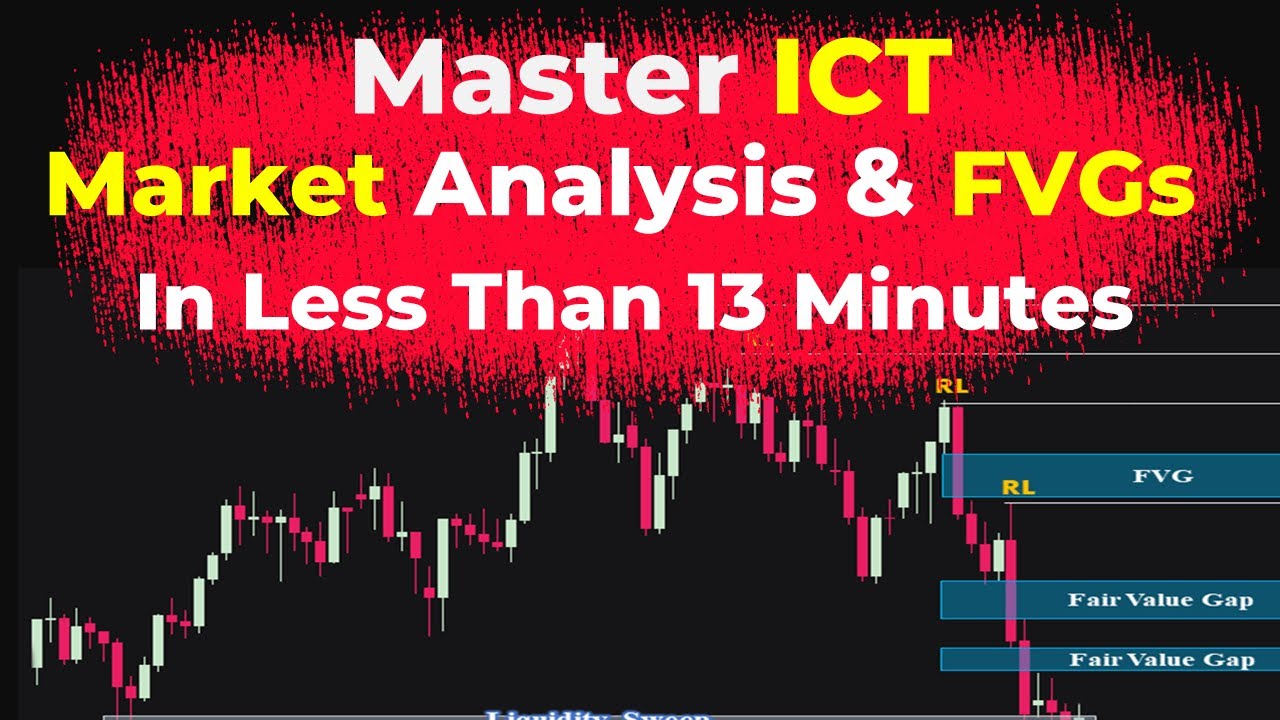
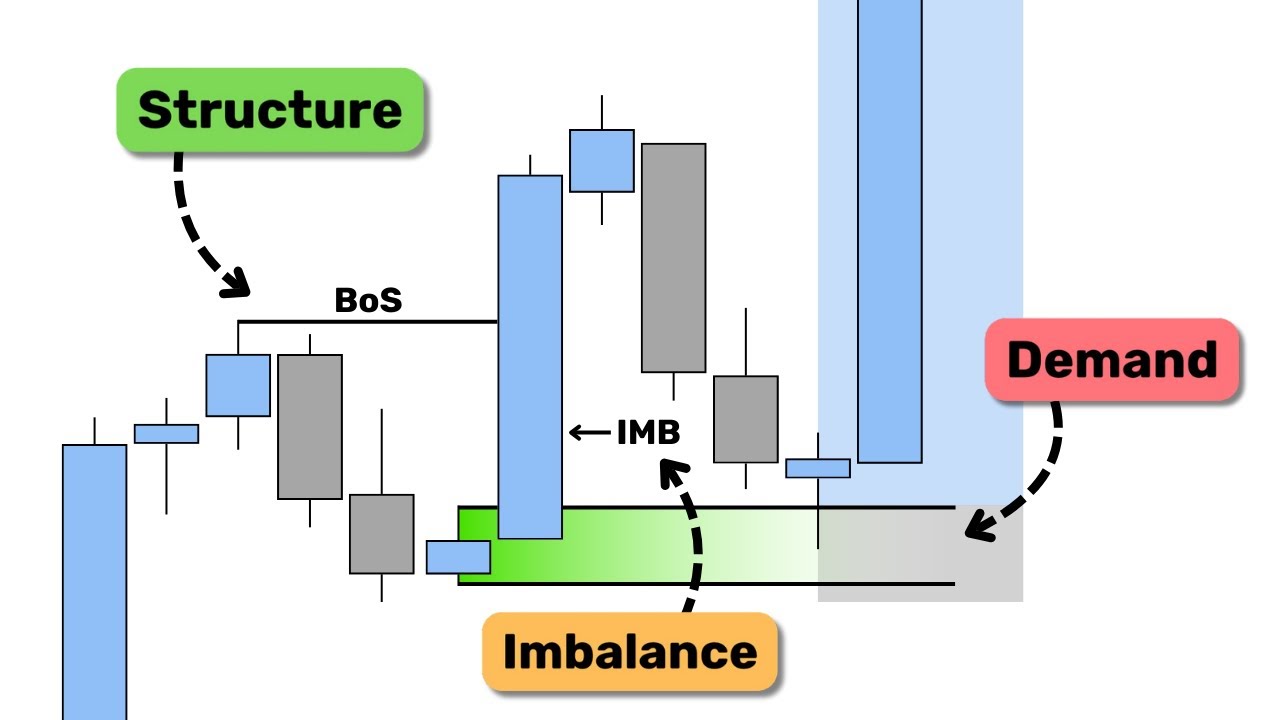
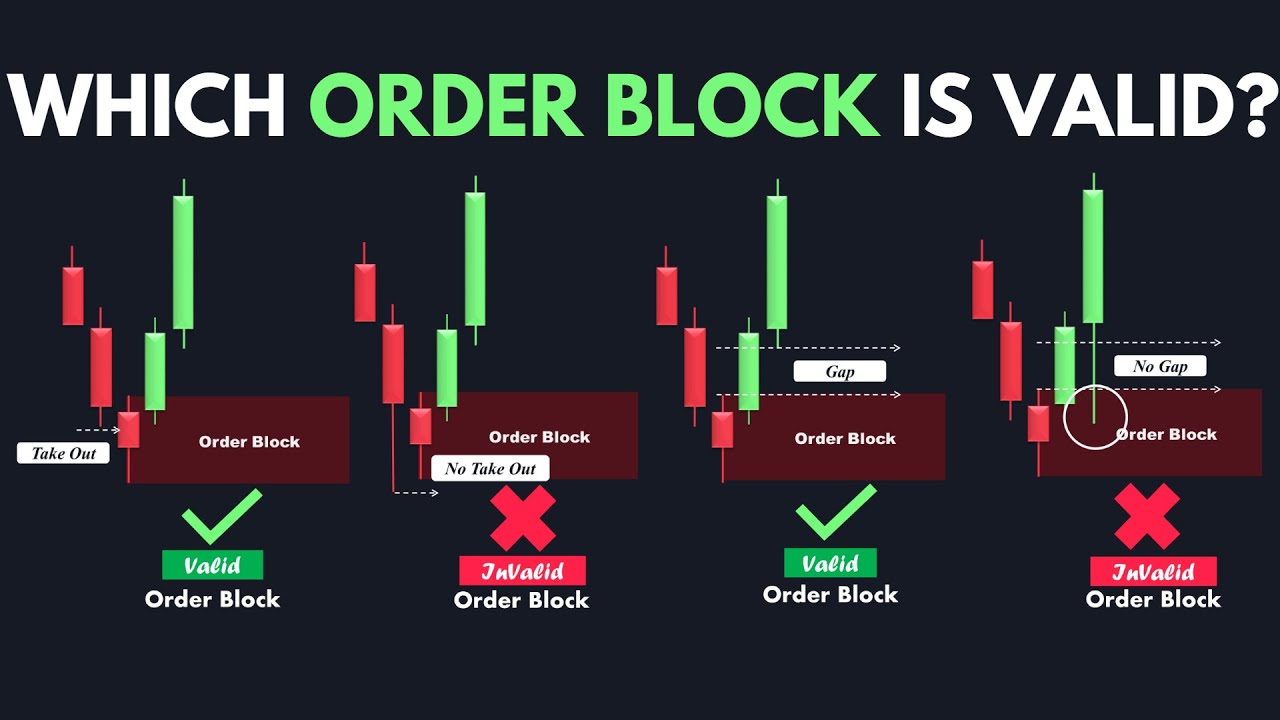
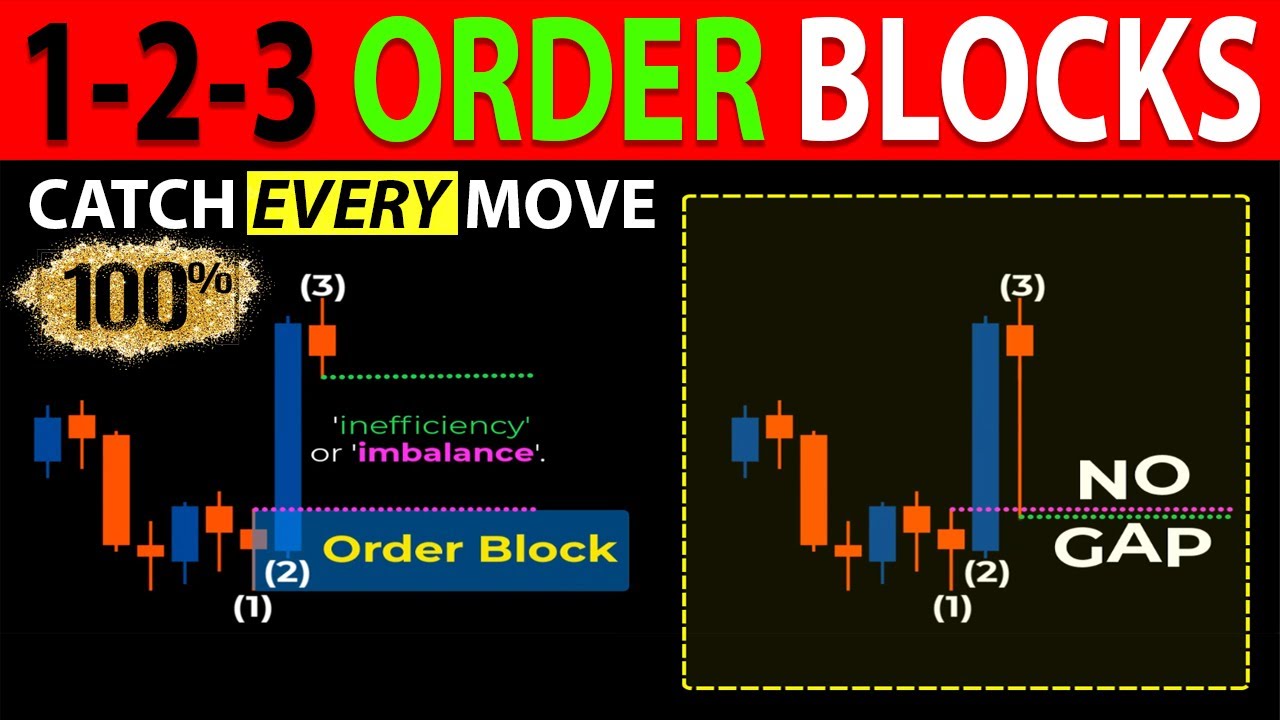
Supply or demand but the key point is that a valid supply and demand Zone has three criteria so the mitigation or break of these valid levels allows us to identify the market Direction the first Criterion of a valid zone is that it must have an imbalance imbalance simply means lack of proportion between the buyers and sellers which causes a massive move in the market the second feature of a valid zone is that it must break the structure or change the character the third feature is that it must be unmitigated supply and demand zones are one-time
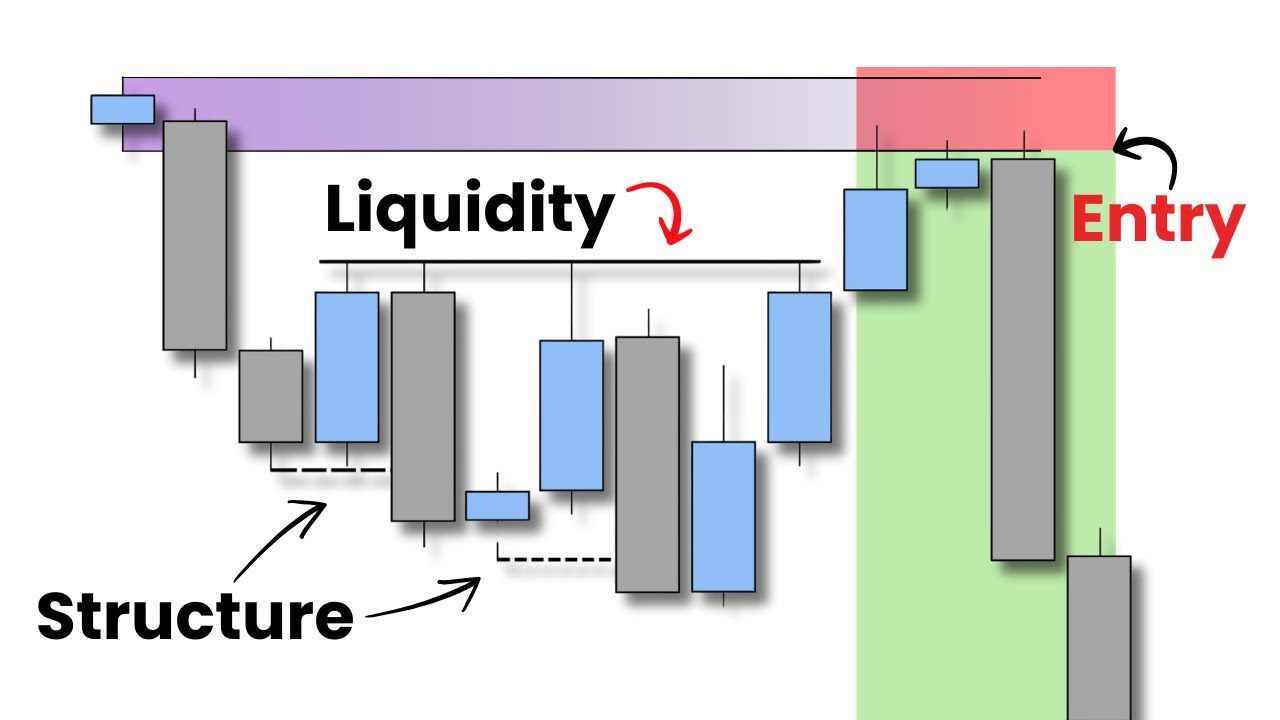
use so the ones which have been mitigated before are no longer considered valid zone for us if a Zone lacks one of these criteria it won't be considered a valid Supply or demand now let me show you some of the common ICT Market structure patterns and how we approach them when they happen on the chart the first pattern is called the market flip this pattern happens at the end of the trends when they get exhausted resulting in a Direction Change we have a valid demand Zone with a breakup structure and imbalance the market mitigates this
level but fails to create a higher high showing momentum loss this eventually leads to a change of character and leaves behind a perfect trading opportunity so we go short once price Taps into the supply Zone and we target the next unmitigated demand level here on the Aussie dollar we had an obvious uptrend until Market reached this valid demand Zone that created imbalance and break of structure the market mitigates this level but fails to create a new higher high and finally breaks through so this is a valid change of character move and leaves behind a perfect
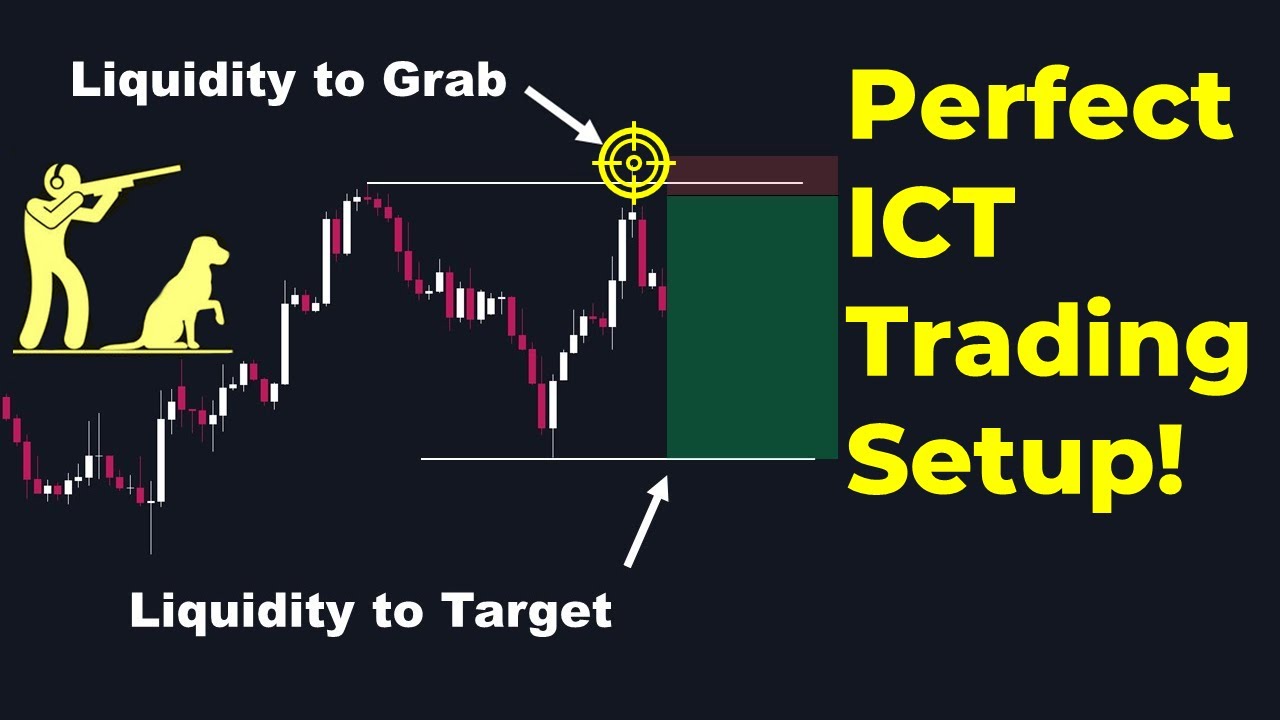
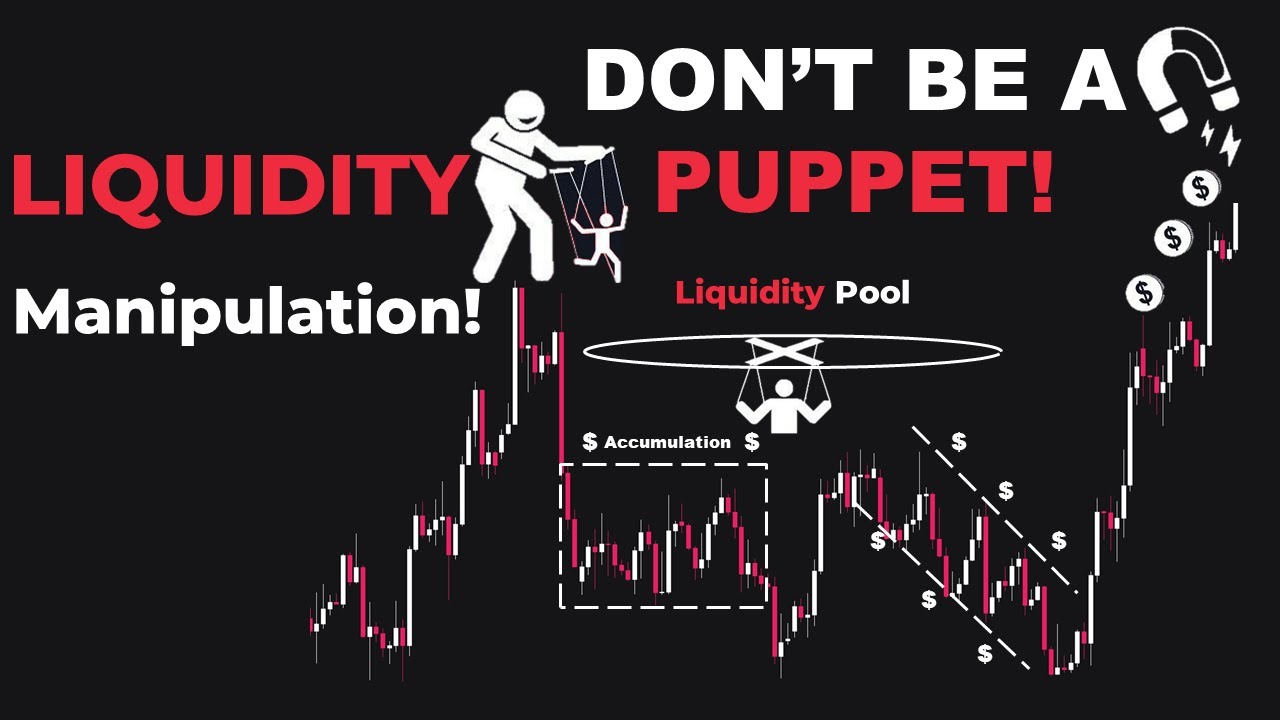
Supply Zone so here we can go short if the price gets to this order block and our long-term Target would be the next unmitigated demand Zone in front of the market next we have a common liquidity grab pattern this pattern happens when most Traders take a fake out as a change of character and the market continues to push in the same direction when it reaches a valid Supply or demand Zone here we have a valid break of structure but no imbalance but looking to the left we have a perfect unmitigated demand Zone with a break
of structure and imbalance so if the market breaks through this level we would not take it as a change of character and instead we look for buying opportunities in the demand Zone here on the USD CAD we had continuous higher highs and higher lows although this demand level broke the structure to the upside but it printed no unbalance so it is not a valid demand Zone on the other hand when we look left we can spot this perfect imbalance creating an extreme demand level so this change of character is invalid for us and this move
has a great chance of being a liquidity grab so we'll place our buy order a spread size above the order block and Target the next level of Market structure keep in mind that these setups have a great risk to reward ratio and even if the win rates are lower than even 50 percent you will end up being profitable in the end but it is highly recommended to save some profits if you end up being right so guys practice these Concepts on your chart and I hope it will improve your analysis of the market structure I
hope this video had some values for you if it had please give this video a thumbs up and subscribe if you have not already and see you in the next episode foreign