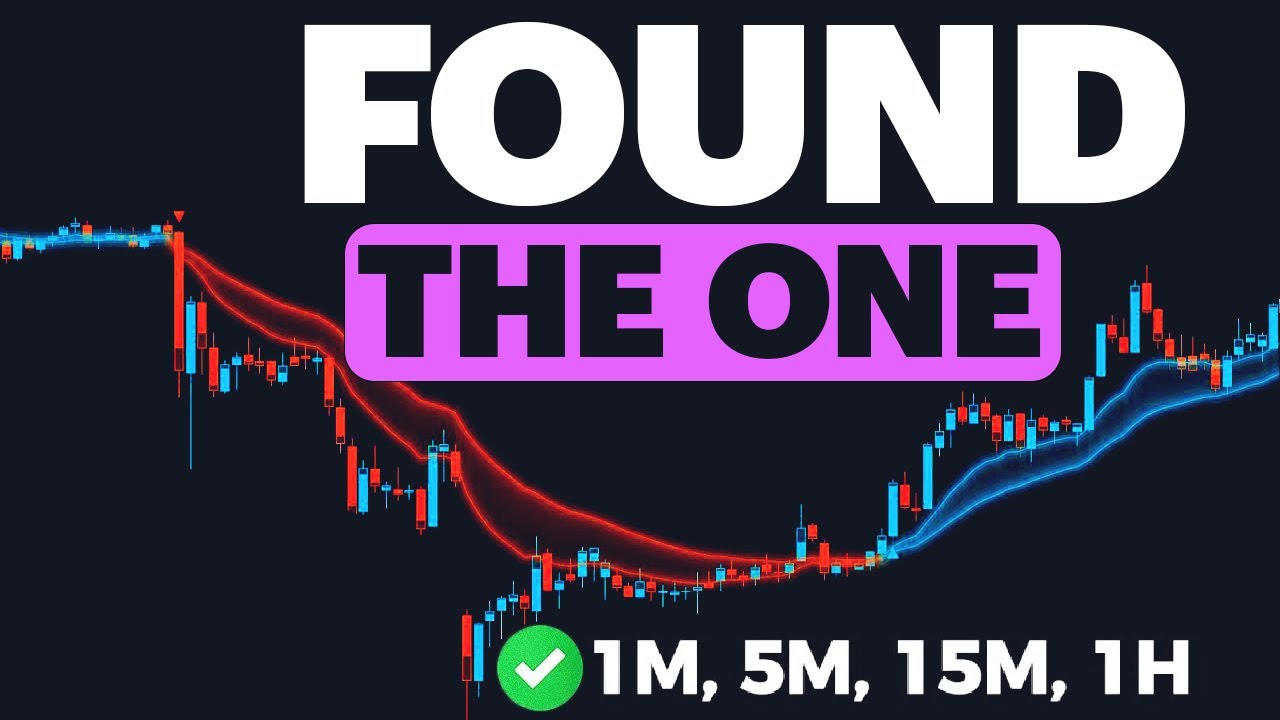
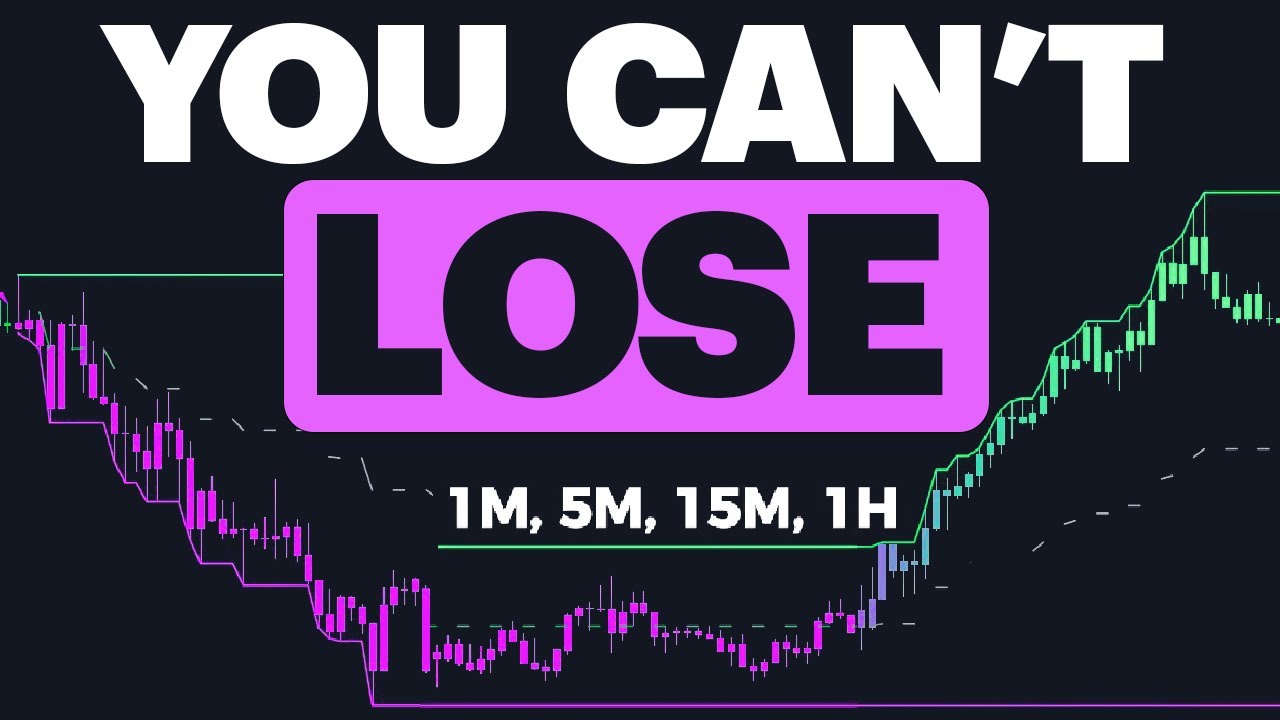
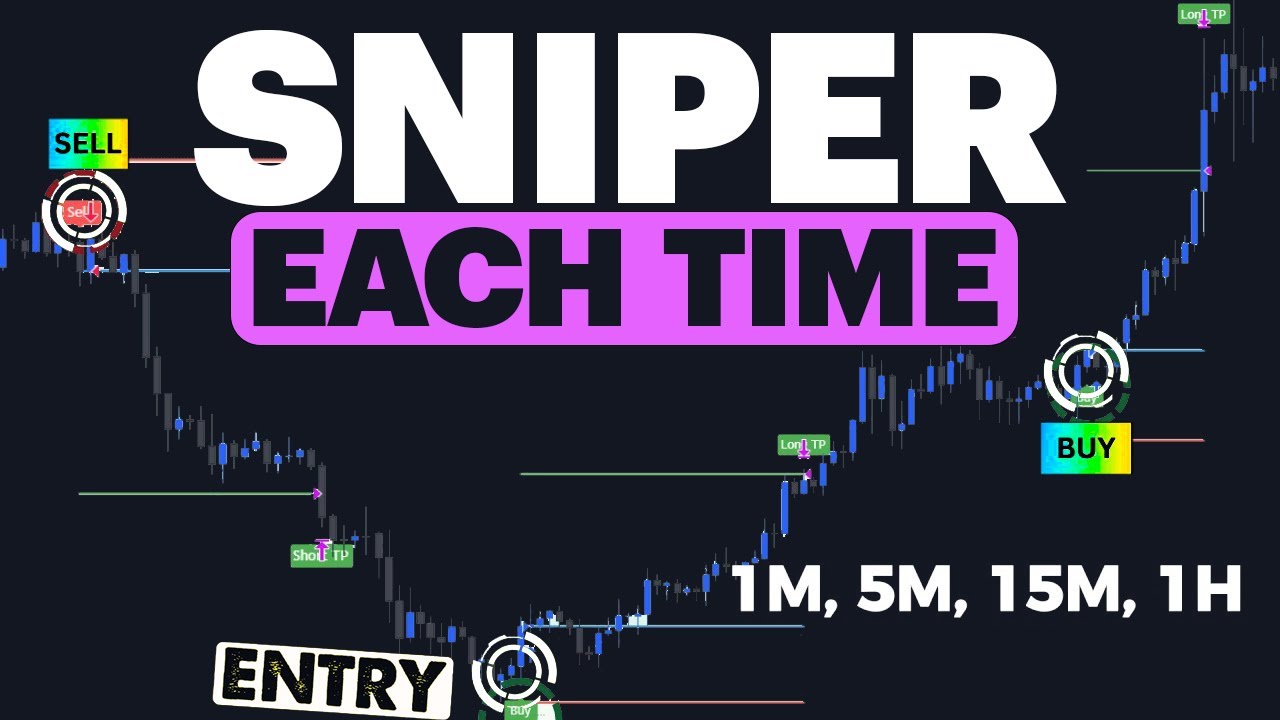
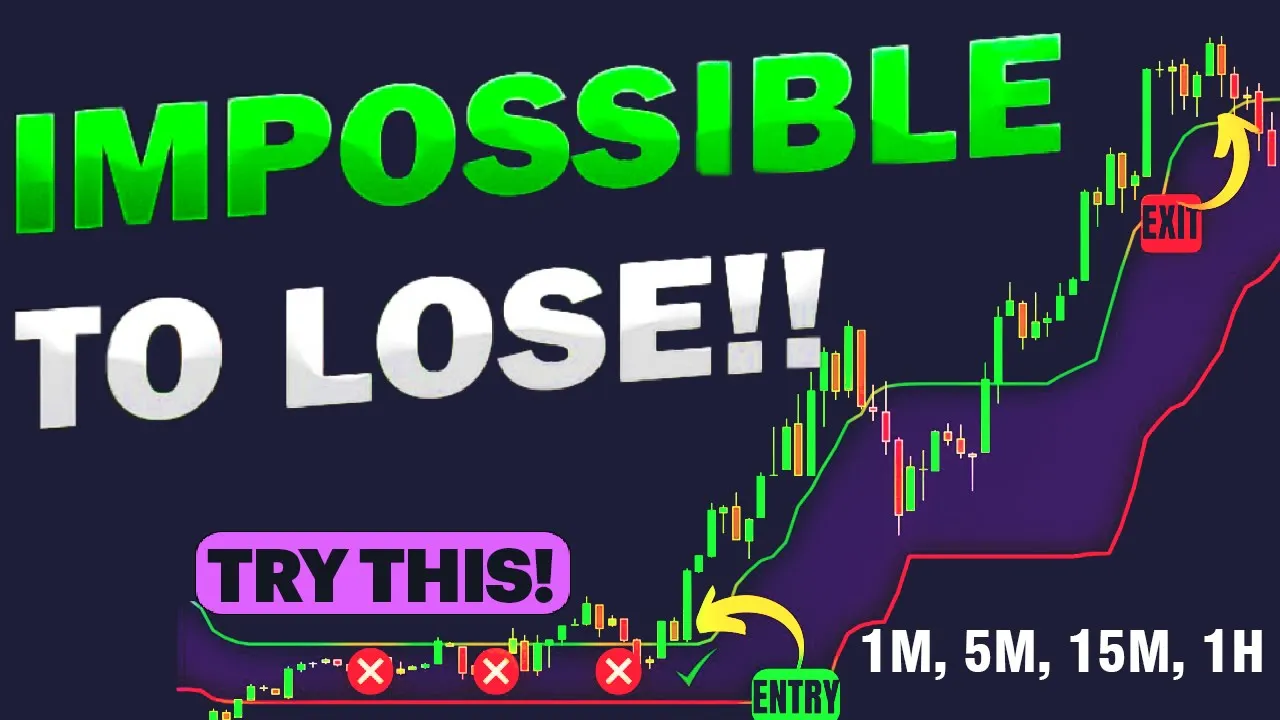
you're going to explore the momentum bias index by algo Alpha which is designed to help you access's Market momentum bias lock Pro I promise it's easier than it sounds so don't worry to get it started open up a chart and let's say you're looking at the gold chart now you'll want to choose a time frame you can go with 1 minute 5 minute 15 minute or even 1 hour personally I prefer 15 minute time frame but feel free to experiment and find what works best for you next head to the indicator section at the top
of the platform and click on it a window will pop up and in the search bar type in momentum bias index and hit enter once you see the results select the one by algo Alpha and it will be added to your TR the momentum bias index is a fantastic tool that calculates the positive and negative bias of momentum to determine the overall trend this will be our secret weapon our signal generator indicator that will provide accur signals for making profitable trades but before we jump in let's optimize it for maximum potential to do this click
on the gear icon next to the indicator's name and head to the inputs tab here we'll need to make a few adjustments to tailor the indicator to our needs first change the source parameter to close then it draws the the momentum length to 9 after that change the bias length to S and the smooth length to nine and then set the impulse boundary to [Music] 27 and the standard deviation multiplier to three [Music] make sure the smooth option is enabled and the overlay mode option is [Music] off feel free to change the colors you're luing
to finally make sure the time frame is set to chart so it uses the current chart time frame and there's not much to change in the style section so we're all set all right so now that we got our momentum bias index set up let's talk about getting some confirmation for our trading strategy we're going to use another handy tool called the high and low optimized strength tracker or H lot indicator to help us make even better decisions head back to the indicator section again and this time search for h l o TT and then
add it from the results [Music] this awesome indicator has two lines highest price value hot and the lowest price value lot which comes from the original default OT settings there's no moving average in this version but don't worry we've got everything we need nice the area between the H and L lines is called the flat zone and it's good idea to just chill and do nothing when the price is hanging out in this Zone but when the price breaks out that's when things get interesting when the candles close above the hot line it signals and
uptrend and when the candles close below the lot line it signals a downtrend the flat zone also gets highlighted so you can stay focused on Sideways market conditions but before we dive end let's TW some settings for for the hot so in the settings change the colors and line technus for Hot and lot options then adjust the bar color options and the highlighter opacity [Music] no need to mess with the UTS parameters so we're good to go now let's learn how to make some money with this fantastic trading strategy the momentum bias indicator will generate
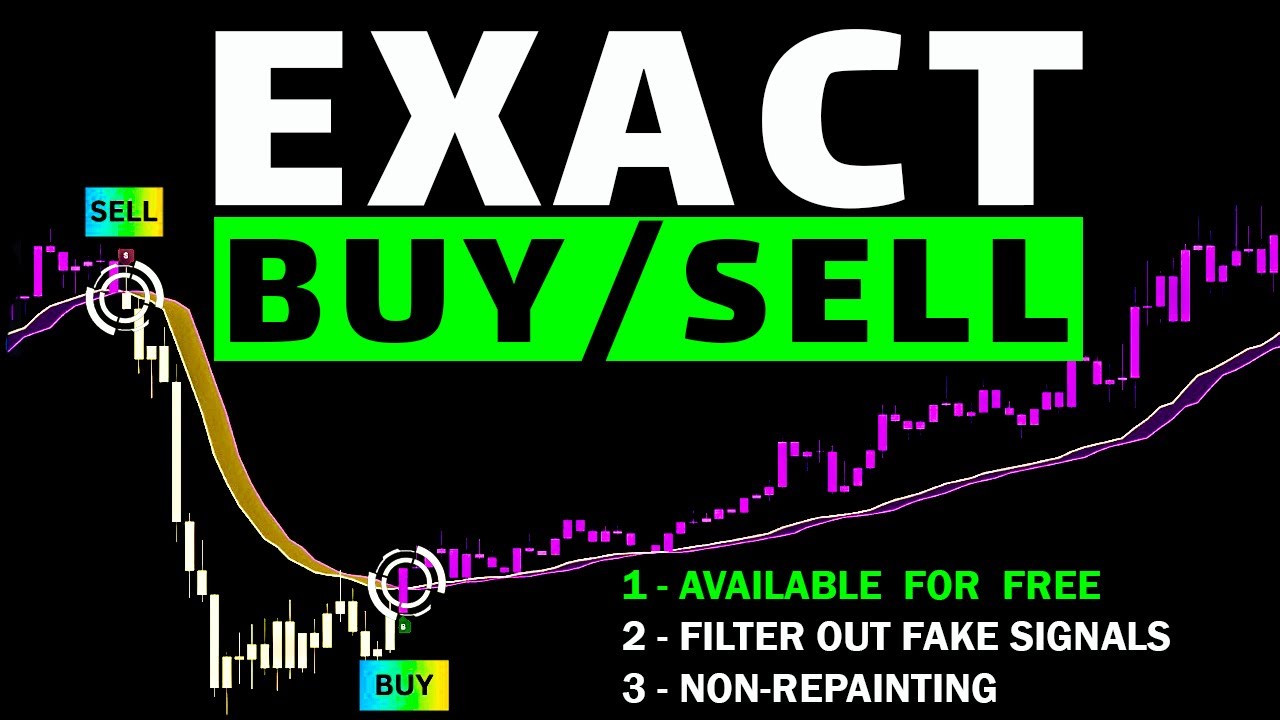
our signals and here's how when the Red Bar stays above the dots on the oscillator that's our cell [Music] signal but hold your horses we need confirmation before jumping in for a sell trade we want to see a downtrend on the chart which means the signal candle close price should be below the lower line of the Hott indicator now that's a confirm sell signal so you can open the trade set your stop loss at either the upper or lower line of the HLT indicator and try setting your target at two wice the risk of your
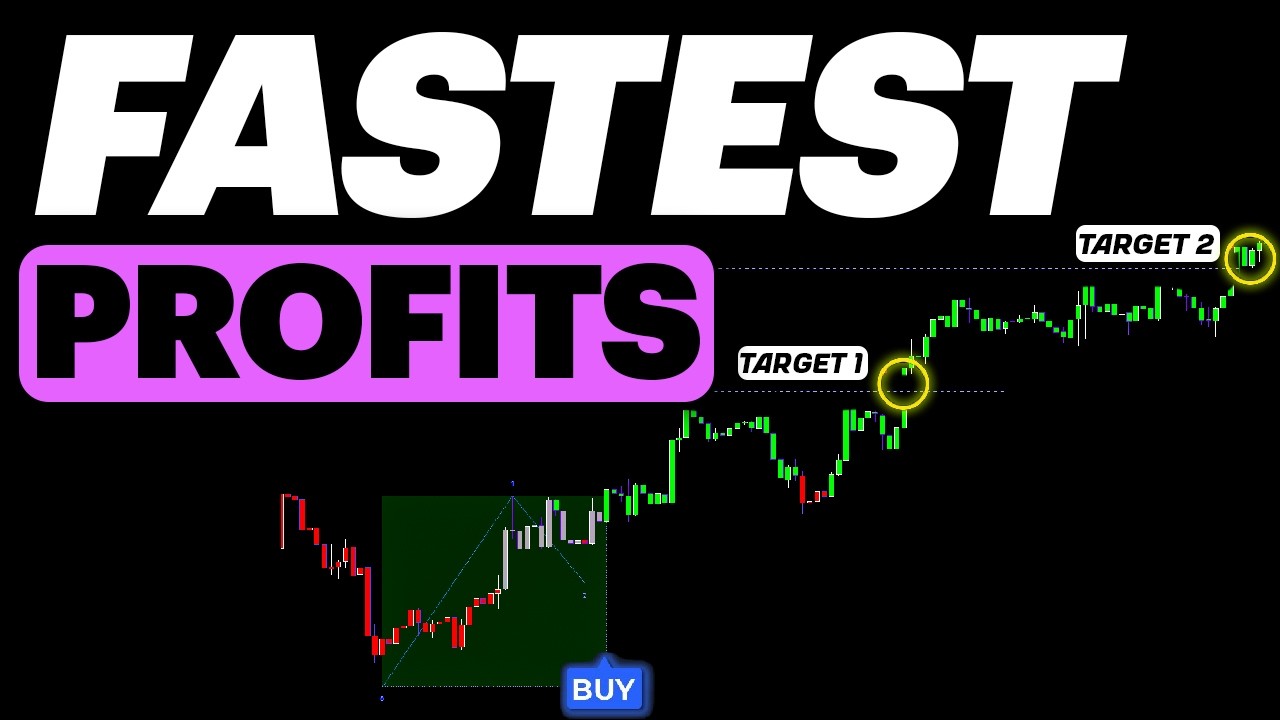
trade for the solid restor Avo ratio for buy trades is basically the opposite we're looking for a green bar above the dots and an uptrend on the chart with the signal candles close price above the upper line of the HL confirm the Buy Signal and set your stop- loss and Target and you're ready to roll [Music] all right folks hold on to your hands because I'm about to share some jaw dropping back testing results using this amazing trading strategy we got the gold 15 minute time frame for a spin and conducted 100 traes brace yourselves
the V rate was a whooping 72% that's right we had the ball size 72 times out of 100 but wait there's more over the course of three months we managed to reckon mindblowing 120% profit and if that's not impressive enough The Profit Factor was an outstanding 3.83 this means for every dollar we risk we made $ 3.86 in return talk about a solid investment now let's talk about consecutive wins and losses during our back testing Adventure we experience an incredible streak of 13 winning trades while only enduring three losing trades in a row desper is
to admins to loss ratio if you ask me finally let's discuss the RIS involv the max throw down during our back testing period was a m 2.97% for those who aren't familiar with the term Max Throwdown is the largest drop from a peak to Valley in your trading Equity so in simple terms a strategy experience is a small decline of 2.97% before it bounced back up that's Somey low risk for such fantastic returns don't you think and there you have it folks the numbers don't lie the trading strategy has shown some seriously impressive results and
it could be your Thicket to boosting your trading success of course it's essential to test the strategy yourself and maybe even on a demo account before diving into the real deal but with a solid game plan and some patience you can be well on your way to becoming a trading Pro oh [Music]