Hello folks this is Michael with a warm welcome to part 5 in our continuing series of the ICT scout sniper basic field guide and this episode is titled range finding ok and what will be be covering in this presentation well we're gonna be reviewing the previous episodes assignment tracking institutional price action now you were instructed to go through your charts and look at the daily and four-hour and look for Reference points and order blocks so you can pull your fibs cross hunting optimal trade entries for those who didn't do the homework we're gonna be giving
a couple examples and we're gonna be looking at specific charts and we're gonna give a specific order block illustrations now I worked up a couple illustrations obviously in the fiber which is the eur/usd would give you a bullish example in fact we're gonna probably give you two or three of them And we'll give you a bearish example and we're gonna be looking at a pair that's probably very alien to anyone who's been following my work the Canadian dollar and Japanese yen pair okay we're gonna be looking at a bullish example is that basically to highlight
the the overall Universal application to my concepts and even applying it to an exotic pair like this as an illustration and we're looking at another in my opinion is an exotic is Australian in Japanese yen we're gonna give you a bullish example is that pair illustrates an exotic application as well remember talking about target selection concepts and it begins with price swings and now obviously it's in the eye of the beholder okay so without your ability to see the overall price swings that's going to be the hindering or obstacle for you okay so you're gonna
have to put some time into looking at the charts you haven't already done so And acquired that talent you're going to need to do that before you can actually move forward price reference points we're in talking about that specifically and we're going to be introducing the 50% rule of symmetrical price swings and we giving you the instructions of mt4 FIB calibration and we're looking at ICT swing projections Wow market the symmetry in the bullish realm okay we're going to talking about equilibrium and price swing fulcrums we're going to give You upside objectives and we're looking
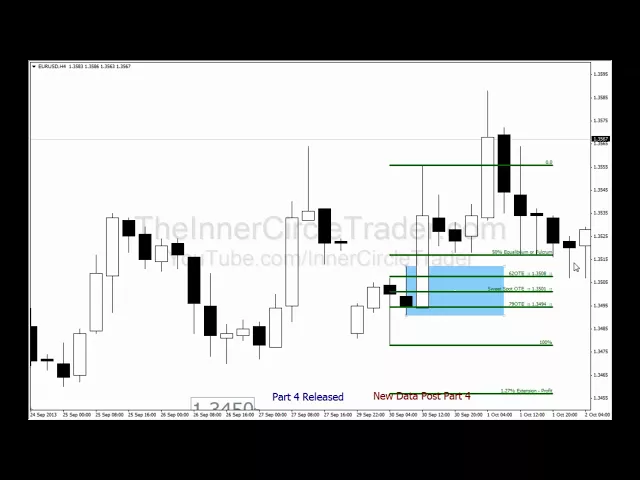
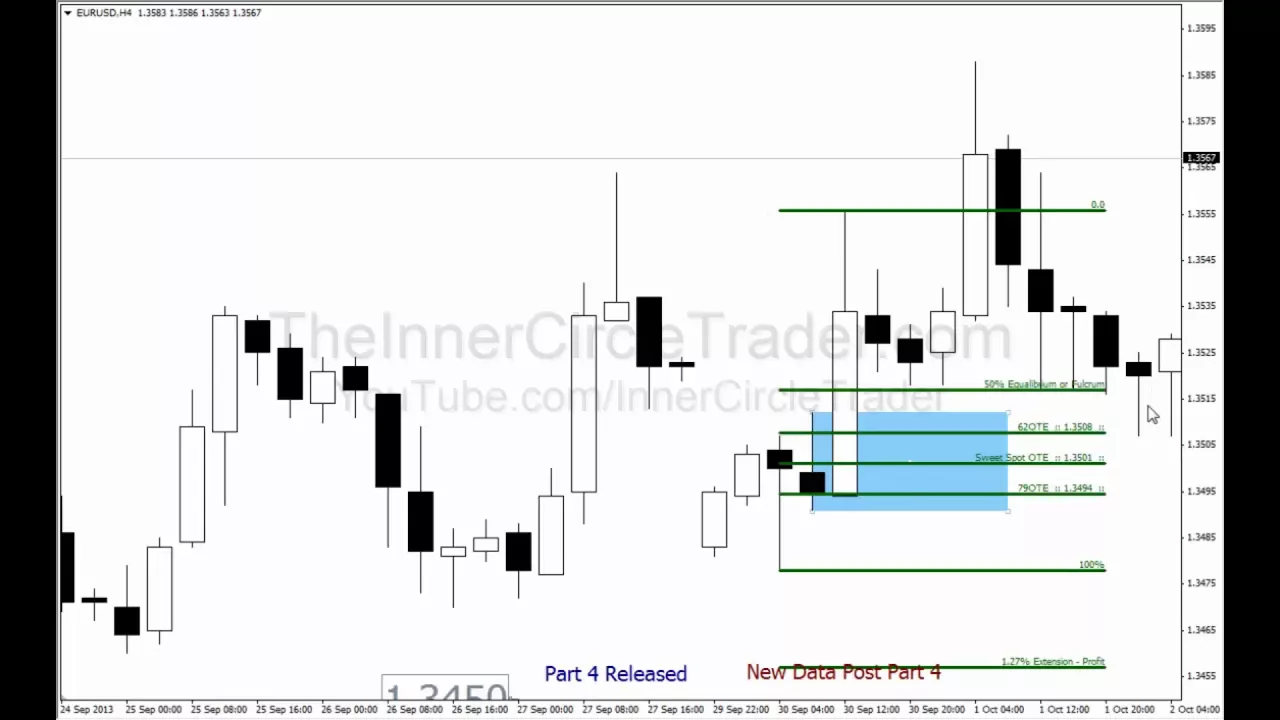
at the chart examples of upside swing projections and we're gonna be giving you a barque bearish market symmetry dealing with the equilibrium price swing fulcrums which points to downside objectives and we're going to give you examples of downside price projections as well and yes homework we're gonna be looking at projecting swing targets so let's get started okay guys we're looking at the euro this Is the daily chart on the fiber and withdraw a few things here I'm gonna bring your attention to we have this high here and this high here and we're gonna put it
right on the highest high let's candle it's roughly thirty four fifty but I want to draw your attention to the bodies of these candles and the highs of these okay if we draw our little horizontal line down to that and we're just gonna move around right there you go you see that not thirty four Twenty thirty four twenty is the level essentially that this price was reaching for okay because it's the institutional level we like to follow again it's the full figures zero zero levels two 20s 50s mid figures in the 80s okay so we
have this level here thirty four twenty to remember that because when I come back to it in a few moments but this is what price action was doing prior to the previous release of episode four in this series and we're going to do is we're Going to draw a chart into a four hour basis again that one thirty four twenty level keep that in mind okay we have the four-hour chart here we have mark structure breaking here breaking this high here coming back down trading into this previous order block okay and we're going to put
a few different order blocks on this chart okay price dips ten dips into it rather right in here and we also have market structure breaking and confirming even Further here with another order block here that we will reference okay so again we have this block and this block and I'm going to just change the color this one just so it could be slightly different or in this case drastically different so we have market structure again shifted bullish here the low was maintained here made a higher high here so this low is sensitive in other words
we want to see price and they anticipate rather price this thing above this low Okay but let's pour fib across these ranges okay we have the low to high and price coming down to the 7s and tracing level that one thirty four seventy six level so really the 134 80s it really handsome area that one could have utilized to get long the fiber really likes the ASIS warnings and 50s and price did obviously give you an opportunity to be a buyer here but moving forward okay that's what we're at now we're we're gonna look at
examples Okay based on the idea what we shared in part four okay this was the order block that would have been staring you in the face at the time of the last release of part four of ICTs scout sniper field training guide price comes right down here is the day that the market I'm sorry the video was released right in here and this is where if you look at the the swing here here's the price swing and you have it's a nice at sufficient level right in here okay and Price trades Dallin gives you a
nice hammer see that it's a very nice confirmation in terms of candlestick patterns ok just counts like pattern alone means nothing but when you have this couple with an order block it dips into right here and I guess it'd be a little bit more helpful if I do that over here for you to illustrate well what specifically I'm referring to and also let's go back to that 134 20 level okay I'm just gonna squeeze this Chart up just a little bit because we need to reference a level that's outside of the view okay here's that
134 20 level all right and again we're referencing this old high okay so go let's go back to that chart and we're going to use our fib from that level up to this price point right there okay so we have the 62% tracing level coming in there and that 134 74 level okay so by itself between here and here this Is an area where we could reasonably expect to see price bounce if we're using that range okay and the 134 50 level here let's draw our fib from that part reference point and we have price
moving within the optimal trade answers changing right down to that sweet spot why I keep doing it with the mouse price trades up okay and so we had one optimal trade entry in here price rallies up we have another order block right in here so I'm just Gonna borrow this range okay and if price dips down into that we could be a buyer again okay again this is a four-hour chart okay so one thirty four ninety four one 3508 the range in between here is a nice level to anticipate possible buying opportunity should price get
back down into this order block and defibs price trades right down to that 62 percent entrer so I'm go right in here I like these two candles like that it's Nice as tweezers price comes right down again dips right down to that one thirty five almost a 135 figure big figure and realize up aggressively and you can see we moved up pretty handsomely okay so you have a few opportunities in here where it was obvious that you know the higher prices that we were calling these are the setups that were available to you and ultimately
price did trade lower here we broke a significant low and let's look at that for a moment Because I was asked in Twitter to give an example of bearish an environment where you could use this information so we have the bullish candle prior to move down okay inside of this area here okay this big candle institutions were selling into that okay and market rally I'm sorry declined and what you want to do is you want to see price try to trade right back up into that level and that order block and let's use price points
136 swing Institutional which is essentially in the area of this candle we could use 136 figure but it's very close to the level here so I want to be outside of the range with the expectation that this this market may in fact roll over okay I'm using the lowest low here okay prior to that 136 20 so the range is between this low and the institutional level which is essentially where this is keying off of and if price gets up into these levels here we could be a seller You see that happening right there okay
notice that we dipped above this level so we went back inside of the order block here and we had a nice optimal trade entry boom okay if you want to go to the basic OTE you can use this swing high and this swing high okay but I'm going to show you the highest high down to that low okay we got just a equilibrium point okay which really isn't beneficial to me if you use this swing high here you bang Up into that 62% tracing level and still inside the order block but notice the candles we're
unable to have any of their bodies within that around its only thing the wicks and then it was rejected and treated off and we had obviously another retracement let's get to fit off okay we have an order block here okay price slipped lower if trades back up into this area or a little bit higher we could look for a cell and price occasion opportunity trade trades right In here but where's it go right back into an old water blog sent it higher here and this is what we're trading at now okay so again that's the
fiber and if you go back out and we're going to look at this this particular order block here and this occurred on the 30th so that the day of the release of the the episode four okay this this broke out started moving higher and price moving back into this order block here would be indicative of a buy opportunity so we're Going to look at how price dipped into it here on the 2nd of October and we're going to just take this old thing here and drop it right on there and it should when we go
down to a 5-minute starts to drop us into the New York session voila there we go so price drops down into it here right there and you get that explosive rally up do you think institutions were behind that move or II think it was Joe public clearly institutions okay and obvious you can See how price roll DeLand higher and the exercises that you were instructed to do or to utilize these concepts and move forward and you judge whether or not they're useful to you I can assure you if you spend some time with it you're
gonna find that it's hard pressed to find something that's more accurate than what's being shared in this video series because it doesn't exist anywhere else and if I didn't make money with it I could sell the concepts and try to you know build a service system around it but I'm not interested in doing it I make a lot more money actually utilizing it so it's obviously something that you can learn on your own and it's not just this pair okay it's not just the cable okay British Pound USD not the pairs that ICT likes it's
it's universal and because it is universal and you can use it in other pairs and we're going to take a look at That now with two of the weirdest pairs in the ICT repertoire but we're gonna be taking a look at the Canadian dollar and Japanese yen I know you scratched your hands thick and what is that and then the Australian Japanese yen okay so take a look at those now okay folks if you're looking at a pair that I never trade but I just want to give you these examples to kind of frame the
universal application of these concepts and really communicate that it's not Limited just to the fiber and cable which I mean predominantly my my pet pairs in the forex market I like to stay within the majors but if you are just really one of those types of traders where you just have to be trading these exotic pairs well I mean it still works but I just simply don't trade it myself okay so we're gonna look at this example it's a 4-hour chart on the Canadian dollar in Japanese yen pair and I generally don't like to trade
the end Pairs but you know again just to illustrate the effectiveness of the tools I want to draw your attention to the fact that we had this nice rally up gay we had this really really rapid increase in price about 500 pips or more between the low here in August to the high formed late in September and I want to draw your attention to the fact that we had a few areas aware price could reasonably expect to see a bounce you See this consolidation in here and we had a consolidation here as well notice they're
accumulating around old highs and lows here to the left side of your chart let me draw your attention specifically to this one right here okay this is a down candle within this consolidation prior to the move out of this consolidation in other words we're going to be using the high that candle as the beginning point of where a institutional order block may reside Okay and there's a few things that we could be utilizing in this setup we could be referring to this swing low here prior to this rally up okay we're going to use the
highest high which is this one right here okay notice we have a 62% optimal trade entry overlay right here okay see how that's very close to proximity oh that 94 60 we got 94 65s there's only a variance of 5 pips nothing wrong with that ok so anywhere between the 9465 94 60 maybe even 55 level to allow for some slippage to allow those orders to be pinged we could see a nice little bounce in here okay and another area where we have consolidation which is in here a prior to the rally up out of
that consolidation the down candle prior to the move is right in here okay so we're gonna use the high that candle right in there okay and if price trades the lower and much deeper into that price swing okay we could use This low to this high because we're looking at the range between the low here and the high here much in the same way we did this low to this high okay notice we have this setting lights and tradesmen level laying right on that same order block okay so if the ATLA trade entry sees price
come trade down into these levels here that could be a favorable area to be anticipating a bounce as well now again all these levels do are highlight areas where on The smaller time frame price entry patterns formulate okay or come to fruition and since we're teaching the optimal trade entry which is the retracement inside of a price swing between the sixty-two and setting us at tracing level we would like to see a price pattern in the same capacity and a fractal nature on a smaller time frame ie five-minute 15-minute okay so with that said let's
take a look at what transpired okay first we're going to Look at is here and here the second one okay as price moves along notice how price came right down to that level right there okay and bounced up just in that little bounce right there we're looking at a potential for price move of a hundred pips okay now if you see that the middle number here it's a hundred pips nothing wrong with that okay and that's intraday again each one of these candles represents a four-hour time Period okay price and variably goes lower trades in
the direction of the higher time frame retracement okay and as price moves around comes back up to finds some resistance that same level twice and it moves down to what level that 9337 okay 9337 so we came right back down to this point of origin where this initial price move originated okay price comes down stabs do it pinging any orders that would have been around that 93 35 to 93 40 level okay and price proceeds to move up and to present market if you look at where we moved from this level here up to the
high now again this is the best case scenario that's a hundred and eighty plus pips okay just trading that bounce right here now what we're gonna do is we're gonna break that down and zoom in into both of those areas to highlight where price may have because we don't know I'm looking at these examples the first time so I May be encountered with an opportunity that wasn't there okay but for now we're just gonna take a look at this here I'm gonna price trades down into these levels here we want to be looking for an
optimal trade entry to key off on a lower timeframe okay so we're gonna do that now okay you're zoomed in on the Canadian dollar Japanese yen period this is a five-minute chart and this is the first of the higher most price levels that we were looking at on the 4-hour Chart and this is the day that the last video of this series was recorded and posted on YouTube is September thirtieth and we're moving down inside of this for our order block delineating with this blue level in here okay and when we look for specific price
patterns okay there's a couple things we got to go back to Rimmer we're in the fifth part of the series but it's not that you're supposed to forget everything we learned and covered in the Previous videos we're gonna now go back throughout the first four videos and pull out some of the gems that you should have been gleaning and keeping track of on your little notepad and hopefully you can start seeing these things start synergizing okay when we see an order block like this okay much like a higher-level time frame piece for resistance level we
are to calibrate them okay this level here that 94-60 s already Calibrated to a small round number but now think in terms of big round numbers okay we have the 9480 level institutional up here okay so that's one level to be considered okay we're going to do is going to draw a line on that okay so that may be one of interest and we have one here that's just a little bit outside of the candle but you still have to consider it because of static alone okay just a normal volatility in the market place if
it goes to 90 for 60 Okay any other block dips below that chances are it could utilize the 9450 level the big figure halfway part no guards it's a mid figure so what we're gonna do is we're gonna have our chart and I'm gonna highlight that level here okay now if you refer back to the previous videos okay you're gonna remember this term hidden optimal trade entry okay remember support and resistance if it's good it won't go down to the level twice okay you know it's it Will be accumulated and then it won't go back
and dip down further that's the premise between optimal trade entry well sometimes we don't necessarily have a specific price action other words there's a gap between the 50 level and where price is trading in here okay now remember gaps don't always have to be filled and that notion is one of the central tenets to this pattern and this is one of the applications you can utilize for so we're going to do is We're going to have our Fibonacci tool okay and our point of reference here is this is the highest high at the time okay
going into this order block and we're going to reference this 9450 level okay and you pull this up and what you're looking for is you're going to drop it right on the highest high like that so you anchored your 100 level to the 9450 mid figure point okay and that's going to give you a range between the mid figure and the highest high in Here okay now if price is accumulating in here now you are not going to see this Fibonacci tool application anywhere else this is completely and utterly unique to me okay now I
catch a lot of flack for this thing but I also catch a whole lot of incredible entry points and I've trades that support it and results that reflect it so by line is it's gonna take a knack for you to learn to trust this okay in the only way you do it is if you play around with it and you do Your own research on this pattern okay but it's still an optimal trade entry it's a retracement within a range now it's price has not traded down to this point yet okay but because they're psychological
barriers okay in price we have to consider it okay and the way I use it is like this okay so if price trades down to the 94 74 level 94 69 or 94 63 that would constitute an optimal trade entry okay within the order block with the understanding and premise that It may not get down to 94 60 or 294 50 okay or very well may just trade through it and spike even lower and not even giving me a pattern at all okay but we have to consider this is a range even though price has
not traded to it as of yet or if at all we still consider that because it's a probable range within where price may have a bounce okay and I'll give you more examples in this series but for now lets us work with this one and this price moves down Into this level ok price goes just a little bit through the 79 percent retracement level doesn't get to the 94-60 here price begins the rally off and takes off okay and there is approximately 100 pips and price swing right in here okay so you're finding the range
where price may produce a move of sorts but it's going to elude you if you're just looking for simple things like this like here's a low to this high if price your chases down to a range Between this low and this high that's basic price retracements this is higher class different level type Fibonacci stuff and again I didn't learn it anywhere except for in the charts just you're just referencing the mid levels the 50 levels 100 levels okay it's applicable with the institutional levels as well but when it's traded like this application I use really
just the full figure and mid figure levels okay because if the order block is like this And it's around that 50 level I'm going to be hunting a setup similar to this okay this is again a pair I don't trade but you can still utilize this this application of any pair of your choice but again because I know this probably won over a lot of your heads and I don't mean it to be you know a braggart but yeah we're gonna go through the process one more time and explain what again I'm doing price is
trading around into an Area where an order block on a higher level time frame suggests that we may see a bounce okay we are trading near mid figure level okay and the range on the for our order block suggests that price may dip down into at least that 94 55 and below it now if it's gonna go there it very well may go to the 94 50 level it doesn't have to okay in fact I'd rather see it not do it okay and that's that's what this pattern hinges on okay so what we do is
again once we Anchor an area where we can I clear that down if I need to do a hard line here I just use this because it's cleaner compared to the two lines we already had on the chart but you just take your little crosshairs on the little marker here you anchor it there you pull it up to the highest high traded during that consolidation okay and it's price price trades down into it it'll reach into this range okay and I know it sounds like voodoo okay but I'm gonna tell you Right now I have
blown people away with this pattern over and over and over again and once you identify how to use it it's it's crazy it's it's insane how very very accurate is and it's nowhere in any books it's nowhere in any video courses I wish I could just simply say hey look here's another reference source you can go to and study it but it's really just you need to ICT so again it's one of those things where you know whether you like it or don't like it you Know the bottom line is is I use it it
works it's it's it's a pattern that I I trade all the time it's again it's a hidden optimal trade entry and it's based upon using support resistance levels as your anchor points okay not necessarily a key swing higher low an anchor point referenced around price levels itself at being the mid figure in this case or a big figure okay so now let's move on and take a look at okay we are at the second of the four our order Block potential areas on that Canadian Japanese yen pair okay and we have this range here we
have price bouncing off it initially rallying up and then starting to come back down now again you could do a few things here you could use your basic optimal trade energy which is pulling a low to a high and if price trades down to these levels in here okay 9350 is a good area in here because it's around that big sorry mid figure level okay But draw your attention back to that for our order block okay this this level here is 9337 okay 9337 where is that in terms of institutional levels and big figures and
mid figures okay notice that we have the mid figure up here okay so if I use that reference point okay we have that now if you draw defib with that point like we just did on the previous example this is what you arrive at okay I mean it belongs okay so I'm finding the range between the mid figure 9350 in this high okay so you have 93 66 and 93 59 which is essentially 93-60 round number okay which is it's possible I mean it's it's possible you may see a little bounce in here okay but
is it near the order block no okay so I would reference really let's take this fit off okay you can go down to the 9320 level okay because there's your institutional level now we're going to use an application of the optimal trade entry based on the psychological level or Institutional I would like to use the 20 level okay hit novel trade entry again using the range between that level again we don't know if it's going to trade down to that level in fact we're hoping that it doesn't but we have a range of satellites at
tracing level comes in at 93 36 with a range to 93 48 so anywhere in here once we trade down to that level again this was this is fairly handsome I mean though there was an opportunity in here to be a buyer Okay between 93 48 and 93 35 okay if price trades right down there that would constitute enough for me to take a buy signal okay price trades down deviates the sentence at tray something just a little bit in here okay and or alleys on up finally breaks through the old market structure hi in
here you can see it trades on up to our previous levels we had noted on the earlier example and then finally through it and then today It's monkeying around finding support it let's go back to this point here okay can I want to show you how even if you were not using the institutional levels okay and you were gonna reference say the big figure in this example we're going to pull down to the 93 figure okay and we're going to grab that 100 level and we're going to anchor it right to that now we're doing
is again we're looking at the range between the highest high here as its dipping down into that Order block we don't expect that the kids 9300 because the order blocks up here okay but we also have price coming right down into and it's a little difficult to see let me take this horizontal line off we already know what that is anyway so taking an office should not be a full confusion for you the price comes right into that 62 percent adjacent level okay and it turns on a dime and you get that same turn so
either-or would have been applicable for You here and it would have give you a dynamite entry point where you've really zeroed in much in the same way a sniper does with his scope these zooms anything and gets the the kill shot here now again assuming that you don't have this under your belt yet okay assume you don't have that and it's it's nothing that you need to be ashamed of if you don't have it yet because it's gonna take a little time for you to trust this okay so again you're gonna have to do This
on a daily basis go through your charts every single day don't know the five-minute chart 15-minute chart hourly chart and look at how price is trading around these big figures institutional levels okay and you're looking for price within that range from those levels to where price is traded at its highest hi and Lois hello in the same example so we just showed here now let's look at how price could be utilized its get this fit off I'm going to show you how you can use it here in the same capacity we're gonna highlight the 50
level here let's put that over here I can see it okay right in here and there's how we have price rally up down here if you take your fit again anchor it right on that level and you're going to pull it up to the highest high here if price retraces down into that 79 to 62% race on level right in here because we're moving out of the Oder block this would be an opportunity For you to get in sync with the market move and catch you know the underlying trend of the marketplace using that same
premise and the idea is we moved away from the 50 here okay and we made a high okay we're above that big mid figure level price should not come back down to that level but we have a range between the 50 and the highest high here as price dips down into that right there's an opportunity to be a buyer and get in sync with the overall existing trend Okay see that okay we look at the Australian dollar and Japanese yen continuing with the theme of looking at pairs that are outside of the ICT normal spectrum
okay and that considered an exotic pair if you will this trade in here is one I took on a live account you can see the results of that on Twitter and you can find the link on the YouTube channel where it shows the results of it and this price swing here I tweeted asking Everyone that were interested that if they would study this you could see where we were moving back into an anticipated level of for our I'm sorry for our potential order block institutional so as price moved lower shave you right into that area
right here okay now we have this price swing here and retracement so if you take the range from here this low to this high see price right here to 7/9 at a certain level and we dipped it right inside that Existing water block so we have a range between 9123 and 90 127 and here's a little difficult to see I move it a little bit you can see that's the number was that so we're talking about an area in terms of four pips okay variance so this point here and here it's about five pips difference
so buying really at the 79th additional plus to spread okay we are still within very handsome we're only talking about 14 pips okay so Your trade should be allowing you at least 14 pips you know movement but that's for another video we're going to get to in terms of stop losses and such but catching along in here okay price rallies on up starts to move higher okay and then we have another area okay just keep a reference point at this point here right there and probably make it bigger all right so this is our reference
point for the entry okay on a longer term Price swing so moving moving higher we have another order block okay because we have a consolidation in here okay we have this candle right there this whole candle so we're gonna look at that area okay and we're gonna reference this little segment in price okay and we're going to use the high end of it as our beginning point and we're not going to buffer the lower end but we're going to be very sensitive at 90 158 which is essentially what level guys 91 60 Okay so again
price maneuvers around a little bit trading continuously higher trades right down into that level okay see that swims right down into that now traders watching this that are not familiar with price action and institutional order flow and how prices move within specific define ranges they will be pretty much scared out of mind they would never even consider looking at that as a buying opportunity okay but let's go back over And look at some of the essential tenants that we use in our concepts we have a range low here to here okay so we're trading with
a fulfilled range premise in mind okay so we have an area of 90 159 with it 91 58 okay so we have one pip variance do you think that's a confluence of support/resistance ideas suggested right there sure okay so we could be a buyer right in here okay at that level plus just spread in terms if you want to be using A pending order for the limit but let's reference let's get that off we don't need it let's reference our previous example okay where we used the support and resistance idea and the Fibonacci concepts for
hidden optimal trade entry okay so we have price rallying up here okay and we have the 50 level which is down here and we have what institutional level below that the 20 okay so we're going to look at two reference points There so we're just gonna be building upon our understanding of how to find the range okay we have 90 120 and 9150 okay so we're gonna use our fib we're gonna start with the lowest one here just to give you an idea to the highest high prior to it okay and you can see how
the 62% tracing level calls for 91 55 okay so if you're buying with three pips I'm sorry not three pip set a for pip spread on the Aussie yen you can catch it along in here if you were Utilizing the 91 50 level okay they're calling for 90 163 is your setting on sanitation level and your sweet spot comes in a ninety 168 in here okay so anywhere in here would be a nice buy and assume for a moment you use that one and you're just looking for the sweet spot at your actual entry point
to this old low we're looking at twenty three pips okay twenty three pips risk with the understanding and expectation that price Should not go down to that point if it does it's probably not a good trade you won't be confused if it does and stops you out though okay so you understand that if price goes to this low the overall market structure that is implied here is being bullish isn't so bullish then you'll probably see weaker prices but in this case we're building a premise that this is an area expected buying opportunity with the actual
release and price here okay again public Traders don't make price move like this okay this is only gonna be done by institutional trader so they're gonna drive it up like that price monkeys around and again this is a fifteen minute time frame so you can utilize a smaller five minute basis take this off okay so you can have price bouncing here if you drill down to a five-minute chart you can actually see that same event unfolding right here okay with an optimal trade entry which we're not Going to go down to a five-minute chart because
again these videos are getting larger by the time I'm done I end up with a you know a huge you can see it goes right down to that dip so nice and tradesmen level okay now now let's zoom in III want to I want to give you that is an example right in here this is that same little consolidation we just worked with in let's use our reference point 91 50 again Okay numerous is an unfulfilled range application okay so we have 250 level put a fiddle in that anchor it pull it up the highest
high that we're seeing a retracement of thin okay and then as price comes back down 90 160 level plus the four pips spread that would be an area to do a buyer which would be up in here and you can see price did in fact move up from there again just giving you additional opportunities to see this in effect and again this is a smaller Little you look at a five-minute chart you can actually see the order flow and order block in here but just candle prior to move up it moved back into that same
feeling here prior to moving higher much in the same way it did here we have this bearish candle prior to move out go into a five minutes on your you can see out price move back into that order block here and moved higher okay and zoom out let's go back to our reference points of entry we have this one here And this one here okay and now we have another opportunity to see another optimal trade entry here using this range as we move this over so you can see a little bit clearer okay we have
the low here trading back down now its price moved off that that larger order block level price is starting to retrace would we expect it to come back down to there obviously in an ideal world we Don't want to see that happening so what we have we have a defined range the range being this high noted here and the low right there 91 58 sorry 91 56 I'm using the actual candle low so we have a range between these two price points as price rally's away from that order block level and it starts to retrace
we don't want to really see it coming back down here can it sure can okay but ideally you want to be hunting a price pattern in here to get along with that premise In mind looking for higher prices to ensue and you see that happening here okay again same premise in mind we have higher prices expected we have an understanding of institutional order flow we're going to hunt to opportunities in here we have this level right here 9211 prices rallying up starts to retrace okay you just do overall bullish so what are you looking for
we chase them back down to 62 to 7 I Sent Racing leveling you get that right here okay and if you use our unfulfilled range concepts here we expect price not to come back down to the institutional level price the trades rate to what level to sweet spot boom and realize up so both are ideally suggesting that's a buy area anywhere between that 92 45 90 to 40 level so add your spread to it and I'd be an entry point and then price begins to move on up even even this This example here or any
look at here in a second did stuff off the chart we have another small even again this is a 15-minute sharp but if you go down to a five minutes right you'll see this is another order block okay so as price moves down into that level here let's use our here's our low and I arranged hi okay instead of essentially a hundred pip move between the two points if we use the low to high price comes right Down into that 62% recent level and what does it do returns back higher now ultimately going into the
weekend we had a rather large weekend gap but in here just in here alone on Friday and I'm talking about Friday prior to this recording you have an opportunity to see if range in terms of pips of fifty four pips comfortably pulling out obviously a 25 to 30 pips not without the realm of possibility okay so you can see just in one pair and It's got a 30 minute chart you can see do overall price action and actually go into a 15 minutes read a little bit a little bit cleaner there's the overall price structure
what's happened okay and there was Friday's weekly hi and here's Monday's low on the week Tuesday giving you opportunities to trade and because this is a yen pair and it's an Aussie yen pair it it really will be looking to make its higher lows during the asian session okay and if you look At the asian session one this week we have this area here where price was making its low for Tuesday Indonesian session the low on Wednesday was formed during the asian session and the low was formed one this this particular day comes in at
the asian session as well okay so again it's understanding your your pair personalities and what characteristics go along with those particular pairs and what what that animal does during the trading 24 hour Period that we like to call the Forex day because these are countries that are operating in their business around those times of the day at the beginning of their financial day so it's important that they see city or particular market moves and obviously signalling the significant highs and lows is is one of the central characteristics to those pairs much in the same way
we see the british pound and euro form its daily higher low on a daily range during the London session because that's generally when they're coming online okay so hopefully these examples have been useful to you go over them study them and obviously use the same premise and studying your charts on a live basis and you know I promise you put two three months in to starch chart study using these concepts you're gonna start seeing as a whole different world of you know price action that's available to you and that's Really found nowhere else it's an
ICT exclusive and I hope it's been a blessing to you as it was for almost two decades for me alright guys every single Forex trader out there once the see their trade become profitable but before that can happen you need to understand what it requires of you as a trader to learn to anticipate price moves it's one thing to expect to make money and it's all Together something else to expect to be accurate with your analysis and one of the hardest things and I mean this sincerely one of the hardest things for me as a
trader is the profit taking okay because I've been doing this for almost twenty years and my analysis concepts are very very strong but the human element behind them sometimes I want to over trade the tools because if either a hunch or a gut feeling and it's something that I have to suppress as a Trader because sometimes I think I'm smarter than my tools and that's where my ego comes in okay so I've had to really you know hammer out a an application of when do I take profits now early on much like every other trader
if you go into this business and you encounter immediate profitability whether it be short term or enemy determined long term success in terms of duration that's not the point the point is if you go into it you start making Money the premise is that you're always going to be making money and your trades are therefore going to be profitable and especially if you get these extrapolated profits okay really big targets it kind of lulls you into thinking that that's the norm okay and what will happen is as many times if your tools suggest it's going
to be 80 pip run-up you're gonna hold for 80 pips or maybe even 82 or you three trying to squeeze that last bit of juice out of that lemon I have done that Many many a time and I've watched my really good trades turn into mediocre trades to breakeven trades and in the beginning of trading aisles I've actually watched and go into net losses severely net losses okay because much like anyone else I was you prone to the same pitfalls everyone else has encountered in trading and I didn't have any kind of mentors until Larry
Williams so I I kind of like fumbled around in the markets until I You know I got with someone that I knew a little bit of technical analysis I think everyone would agree that technical analysis and Larry Williams go hand in hand so that was like my foundation and I realized that you know I could be right on a lot of the market moves but I would be wrong at my profitable exits because I would be greedy and hold on to the absolute highest point and it's my goal in this episode is really to communicate
this as Best I possibly can as you do not need every piece of that move okay you don't need every pip in every swing you need to need pips okay and I don't want to really define it for anyone but you just need pips okay and I'll give you some ideas on how to frame that what is your objective well it depends on what type of trader you're going to be this series is designed for getting that one shot one kill for the week okay that means you're looking for an really Cheery opportunity to be
trading one time for the entire week okay because if you can't do that you're not gonna be able to handle yourself trading every single day as a day trader because you're gonna be doing things you know before you should you're gonna be buying more selling more than you should you can be doing everything wrong okay because you haven't developed the discipline that's necessary for you to be able to adhere to a set of rules And yes there are rules of engagement that you have to have as a trader okay this whole trading series is themed
around the military aspect and I purposely chose that because that's what I had to do to myself because it's one thing for me to make these videos and the majority of everyone out there thinks that I'm this you know cold calculated market wizard okay and I never make mistakes I make mistakes okay my presentations are geared You as a learning tool to avoid many of the things that I did early in my treating and some of the things I still have to deal with on a daily basis as a trader and that one particular thing
is profits if you do not have a predetermined exit point before you even get in the trade I promise you you will be plagued with this problem and it may sound like a good problem to have when to get out with profits but I'm gonna tell you if you have them in trading Long those of you have been trading for a while know exactly what I'm talking about your winning trades if you exit them and they continue to move 6070 200 pips more than you got out at are you right chances are you going to
define your trade as not right profitable yes but you're not right so you're going to wrestle with that idea okay you're gonna argue with it thinking hey you know I didn't do something right I could have made a lot more pips instead of the Saying you know what I saw an opportunity I executed I followed my plan and I exited at a predetermined level there should be no shame in that zero shaming but many of you will still arm-wrestle yourself beat yourself up saying man I was shot at if I would held on that that
would have paid for the 16 losing trades I had last two months look you have to be disciplined you absolutely have to have that in your Repertoire in your game plan and your trading plan you have to have it because if you don't have it I can tell you as almost a two-decade veteran in trading that is one of the most hardest things for traders to overcome I could be wildly profitable but I don't have it right every single time and it's the times that I hold on for that 75 pip move when I'm already
banked you know 60 pips in the first half of the trade and I'm holding out for 75 for my second Target or my final collapsing of the open position I may be seeing maybe two spread just before it gets me out and I'll hold on to that thinking that I'm gonna get that trade then it comes back and knocks me about you know at 60 pips for the remaining four there's nothing wrong with that but internally I wrestle with that thinking I should have just collapsed it when I you know had 60 pips together and
now I'm armwrestling myself internally you Know I'll be driving down the road going to the store or going to the movies or you go into a red box to get a DVD for the night and these things plague me okay because I have OCD I I completely understand assess of compulsive disorder I live it okay so if you don't have that if you trade long enough you might develop it okay because what'll happen is you're gonna overanalyze like everything you do and that's a good thing as a learning Tool okay but once you really adopt
an idea what you should be doing as a trading plan you don't really want to overanalyze it you want to stay within those parameters okay and that starts with number one having an idea of where you're gonna get out at when the trades moved in your favor okay that's not a limitation do not view exiting a trade at 60 pips profit predetermined before you even put the trade on and it moves 90 pips or on a pips beyond that okay do Not view that as weakness okay do not because I'm gonna tell you right now
if you do that every single week or three times a month you are in the upper five percent of forex traders because 90% of them don't make money they aren't consistent they can't even find the right time to get in the trades okay and I don't mean that for some of you are watching this I'm not trying to beat you up and make you feel silly or or you know uneducated okay I'm just Trying to illustrate the point that you need to change your thought process about taking profits okay before you even start implementing these
tools because if you don't give yourself too permission to have a predetermined exit point and be content with that you can slowly develop into bigger longer-term profit objectives okay but for now let's just deal with this head-on and understand that whatever profit opportunities you have predetermined in Your trading plan those are what you're sticking to come hell or high water that's going to do okay and then obviously you can tweak it later on that builds upon sound information and ideas and build a premise around but until we get to that point we have to have
a foundation and this is a very very strong foundation this is one of the things that either instill my own trading and I made a huge impact in my overall profitability and Consistency so now let's talk about price swings because obviously without understanding what you're dealing with on a price level scale you're not going to understand where profits should be taken now if you're looking at this crude diagram I agree okay but it's going to accomplish the method nonetheless we have a small little minor price one here we have eight enemy at term price swinging
and maybe even a longer term price swing okay now it's Not really important as that what time frame this is because it's Universal it's applicable on all time frames but we're going to say for instance that this is possibly a five-minute chart okay and this is the beginning of a new day you've been hunted a set up and maybe this is going into the London kill zone and you've expected some level of support down here okay and you have to apologize to apologize and up ahead of This because I'm not going to be spending a
lot of time dressing us up with a lot of lipstick as I did the previous ones because quite frankly I'm spending a lot of time on these videos and even though you're getting the playback of about two hours and such it's taking me about nine hours to produce these things so I'm trying to keep it short and sweet and even though it's not going to be that short and sweet on the viewing side of it but Assuming there's some kind of support level or premise that you think this is going to go higher okay we're
not dealing with the entry points here we're dealing with targeting assuming that you get in here on a minor pullback okay and something set up this opportunity is a Buy okay and where do we anticipate the upside objectives okay well first you gotta know I'm just understand that there are price swings within price Swings within price swings okay this price swing here is about 50% of this range from high to low this price swing here okay is equal to this price swing but retraces back within 50% range of this okay so there's a rule here
that you have to understand in targeting that means asymmetrical price swing okay a symmetrical price swing is basically something like this this move up here when this low assuming this is a low if it breaks right here we Should see a equal move from this low to this highest high okay this becomes a fulcrum point okay or a pivot point not pivot point like s1 s2 type pivots I'm talking about a pivot point in such a way where when price breaks that you'll see it move lower in other words just like a hinge right here
price swung up once it broke that low you just see an equal move from this low to this high in terms of range equal from this low lower and you see that Here okay that same thing can be developed on and moved in degree once this high is broken and you see that here now inside this price move here assuming this is a price rally it's a straight line but obviously we know prices and always moving in a straight line there's other price swings within here but the overall what I'm trying to draw your eye
to is this overall price swing lower in this price swing from high to low there may be two Three maybe four even multiple smaller price swings within it prior to attorney and going up you know to the targets you're hunting this high if it's broken this is a fulcrum point on the bullish side so as price rallies up okay we're going to talk about multiple targeting and all that stuff at another video but in here as price breaks that point right here on this high when it takes that out we should see this move from
this high to this low equal and in terms of Magnitude and distance and price add that to this high and you'll see it equal so in other words if you took a line here and measured it with a ruler of such you should see basically the same distance from this high here to this low added to this high up and you get this area here that's what that's the first fundamental premise to understanding how to take profits okay then we're looking at a bullish scenario here but if you cannot understand this Okay it's gonna be
very difficult for you to understand where you should be taking profits okay because if you understand this crude overall concept of price swings okay if you understand that targeting and systematically taking it at predetermined levels is going to be very easy for you if you cannot see that here okay it's gonna be a little bit easier to see when I have it on charts but it's in its paramount you have to understand this because There is a 50% rule in symmetrical price action and it's basically measured moves this high to low once broken here you'll
get a mushroom move higher okay let's take another closer look as to what I'm referring to okay when you have a retracement you have a price route here so this is an impulse move up and you have a retracement into this range from that low to high this could be any number of things this could be a higher level Support line it could be a a pivot or a fib okay it could be an order block a lot of different things could you substantiate this as a support level but the main thing is is you
want to be looking at obviously when price moves beyond this level here you want to see a equal move from this high to low added to this high price point up okay again that's the same premise we just talked about on the previous slide but now we're gonna take it a little bit further When you understand how to use Fibonacci okay Fibonacci to get retracements you would anchor the price point low here to this high okay so those are your two reference points for retracements on an up move you're going to pull your fib from
a low to a high and what that will do is it'll plot within the range of that low and high all of the retracement levels so this may be a 50 this may be a sixty to seventy nine such so something Down here would be an optimal straight entry now as price moves up once we take out this high it does not it does not guarantee that you'll get a 200% equal move from this high to this low once it's broken right here there's no guarantee it's going to go a hundred percent of whatever that
range is okay it's not it's not it's no guarantee that okay but there is a very large probability if you calculate the range from this high to this low let's assume For a moment that that's a 100 pips okay 100 pips if price breaks that high as it does here in this example it's a gun obviously this as a hand-drawn illustration is not a price action chart but as price blows out this high when it does that if you take the range from here to here again that being a hundred pips assuming if you see
from the low here 127 pips up price has a high probability of moving to that price point okay if You go a hundred and sixty two pips from that low up here 162 pips you have a high probability of seeing that price move as well now where did I get those numbers from some of you guys don't understand fit or not - you're saying well that's pretty stupid you know I'll be obviously so there 127 150 two extensions right but some of you aren't privy as to what I'm referring to them we're going to learn
that now if you take your fib and reverse its Application okay and I'm going to show you later on how to calibrate your mt4 Fibonacci tool but if you take the fib and you anchor it from the high here and you draw down to the low here what that's going to do is it's going to plot a one point two seven and a one point six two line okay and when price blows out this high when it reaches those levels they are very very very good levels to take profits at they're easily determined they're Predetermined
there's no ambiguity about it you'll know exactly what you're looking for price wise and you can place your limit orders at those levels to get out at okay but obviously when we get to live examples in the charts you'll see much more clearly what I'm referring to okay let's assume for a moment that we're looking at a price move it suggests this is going to go higher and price has had an impulse move up and now we're retracing within that range the Range being this low and this high something down here constitutes a order block
maybe or an optimal trade entry something to support an idea that this is going to go higher or assuming it's going to go higher what'll happen is you'll see hopefully price move in your favor okay and by pulling your fifth from this level here to this level here you can get your 127 and 162 extensions and still anticipate if you're in a higher higher thing for a directional Premise you can anticipate a 200% price projection okay which is thus high down to this low that range add that range to this high and you'll get that
high up here okay that's the ultimate price level that you're looking for that's the furthest it's going to go now will it go beyond that sometimes sure okay many times it'll it'll do that but overall if you look at 127 162 and 200 as your extensions they are ideal optimal exit points for your trades that Are easily discernible and there's no ambiguity whatsoever because this wave lower is when it shoots higher okay I probably should have said wave because I don't want you guys thinking I'm Elliott Wave fan because I am NOT okay but this
price swing rather I mean this price swing starts a complete move higher we know that this market structure high once it's broken out we can have one 27 152 and 200 extensions predetermined based on this range here with de Premises it's going higher off that retracement okay as price moves lower into a deeper retracement of this impulse move so we have this again this retracement lower within this range here okay it could go deeper yes okay could you retrace deeper but we're just gonna use this idea here as support resistance and with this likelihood of
this being support price could again move higher and if we do assume that this is a Buying opportunity okay maybe there's an order block over here there's a consolidation within this leg up something constitutes a buy opportunity in here if we buy here we have a predetermined old high here and in the range here assume that's for the sake of argument again say it's 100 pips we could take our anticipatory skills and expect the see price try to retest this high and if it blows through that we could reasonably expect to see the 127 Or
127 pips from this low once it starts to turn off or the 162 extension which is 162 pips from that low okay in this example again assuming that this is a hundred pip retracement obviously your Fibonacci tool would give you all the calculations I'm just giving it without the benefit of having a Fibonacci application on this diagram so you'd be able to see when price takes this high out 127 and 162 extensions respectively would be your upside objectives okay so They're the predetermined levels to exit at okay so every time you trade within a price
swing you could derive at in advance where your exit points are going to be know them beforehand so you can use a limit order and you can really pretty much go to sleep okay you can go to work if you have your job if it's the longest session if you can get yourself up out of bed for a little while set the orders up once you get into a trade you know you if first for instance let's Assume this is a long and open and you're trying to be long okay you can put your limiters
here and can't go to bed and hopefully some time in London close or New York session we could see those objectives fulfilled okay and that's just one application or anticipatory example okay obviously the same thing could be said on the downside understanding if there is something up here that constitutes a selling opportunity Something bearish okay and we're not going to build the context that's what that would be we'll have all kinds of opportunities to understand what that is in this series so assuming that is the case when you're when your market breaks lower okay what
in this price swing is your point of reference okay if you're bearish the overall price structures you should be looking for obviously individual price swings yes okay so in other words this swing here trade it up Whatever this range from here the here is it's the retracement into so they could be a selling opportunity here but if you take the range between this high to this low 127 percent I'm sorry one point two seven in the Fibonacci but 127 percent of that if you multiplied it that would give you a lower objective here and 162
percent of that range would give you the 162 extension down here as well same thing here we have this high in this low that range of pips once this Low is violated as it is here in this example we could look at the range from this low to this high okay we could see the 127 extension and 162 extension its downside objectives okay I should have said this in the previous mentioning but the intermediate term swing between the smaller swings okay think back in market structure now this would be the the higher level price swing
okay or major reference point the intermediate term reference points many Times if you see price take this leg here if you project your your Fibonacci based on that that range you'll get the 127 here and then 162 many times you'll get a intermediate term deeper retracement from the high that forms back okay that's the originally a sell you'll get a retracement ooh that range and then you'll see the fulfillment of this swings targeting which is 127 162 which hopefully would arrive down here and conceptually speaking but everything That I said and when the bullish side
obviously if you flip it and you can get the converse idea for the Bears okay and again much in the same capacity what we mentioned it earlier everything that you see when price swings if this is a move lower you're looking for a selling opportunity here this range if you pull your fib from the low to this high it'll project on your when your Fibonacci the 127 and 162 extensions down in that area is where you'd be looking to hunt them About 75 to 80 percent of your exit points if you feel absolutely certain okay
that you're going to see a 200% extension in other words whatever this range is from high to low if you're looking for a downswing when this low is taken out whatever that range is it's the duplicated and you'll see that same magnitude wave lower or swing low rather which is basically taking this low to this high and if you had it in your own Fibonacci's it would be a 200% extension But I'm trying to avoid conditioning you to expect that all the time okay I'm conditioning you really to expect 127 162 extensions because they are
very very consistent and you pretty much you know gonna be rewarded more consistently with that then you will get to 200% again same thing we have a premise that this is a bearish market movie of a bearish impulse move lower we have a retracement within that move something that's implying a selling Situations on their way the range from this low to this high is used with your fehb you see we used to fit from the low up to this high and it's gonna project your Fibonacci extension 127 and 162 yeah 162 and once it gets
to those levels many times you'll see a retracement unfold and the impulse move lower here has a retracement assuming that this low is significant in market structure something could be in line with the Another order block here within this range again these are not just straight market moves there's all smaller price swings within this leg in price so you have to reference those as well like we did in previous market videos in this series when in this range here is calculated again pulling a fib from the low up to the high ok it's going to
give you 127 and once to two extensions okay when you're fibbing on Seto and that is where you would have your predetermine Exit points couple examples real quick with the Fibonacci 127 and 162 extensions we're looking at the fiber here we mentioned this earlier in this video where the order blocks were and just for a simple quick review again this is assuming that you understand this premise we have this rally up comes right back down in this order block right here and again framing the idea that this is bullish so therefore when price returns back
Into this area we could recently expect to see a rally up and this is where we see our entry point right in here inside the optimal trade entry between 62 and 70 lime set and tracing blows and that's probably alleys up okay before we even see it go beyond this point here what you're doing is you're looking for your upside objectives okay and because we're looking for upside objectives you start with the high and You pull your fib down to the lowest low here okay and here's your 127 and your 162 extension okay and you
can see that happened to be fulfilled you get your 127 here and not too much longer after that you get your 127 right there okay and we have another order block here as price rallies up you want to go borrow this level here okay price rallies up it comes back down into the order block using the range here's two low to the high your entry Point is in here okay and again looking for upside objectives you would reverse your fib from the high down to the low here's your 127 extension and your 162 up here
you can see it hits it all right there okay and we have another order block right here price realities from this low up to this high we're not going to draw the FIB and here optimal trade entry the high down to the low okay here's your 127 hits it handsomely and is your 162 Extension right there okay so you have multiple examples on a pair that we have been utilizing for this series but obviously it's applicable to any pair okay and it wouldn't be fair unless we did some downside objectives but I got to go
to a different pair to do that so let's take a look at the downside objectives utilizing the 127 and 132 extensions okay we're looking at the Japanese yen dollar versus the Japanese yen rather okay we have a high Price trades down retraces and moves lower as we anticipate a selling opportunity and we're going to say for sake of argument that we suspected that price would be a sign opportunity in here okay way we get our downside objectives is to find the low up and the impulse move here or retracement rather from this range here this
is every tradesmen in to the impulse move three retrace and then here's your 127 which it gaps through then here's your 162 Extension it trades just a little bit beyond that before it bounces again again we are not advocating trying to trade outside of the 162 and 127 use those as your guidelines we have a price move lower or impulse move lower and we have a retracement okay again same thing here assuming this is the range high to low optimal trade entry in here you could be a seller here where would our objectives being well
here's that fulcrum point okay remember this is the Pivot point when it breaks below that we should see this move move lower okay the highest level would be 200% extension or double the range from this low to this high broken from this low here down okay but sticking to the rules okay you're gonna be utilizing this swing up and you're gonna be looking for the 127 and 162 extensions as your objectives lower so if you're a seller here you'd look to take profits add to 127 down here and then 162 down here and scroll over
here a little bit more you can see this is where the price moved it went down let's see on that price point too low it only moves 17 pips beyond what the 162 extension is and then ultimately price return all the way back up to the area where you were sold so you can see if you were looking for 200 cent extension down here you would have gave up a really really handsome opportunity to be covering your short in Reversing and just one more example on a short term we have a impulse move here retracement
okay find the low up to the high highest point right there and you're 127 and then you're 162 extension almost kneeling the the very low of the move and then obviously you can see the price of the market moved higher okay there are another opportunity of catching the upside here you see this price move here okay if you anticipate this as a buying opportunity okay this Is your reference point on a price swing member that first slide we talked about finding the upside objectives here is your fib pull it down to the low and in
here's your 127 and we just fell short of that wants you to sue here and we just might get that on in the coming days or it could be just coming up to fill this gap we don't know but on the upside this could be a very favorable target for very little short-term to intermediate term trade on The yen so hopefully it's been useful and you guys can glean some insight from it [Music] [Applause] [Music] you [Music]