As markets move, they leave behind what's called imbalances. One of the most popular being fair value gaps. But if you've ever traded them, you know the problem.
On any single time frame, there are tons of gaps forming, creating noise and confusion. The key is focusing on the one high time frame fair value gap that really matters. And this indicator makes that effortless.
It gives you a completely new way to visualize FVGs unlike anything you've seen before. Let's break it down. Fair value gaps are a powerful way to spot market imbalances, but on most indicators, they overwhelm you with information, plotting every gap on every time frame.
That's not helpful. This indicator solves that. Instead of cluttering your chart, it zeros in on the single most relevant high time frame fair value gap, the one that's most likely to act as a magnet for price.
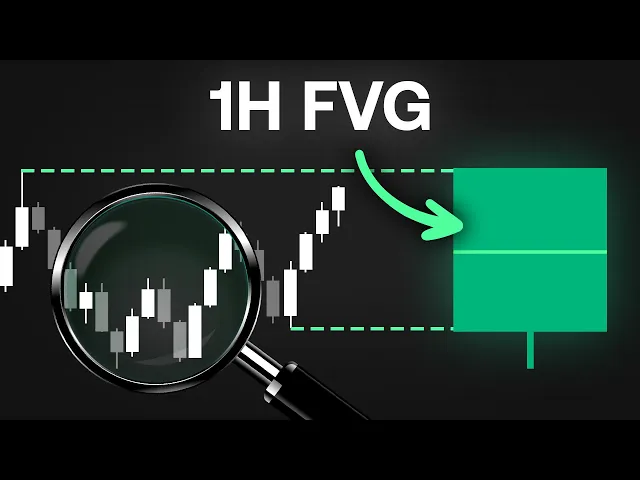
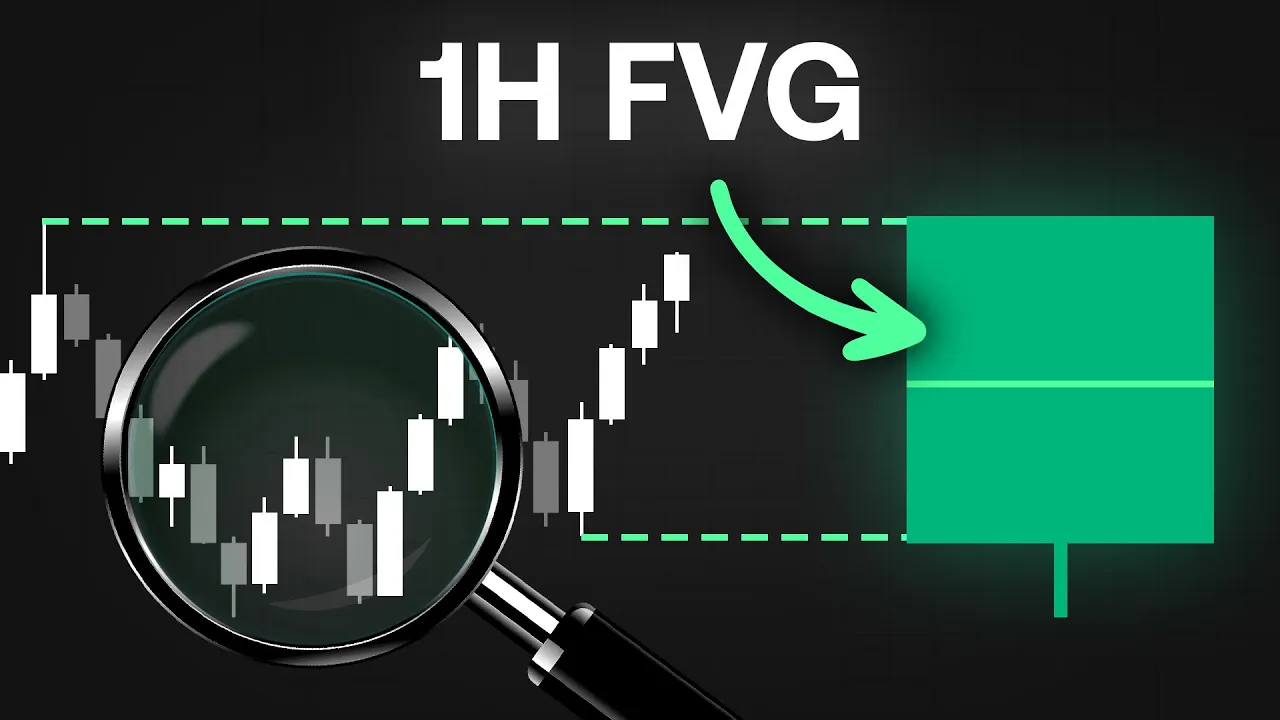
It gives traders a clean, focused perspective by stripping out the noise and letting the most important imbalance stand out clearly. When you go to add this indicator to your chart, first make sure you're on a time frame below the 4 hour. Instantly, you'll see either a red or green fair value gap plotted to the right of your price chart.
This represents the most recent fair value gap from the daily time frame. A vertical line marks the exact bar where the gap was detected, while the dashed horizontal lines extend across your chart, showing the higher time frame gaps left and right boundaries. You'll also notice a wick extending from the fair value gap box.
Fair value gaps themselves don't include wicks. So, this area simply visualizes the price dispersion since the gap was detected. Essentially, how far price has moved up or down before the gap is mitigated.
In the top right corner, a dashboard appears to let you know at a glance whether the gap is still open or has already been filled. Inside the indicator settings, you'll find a few key options. By default, the tool tracks the most recent daily fair value gap, but you can switch to any higher time frame you prefer.
You can also customize the styling, adjusting the offset to control how far the gap is drawn from current price, the width of the visualization, and of course, the colors used for detection. Now that we understand how the indicator works, the next step is to see how it can actually be used in trading and why it can be such a powerful tool for filtering out noise and focusing on the gaps that truly matter. In this example, we're looking at Meta on the 1 hour time frame.
The first thing we notice is that the market is in a clear uptrend following a strong and extended rally. Typically, when a move like this stretches too far, a pullback is likely, and that's exactly what begins to unfold. Using our price action concepts algo, we detect a bearish change of character, signaling the first signs of a potential reversal.
As expected, price begins to pull back from the highs. Now, from experience, we know that fair value gaps often act like magnets, drawing price in before a reversal. So, at this point, we activate our higher time frame fair value gap indicator and set it to the weekly time frame, anticipating a larger retracement.
Sure enough, we spot a fair value gap sitting below the current price, suggesting a potential downside target. But we don't just blindly enter trades when price reaches that level. What we need is confirmation that the market is shifting back into a bullish phase.
So, we turn on the pattern detection feature within the price action concept suite. A broadening wedge pattern appears. an inherently bullish structure.
As price begins to break out from the wedge, we also detect a new bullish structure shift. With this confluence, price entering a high time frame fair value gap, a bullish breakout pattern, and a structural shift. We have a strong case for entry.
From here, we can target the fair value gap's dispersion high, which also aligns perfectly with an order block identified by the price action concepts ALGO. This is a simple yet powerful way to combine fair value gap analysis with high probability entry signals for precision timing. It's also worth noting that just as you might use a rejection of a fair value gap on your current time frame as an entry signal, the same concept applies when using a higher time frame gap with this indicator.
In this example, we're in a clear downtrend. So, our focus is on finding short setups that align with the overall direction of the market. A new fair value gap is detected.
But unlike the previous example, this one is much smaller. There's not enough room for a full multi-step setup to form inside the gap like we saw earlier. In this scenario, a simple rejection of the fair value gap is enough.
At this stage, we're not rushing in. We wait for clear signs of rejection. Once that rejection is confirmed, we can confidently take a short position, placing stops just above the high of the fair value gap and aiming for a one two risk-to-reward setup.
It's a clean, efficient way to use higher time frame gaps without overcomplicating the entry. And that wraps up our breakdown of the higher time frame fair value gap indicator. An advanced tool that brings clarity to the chaos of market imbalances by highlighting only the most significant gaps from larger time frames.
Whether you're swing trading or day trading with higher time frame context, this indicator helps you filter out the noise and stay locked onto meaningful price levels. You can get access right now at luxalgo. com/ library.
For best results, pair it with the price action concepts toolkit. With built-in features like pattern detection, structural shifts, and change of character alerts, it gives you the full picture for timing entries, exits, and managing trades. Get access for 30 days risk-free at luxalgo.
com. Don't forget to follow us on X for daily trade setups, strategy insights, and market updates. Thanks for watching.