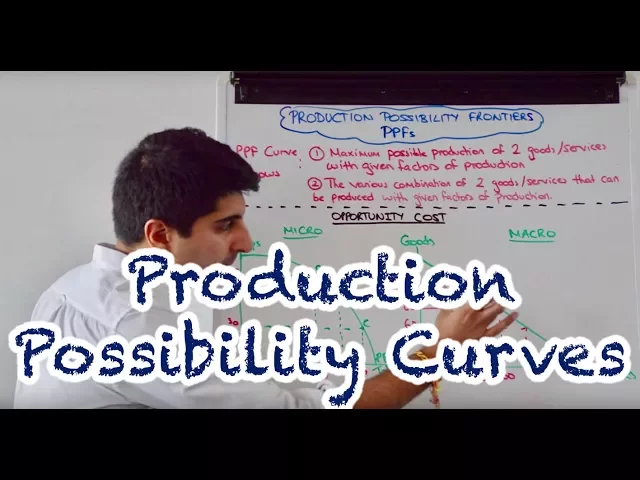
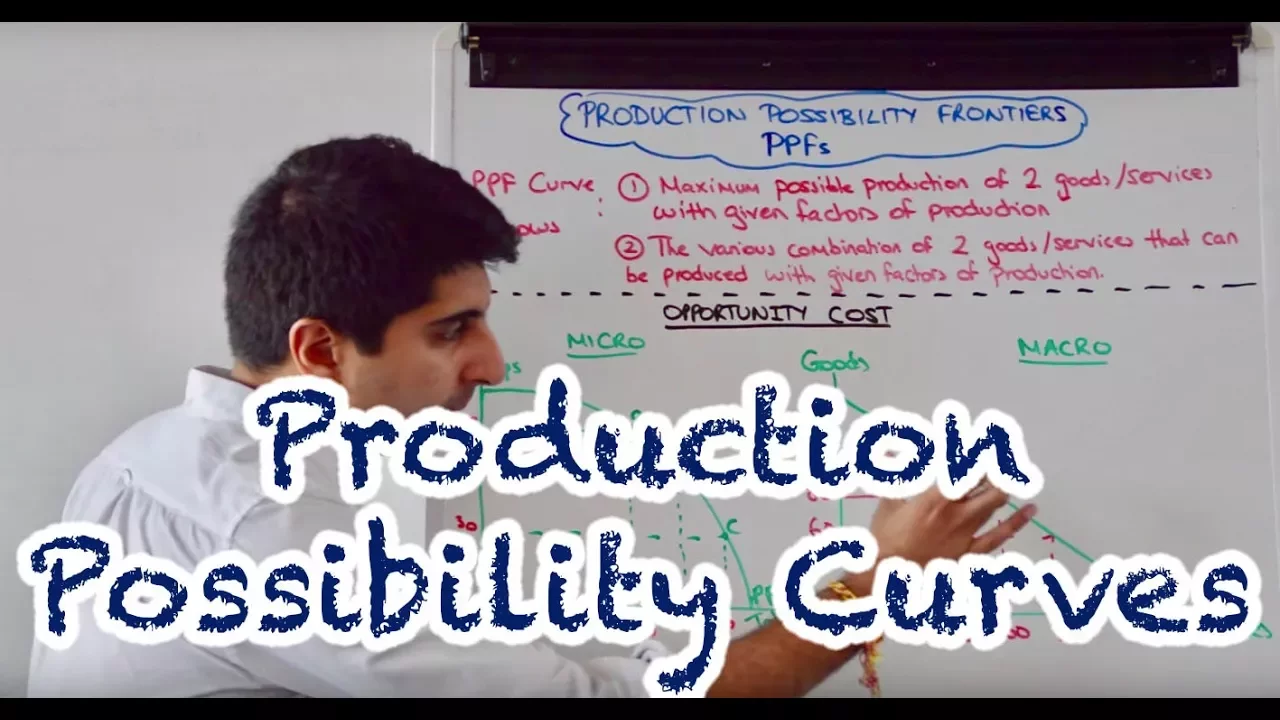
hi everybody production possibility frontiers or production possibility curves are very useful tools to illustrate the ideas of scarcity and choice in economics these curves are great because we can look at them from a micro perspective and from a macro perspective what does the curve or the frontier actually show well on a micro level it shows us two things the maximum possible production of two goods or services that can be produced with a given level of factors of production but it also tells us the curve the various combination of two goods and services that can be
produced with a given level of factors of production if we make this macro what does a macro ppf tell us well the curve tells us the maximum possible production of all goods and services that can be produced with the level of factors of production in the economy and it also tells us again the various combinations of all goods and services that can be produced with given factors of production in the economy so there you go that's what the curve actually represents the actual boundary now the beauty of these diagrams of these curves is that we
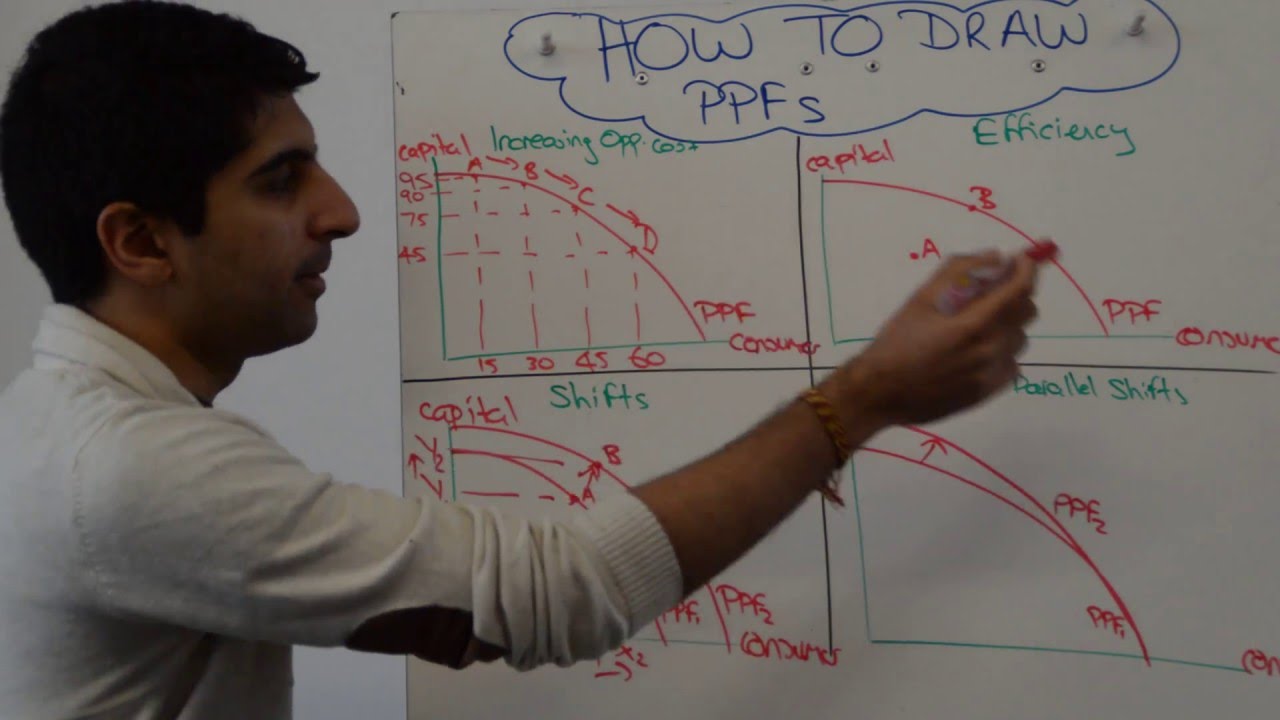
can show concepts like opportunity cost like efficiency we can understand how production can be increased of goods and services as well so let's start by looking at how we can illustrate the concept of opportunity cost on pps or ppcs well the shape of a ppf can tell us about the opportunity cost of producing goods and services let's have a look at this micro ppf how do we know it's micro well because we're looking at two specific goods in this case we're looking at a firm who can produce either laptops or tablets the curve tells us
the maximum possible production of both laptops and tablets this firm can't produce beyond the curve but it also tells us the various combinations of laptops and tablets can be produced depending on how this firm uses their factors of production so let's understand how we can look at opportunity cost from this ppf well let's say that this firm is currently producing a and that gives a combination of let's say 50 tablets and 75 laptops let's say this firm wants to specialize and produce more tablets they want to increase tablet production from 50 to 60 i reallocate
factors of production to increase tablets well you can see here that as they move from point a to point b on this ppf and they produce 10 more tablets they have to give up some laptops and let's say that they have given up 16 laptops so from 75 to 60. the opportunity cost of producing 10 more tablets from 50 to 60 is the 15 units of laptops that have been forgotten but let's say that this company this firm wants to produce 10 more tablets so to go from 60 to 70 tablets i.e to move from
point b to point c on the ppf again they are reallocating scarce resources reallocating their factors of production to suit more tablet production but can you see that they are giving up more laptops to do that let's say that they are now reduced laptop production from 60 to 30. so the same 10 unit increase in tablets has now meant a greater opportunity cost 30 units of laptops have to be given up to produce the same 10 unit increase in tablets so a ppf curve that's drawn like this concave indicates the law of increasing opportunity cost
the more that we produce of something the more of the other thing that has to be given up each time so a 10 unit increase in tablets each time means that more units of laptops have to be given up in each case that's the law of increasing opportunity cost you can see here on a micro level if we did the same exercise here on a macro ppf we would show the same thing now what differentiates a micro ppf to a macro ppf well on a macro diagram you would change the labeling on the access to
goods and services because nothing else nothing else can be produced in an economy so if we label our access like this it indicates a macro ppf the other option for macro is to go consumer goods and capital goods and that indicates we're looking at the entire economy here but again any ppf drone concave illustrates the law of increasing opportunity cost what what does that actually mean well let's go back to a micro level here it means for a business as they move towards heavy specialization in tablets it means that their factors of production are actually
more suitable towards laptop production down here on the ppf because they're increasing their production of tablets by the same amount but they're giving up more and more and more laptops by doing so that means that their factors of production down here on the curve are much more suited towards laptop production which is why when they produce more tablet tablets they're giving up significantly more laptops whereas over here on the curve you can see that to produce more laptops they have to give up more and more and more tablets that's because here factors of production are
much more suited towards tablet production than they are towards a laptop production that's the basic idea as we move further and further along the curve factors of production are more suitable towards one thing than they are towards another thing that explains why we have concave pps where we see the law of increasing opportunity cost takes place what about if we draw the ppf differently well let's have a look at my macro diagram here it doesn't matter that i've done it on my macro diagram the same concept applies even on a micro ppf but if we
draw our ppf linear downward sloping and linear like this it illustrates constant opportunity cost let's take the same 10 unit increase now in services though so 10 unit increase each time you can see that the opportunity cost the units of goods that are being given up are the same in each case 20 units from 50 to 60 services and 20 units of goods from 60 to 70 services and that will continue i went from 70 to 80 then the decrease would be from 60 to 40. the same basic concept here so a linear ppf illustrates
constant opportunity cost whereas a concave ppf represents increasing opportunity cost let's understand how we can show efficiency now on ppf's there are three types of efficiency that we can talk about when we draw ppf curves productive efficiency allocative efficiency and pareto efficiency let's look at those on a ppf diagram well you can see that i put five points on both a micro and the macro ppf let's look at points a b and c points a b and c are on the curve in each case any point on the curve is productively efficient productive efficiency in
this case simply is using up all factors of production to their maximum level so we're getting maximum production from all of the factors of production available there is no waste of them there is no unemployment of them so any point on the curve is productively efficient that's very important by definition therefore point d any point inside the curve is productively inefficient we are wasting our factors of production we're not getting maximum use of those so that would be a very inefficient point of production productive inefficiency in both cases here what does point e represent point
e is unattainable with our given factors of production this firm on a micro sense can only produce at a point on the curve they can't produce beyond the curve at point e yet with the given factors of production so a b and c productive efficiency any point on the curve is productively efficient any point within the curve inside the curve is productively inefficient where we are not maximizing the use of our factors of production we are wasting them on a macro level point d can be known as unemployment yeah so if we're not maximizing the
use of our factors of production in an economy that might mean unemployment of labor unemployment of capital so you can consider point d as unemployment on a macro level there what about allocative efficiency allocative efficiency is whether what's being produced is satisfying consumer demand the satisfying consumer wants a very very important concept given the basic economic problem we cannot tell from a ppf diagram if allocative efficiency is being met because we don't know about consumer demand so is point b here allocatively efficient is this combination of laptops and tablets being produced allocatively efficient we don't
know if this is not efficient if all that society wants all that consumers want a laptop that then is not allocatively efficient allocative efficiency would be there wouldn't it whereas if society only wanted tablets to be produced allocative efficiency would be there at my finger on the ppf so we don't know about allocative efficiency from a ppf we need to know consumer demand so that's a very important thing to remember when drawing these curves what is pareto efficiency pareto efficiency is the idea that nobody can be made better off without making somebody else worse off
any point on the ppf is pareto efficient let's take point b here because if we change point b let's say you change point b to point c we are producing more tablets but we are giving up laptops therefore we're making people who like tablets better off but we're making people who like laptops worse soft because lesser produced it's also pareto efficient because if we went the other way let's say to point a people who like laptops are better off because more is produced for people who like tablets or worse off because less tablets are produced
any point on the curve is pareto efficient because any movement away somebody is made worse off by making somebody else better off so these are the fundamental concepts of efficiencies that we can take from a ppf fantastic how about looking at how to increase production on a ppf let's look at that next there are numerous ways of showing how production can be increased on a ppf i'm going to focus on my micro example here where we have a business that can make either laptops or tablets the same concepts apply on a macro ppf as well
so let's say that this business in each case wants to increase tablet production there are three ways we can show that on a ppf let's say this business is currently operating at point d at a productively inefficient point and a pareto inefficient point here inside the curve at point d they are not maximizing the use of their factors of production there is some unemployment of them here well one thing they could do if that's what they are producing is use their factors of production better so use labor better if there's any unemployment of labor in
the business use up labor same with idle capital use it up to increase production let's say from point d to point b and therefore we get more tablets being produced so they're producing at any point inside the curve use factors of production better to increase production that's one option but let's say this business is already on the curve they're already productively efficient and pareto efficient what could they do well let's say they're at point b here what could they do well they could reallocate the use of their factors of production they could re-employ factors of
production to specialize more in tablet production so maybe they were producing i don't know 50 units of tablets at point b well to get to 70 units of tablets what could they do they could move factors of production away from producing laptops to an extent and towards producing tablets instead so reallocating factors of production let's say they were producing a point a and only 25 tablets were being produced well again they could re-allocate their factors of production towards producing more tablets maybe moving from a to b and then from b to c so they can
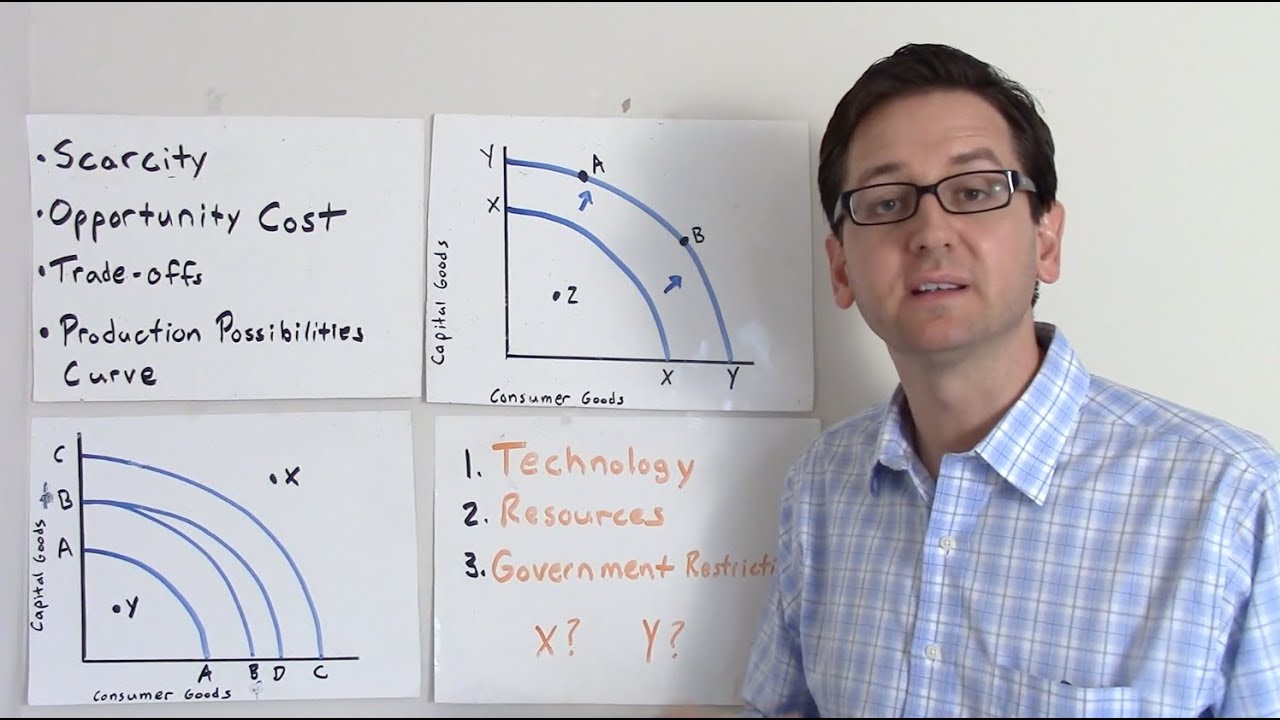
move along their ppf to favor tablet production by reallocating their factors of production so maybe moving workers away from producing laptops towards producing tablets moving machines away from producing laptops towards producing tablets another option they have is not necessarily just to move along the curve and reallocate their factors of production re-employ them but instead to try and shift the ppf curve now if they shift shifted the ppf curve they can move from point x where maybe they were producing 50 units of tablets to point y where now they can produce 70 units of tablets but
the beauty of shifting the curve is that they don't need to necessarily give up laptops to do so you can see here that a point x again let's put the same numbers maybe 50 laptops have been produced at a point y even more laptops can also be produced as well as there being more tablets being produced so how can this curve be shifted what could a business do well very simply very generically they can increase the quantity and or the quality of their factors of production the memory device here to help you just think q
square this cell the quantity and quality of our factors of production capital enterprise land and labor so a business maybe could find a way to increase either the quantity of the factors of production or the quality of their factors of production so what can this business do well they could increase the quantity of labor bring in more workers that could increase production possibilities and shift the curve from ppf1 to ppf2 they could increase the quality of their labor increase the productivity of labour how by training them up better that will increase productivity and allow workers
to produce more in a given time period they could increase the quantity of capital bring in more machinery or improve the quality of their capital maintain their machinery upgrade their machinery they could increase the quantity of land if that's an option maybe not so much for for this kind of business but if it's an agricultural related business increasing land can mean more crops can be produced so increasing the quantity and the quality of factors of production allows the ppf curve to shift which is another way in which you can show increasing production but the curve
doesn't just have to shift in this way it is possible to see a ppf curve shift like this where the curve shifts favoring only one of the goods instead of the other one so in this case the shift is favoring the production of tablets not the production of laptops and all that's happened here is that there has been a change in the quantity and or the quality of factors of production that purely suit the production of tablets so maybe it's an increase in the quantity of labor but those workers can only produce tablets they are
no good at producing laptops maybe it's an improvement in the quality of labor so the productivity of labor but only in the production of tablets maybe it's an increase in the quantity of capital but only machinery that can produce tablets or the quality of capital that can only produce tablets you get the idea so an improvement in the quantity and or the quality of factors of production which is specialized in the production in this case of tablets then you can get a shift which is not even which is not parallel it favors the production of
one good over the other one so that covers this entire topic area of ppf so you can see just how useful pps are on a micro level and a macro level in showing us so many different concepts in economics thank you so much for watching guys make sure you stay tuned for the next video