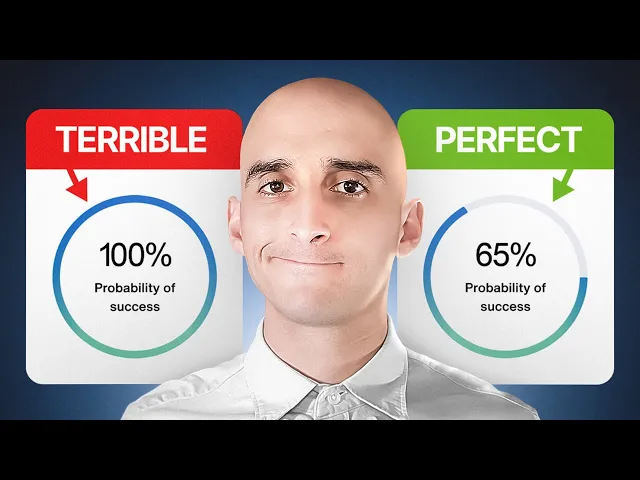
you won't like it but if you want to retire as soon as possible you need to be able to identify several harsh truths about retirement planning that catch many retirees off guard as the owner of an independent financial planning firm I've seen countless retirees struggle during their retirement because they Incorporated common but incorrect financial planning recommendations that quickly derailed their finances that's exactly why I'm making today's video so in today's video I'm going to break down some common misconceptions and explain why they're wrong and you're going to want to stick around until the end of this video because I'm going to provide practical Alternatives that you can use to protect yourself the first and most important harsh truth which is that you need a high probability of success or a high Monte Carlo score in order to have a safe retirement my experience speaking to hundreds of people who are planning for their retirement is that more often than not Monte caros scores are actually interpreted improperly and this can lead to people working far longer than they need to or to having significant more anxiety than is warranted it can feel like in order to win you need to get as close as possible to an 100% score because that's the only way to achieve Victory well it's entirely possible for someone with a 100% probability of success to have a miserable retirement and someone with a 65% probability of success to have a wonderful retirement the issue at hand is that probability of success scores don't tell you how to have a good retirement more accurately translated Monte Carlos scores actually say something like how likely are you to have to change something at some point during your retirement so an 100% probability of success would indicate that given the scenario you input in the tool you would have a 0% chance of needing to make a change at some point a 50% probability of success would indicate that you'd have a 50% chance of needing to make a change at some point now in reality an 100% probability of success only occurs for three reasons the first is that you're being way too conservative with your spending the second is that you're retiring way later than you need to and the third is that you have so much money that your spending has zero impact on your wealth now scenarios one and two are by far the most likely scenarios know most of us aren't sitting on such a huge pile of money that we just can't figure out how to spend it now part of the reason that scenarios 1 and two are by far the most likely scenarios is because Monte Carlos scoring systems inherently reward people for working longer having shorter retirement periods and spending Less in retirement the fear of not being at 100% probability of success drives people towards those same actions working longer shortening their retirement period and spending dribbles of their Assets Now if you want extra help identifying when to retire yourself without relying on luck you can click the first link in the description below and register for our completely free webinar where I share some pointers on this exact topic the second truth is that Monte Carlo based retirement planning tools are the best way to plan for retirement now Monte Carlos scoring or probability of success scoring is a highly sophisticated way to model possible retirement outcomes as technology has improved retirement planning tools built around Monty Carlo analysis systems have become extremely popular as a retiree you would pop in your personal information your age how much money you have what types of Investments you hold and then you'd populate the tool with hypothetical information estimates of things that you think you might spend each year in retirement or your expected lifespan the expected lifespan of your spouse or the expected growth rate on your assets among a host of other hypothetical inputs then the tool would run a Monte Carlo analysis a thousand scenarios using historical data that ultimately gives you a score that says out of those thousand scenarios How likely are you to run out of money while alive given the hypothetical inputs put into the tool the Monte Carlo analysis is then scored between 0 and 100% And the higher the Monte Carlo score the fewer tested scenarios in which you run out of money so there are several serious problems a retiree faces if they rely too heavily on Monte Carlo based retirement plans the first problem is that a Monte Carlo score tells you nothing about what you should do if you achieve a 60% probability of success the scoring tool can give you zero guidance about what that 60% means whether you should improve it what to do to actually improve it and that's because it's a reactive tool it uses data that you input to give you a result if you do everything you tell the tool you plan to do How likely in that one specific scenario would you be to run out of money while still alive the second problem is that the use of probability of success-based tools can lead to gamification right it's the pursuit of optimizing your score without actually optimizing your life you know fiddle with a dial here fiddle with an input there change your age of death tell the tool that you might spend less once you retire and voila you turn a 60% probability of success into an 87% probability of success the problem is you don't know how long you're going to live you also don't know that you will be able to spend less money once you retire and unlike video games with money and retirement you don't get doovers so it really behooves you to be extremely sure that the hypotheticals you plug into the Monte Carlos system are actually things that you have control over and this leads us to the third and final harsh truth there's no such thing as a safe withdrawal rate there's only a safe withdrawal system a safe withdrawal rate would technically tell you a retiree how much money you can take out of your portfolio each year in retirement more so that safe withdrawal rate would ideally be predictable and definable meaning you would be able to somehow quantify it and document it for every year of your retirement in advance of retiring this is a complete fallacy but the 4% rule which most of you will know of reinforces this idea that somehow using historical data we can identify a safe withdrawal rate that is universally applicable for all retirees and know it in advance of our actual retirement for every year of our retirement now there are a whole host of problems that retirees face when they are under the impression that a safe withdrawal rate of this nature is possible to identify the first is that this leads to what I call chasing Behavior it's this feeling or sense that when I achieve some unicorn number you know some portfolio value that when using the safe withdrawal rate can meet all my financial needs with 100% confidence then and only then I'll be able to retire and so often times we end up working longer than we might we might otherwise need to as we pursue this mythical portfolio value the second problem is that we end up with false confidence because we've achieved a portfolio value which when using the safe withdrawal rate can never fail and then this leads to the third problem which is that a safe withdrawal rate is not actually a dynamic plan and we therefore end up without a system or a set of contingency plans that tell us what to do when things are better or worse than expected now when it comes to Safe withdrawal rates I always ask myself the following questions first how can something be universally applicable to all retirees every one of you watching this video is unique you live in a unique location you have a unique amount of savings unique desired spending unique Hobbies unique family situation unique health conditions even more so you have your own unique definition of safe the second question I ask is how can we ever truly know something in advance that applies across such a long time Horizon the 30-year or 40-year retirement most of us don't know what we're going to eat for tomorrow's lunch let alone be able to forecast all of the financial economic demographic and personal variables that go into producing a safe withdrawal rate into perpetuity the illusion that we can somehow have a predictable safe withdrawal rate needs to be done away with in my opinion replaced with conversations about safe withdrawal systems now if you want to learn more about where a safe withdrawal system fits into a complete retirement plan click the link in the description to watch a completely free webinar where I break down how to implement a safe withdrawal system into your retirement plan and speaking of safe withdrawal systems you're going to want to stay tuned for the back half of this video where I'm going to walk you through on screen an example safe withdrawal system and what it looks like for the first half of this video I've been making the case that safe withdrawal rates in Monte Carlos systems have major weaknesses so where do they actually fit into proper retirement planning in my opinion and what can you do to manage or operate around the limitations that I've described in the first half of this video my opinion is that a safe withdrawal system is the solution a safe withdrawal system takes the best parts of what safe withdrawal rate research and Monte Carlo analysis tools have to offer and it gives us an operational frame to work within I believe there are three elements to a good safe withdrawal system and I'm going to show you these on the screen in a couple moments the first is to understand what probability of success-based tools actually tell you versus what they do not which is what we've already covered the second element is to use a dynamic withdrawal strategy my particular favorite is the modern guardrails approach and that's what I'm going to show in a moment here and the the third element is to have a dynamic system of if then rules rules that allow you to track specific things and then recommend specific actions based on the tracked or monitored result now let me show you this in real time on the screen here what I have here is a several sheet spreadsheet and the first sheet here is exported from our modern guardrails tool called income laboratory the second sheet which I'll show you in a couple moments comes from our Monte Carlo based tool which is called right Capital now the these two tools are used in conjunction to support our safe withdrawal rate system the first sheet here is going to show as I unfold it on the screen for you is going to show a hypothetical person's modern guard rails spending recommendations so what we've done is we Supply the tool with specific inputs the hypothetical client's age their desired date of retirement an estimate of how long they might live the quantity of their wealth and the composition of their wealth we also supply income Labs with spending parameters but instead of telling the tools how much money the client wants to spend we tell this particular tool how comfortable this client would be with making spending adjustments at some point in the future and you can see that right here on the screen that's what this setting comes from in income Labs now in the example I'm going to use for this demonstration of our safe withdrawal system we Supply parameters that say the client would like to Target an income with an estimated 20% risk of overspending and an 80% risk of under spending translated better it would sound more like a 20% likelihood of needing to make a spending reduction during retirement and then based on the data inputs this client is generated the guard rails that I'm going to show you on the screen here in this middle column or middle row here their current portfolio value is at roughly $2. 5 million as a result their safe withdrawal rate for the year first year of retirement would be $150,000 roughly or $2,524 per month now their lower guard rail would be triggered when the portfolio value hits $1 1. 77 million this would be the point at which they'd have to make a spending reduction of roughly 5% and you can see the corresponding dollar amounts in the row below their upper guardrail would be triggered at roughly $2.
7 million in value and this would cause a 7% spending increase now they don't have to change their spending if they don't want to but they'd be eligible for that 7% spending increase obviously lower guard rail triggers would be non-negotiable upper guard rail triggers would be a nice to have now we can also change the spending parameters based on the level of comfort for the client so if this client were to say 20% risk of overspending is too high for me I want a 1% risk of overspending what would their initial safe withdrawal amount be well we can tab over to the second sheet here looks exactly the same just the numbers in the actual withdrawal columns here have changed and you can see now we target an income with an estimated 1% risk of overspending 99% risk of underspending their initial safe withdrawal amount would be $136,900 288 their guard rails would also be a little bit tighter on both sides meaning they trigger an upper guard rail a little sooner but they also trigger a lower guard rail much sooner now the question you're probably asking yourself is how are these guardrails actually generated well they're actually generated using the same historical data used in a Monte Carlo analysis but the main difference here is that a traditional Monte Carlo based tool like right Capital will not supply you with your initial safe withdrawal rate which is why people turn to the 4% rule because they don't know what their safe withdrawal rate could be so hopefully they use the 4% rule to fill that void now you'll notice that I've repeatedly said initial safe withdrawal rate and that's because that's exactly what it is it's initial and we don't know what the future has in store so we can't assume that this safe withdrawal rate will work into perpetuity or in the future rather what we need is a system that tells us based on changes to our portfolio value and based on the best historical data we have what would this particular ular person's safe withdrawal amount B now I'm going to show you a demonstration of this in a second but before I do that one other thing to note is that using modern guard rails we can test the hypothetical client safe withdrawal amount during historic Market periods so on the screen I'll show for instance in this specific scenario using this hypothetical 61-year-old with roughly $2. 5 million in starting portfolio value if they' retired right before the Great Depression that's what this graph here shows their starting portfolio value would have been worth 9 $72,000 at the end of their retirement period so they would have had a starting monthly withdrawal amount of roughly $1,524 per month which by the end of their life because it would have triggered three lower guard rails but five upper guard rails would end up being $18,300 per month but again while historical data is really useful we don't really know how the future is going to play out the beauty of guard rails is how they can be used in a safe withdrawal system which leads us to the second spreadsheet I'm going to show you here which is now table of withdrawals this is the actual nuts and bolts of the system in this sheet here we have a column for the age of the person for the withdrawal year or distribution year the starting portfolio value the safe withdrawal amount the desired withdrawal amount the desired withdrawal amount is the amount that the client tells us they want to spend in order to achieve the lifestyle they desire often times we're Supply at a desired withdrawal amount without knowing what our safe withdrawal amount is at that time and then the final column in the spreadsheet is what we call wiggle room and this is just the difference either a Surplus or a deficit between what modern guard RS tells us the safe initial withdrawal amount is versus the client's desired withdrawal amount and there's a surplus withdrawals that can be if there are Surplus withdrawals those can be allocated to things like Roth conversions gifts or additional personal spending but on a to be determined basis which I'm going to show in a moment now a quick note I've been talking about initial withdrawal amounts but on the screen here I'm showing two columns you know or two rows two years of withdrawals so what gives well the second row is an estimate of what the withdrawal amount would be if neither upper or lower guard rails were to trigger in actuality what we need to do is we need to monitor this in a particular manner which I'm going to show you on the screen now so in this second sheet here we're going to begin with his hypothetical clients first year with this safe withdrawal rate system safe withdrawal amount system it's 2025 and the client starting portfolio value is $2. 5 million their safe withdrawal amount is $1 15,28 for the year their desired withdrawal amount is $16,839.