So epidemiology, as was previously defined, is a study of a disease distribution by looking at how frequently diseases or health conditions appear in which pattern. So a frequency measure is a very basic unit in any epidemiologic studies. So frequency is in general defined as a number of observations within an interval or group and this frequency is extensively used in epidemiology.
So what would an epidemiologist do with frequency information? First, they would count the cases or health events on their investigation and describe them by time, place, and person and usually these counts are divided by an appropriate denominator for further comparisons. So the measure of frequency starts with counting the number of individuals who met the case definition.
So the count is the simplest and most basic representation of magnitude of disease occurrence and there are a number of ways to summarise the count data such as frequency table or histogram, which we already know how to create them. And after counting is done, then sometimes the count is divided by an appropriate denominator depending upon the purpose. So when the count is divided by the total sum and then we have a proportion.
So in proportion, the part goes to the numerator and the whole goes to the denominator. In other words, the numerator is the subset of the denominator and proportion does not have dimension because the units in the numerator and the denominators are supposed the same and then when they are the same, they cancel each other out because this is division. So since the numerator is never bigger than the denominator, the value of proportion ranges from 0 to 1 and this value is independent of the time change.
So there's no time information implied in proportion. Now the ratio is another value you can calculate by dividing two numbers each other. But this is different from the proportion in that the numerator is not necessarily a subset of the denominator.
So the value can range from zero to positive infinity and as with proportion, this value does not change with time or does not imply any time information and in the context of epidemiology, odds are commonly used statistics that is calculated as the ratio between the number of cases who have a certain condition or disease and the number of people who don't have the condition given an exposure to a risk factor. Basically, this is a measure of likelihood of a particular disease or condition. Finally, we have rate and this is another value that can be calculated by dividing numbers but it contains time information.
So the rate is defined as the number of events per population where events are counted over a specified time intervals and so from the epidemiologic sense, the rate is the number of cases, which goes to the numerator and divided by the sum of follow-up time contributed by the people at risk of the event. So we will come back to this quantity later when we study cohort study design. And all these values including proportion and ratio, they frequently we scaled by multiplying a constant usually any multipliers of a tens such as ten hundred thousands or ten thousand to make the quantity as close to the whole number to make it easier to understand.
To make sure that we know how to calculate in each of these quantities, let's go over some simple calculation examples. So in a class with the 60 girls and 40 boys what is the proportion of girls and boys or the ratio of girls to boys or vice versa. So the numbers here are given as counts right?
60 and 40 they are counts of girls and boys which is basically the absolute frequency. So the proportion of the girls in the class is the number of girls in the class over the total size of the class which is a hundred. 60 plus 40 becomes hundreds so that is point six or hundred percent sixty percent or sixty sixty percent by just multiplying hundred and the proportion of boys in the class is forty over a hundred so point four or 40 right.
So the ratio of girls to boys so this is 60 over 40. That's 2 3 3 over 2 1. 5.
So there are 1. 5 times more girls to boys. and then the ratio of boys to girls is just a flipping ratio.
So that's 40 over 60 2 over three that is so just repeating six six six six six six we can just say that in a point six seven by just rounding up. And then here's another question. So the number of females who attended the eye clinic last month was 179 out of total visits of 341.
So in this case what is the proportion of males? Because the male's count is not provided we have to calculate it from what we have. So that's numerator we need to put the male counts which is 341 minus 179 and this should be divided by 341.
So the numerator becomes what 162 over 341. So I think we need a calculator. So that's 62 over 341.
So that's 47. 5%. yep that is and then female to male ratio now that is 179 over 162 and so that should be 179 over so that's 1.
1 in one four right the one point just one sorry one point So that is the female to male ratio. Now that we have looked at basic quantities used in epidemiology, let's talk about how the size or the magnitude of disease is represented in a population. So one of the most frequently used frequency measures in epidemiology is morbidity which means a disease state, this disability, or negative health outcomes and usually measures of morbidity are characterised by the two numbers, prevalence and incidence.
And these two numbers provide big picture information about a disease, framing public health questions, policies, patient management, and guiding resource allocation. So the prevalence is a key concept in epidemiology which is defined as the measure of how many people have a disease in a population at a given time. So this is usually stated as a percentage of the total number of people in the population under the study.
Typically, it is measured with cross-sectional survey and usually reported with a number of other geographic and demographic information. So the calculation of a prevalence is quite simple. You just divide the number of cases by the number of population to which the cases belong.
So then you either multiply 100 to make it a percentage or other powers of 10 base. So in epidemiology, a case is a person with a disease such as a cataract or a health problem such as obesity, or a condition such as myopia. So prevalence does not necessarily have to be the measure of disease we can also use prevalence to assess the frequency of certain behaviours or characteristics that may be risk factors for disease.
So for example, smoking is not a disease per se but it is a risk factor for many diseases. However, it is relevant to assess the prevalence of this behaviour. Because the definition of a case can be different in different studies given the same disease, it is very important to clearly define what a case is.
So to take cataract as an example a case may be defined as age-related cataract or as congenital cataract depending upon the kind of population the study is interested in. In prevalence, the numerator is a part of the denominator so prevalence is a proportion. Prevalence is a static measure providing a snapshot of a disease in a population.
So as a real example of prevalence calculation, in 1980 the Framingham eye study, which was a part of the mega longitudinal cohort study on heart diseases in America, examined 2477 subjects for cataracts and found that 310 had the cataract. So the prevalence of this population was 310 over 2477 which is 0. 125.
So this can conveniently be expressed as 125 cases per thousand or 12. 5 percent. So the numerator conceivably could include people who had first developed cataracts prior to 1980 and people who developed cataracts during 1980 just before their exam was done.
So please note that all people counted in the numerator are also included in the denominator. In other words, the numerator is a subset of the denominator, making the prevalence a proportion. So here is another example taken from the real study in 2003 and the example goes in a national survey of blindness in Bangladesh a sample of 11 and 624 individuals aged over 30 years old were examined and among them, 162 were found to have presenting visual acuities worse than 3 over 60.
So for this population and you want to calculate the prevalence of blindness. What seems to be missing in this example is that the criteria for blindness but it is kind of implied in the question in that the visual acuity worse than 3 over 60 is indeed the criterion if you remember the table from the ICD-10, the international classification of disease. This was the criterion for the blindness by the world health organisation.
So the calculation is just simply the number of people who meet the criteria, which is 162 right so that's just 162 over the population okay status and all right so that's only about 1. 4 percent. So the prevalence of blindness is 1.
4% for this adult population. Another important measure of disease in epidemiology is incidence. Incidence is defined as a measure of the currents of new cases of disease during a specified period of time.
So incidence can be expressed in two different ways: as a proportion or rate. But here I will only introduce the incidence proportion because the incidence rate is typically measured in a cohort study design which we will talk about it in more detail when the time comes. And it is typically said that incidence provide information about the dynamics of a disease like in motion picture how quickly a disease comes and goes whereas prevalence provides a static portrait or the snapshot of the disease.
So the incidence proportion can be thought of as the probability of developing disease over a stated period of time. So as such, it is also known as an estimate of risk or sometimes it is called cumulative incidence. So in order to interpret risk, it is necessary to know the length of time that applies.
For example a 2% risk of a certain disease can have a very different meaning if it is over the next 12 months or the next 10 years. So if we look at the equation to calculate incidence in the numerator we only include new cases arisen during the specified period of time, which is different from the prevalence numerator where it includes the pre-existing cases too as well as new cases. The denominator of incidence is the total number of disease-free people at-risk identified at the beginning of this study.
So in the ideal universe, if we are to estimate incidence in both incidence proportion or incidence rate, we would want to measure this in a sample of people who are truly at-risk of developing the outcome of interest. So in measuring incidence, we would like to exclude anyone who was not at risk of developing the disease because they already had the disease or because they couldn't develop the disease. For example, if we want to estimate the risk of developing prostate cancer in men then we obviously would like to exclude women because of the obvious reason.
So there are several key differences between the prevalence and incidence. First, the value goes to the numerator in each case is different. In case of prevalence, all cases present during a defined time period go to the numerator whereas only the new cases in that same period go to the numerator in case of incidence.
Secondly, prevalence is often used for chronic disease whereas incidents usually used for acute diseases so in acute diseases such as pinky eye in a primary school, let's say, incidence measures are more useful because it is a limited but highly contagious condition. Such conditions may be seasonal so comparison of a current incidence with historical data may establish an epidemic when more cases of pinky eye are found than would normally be expected. But in chronic diseases that are not contagious such as glaucoma, prevalence measures are more useful because it may take a long time for the condition to develop.
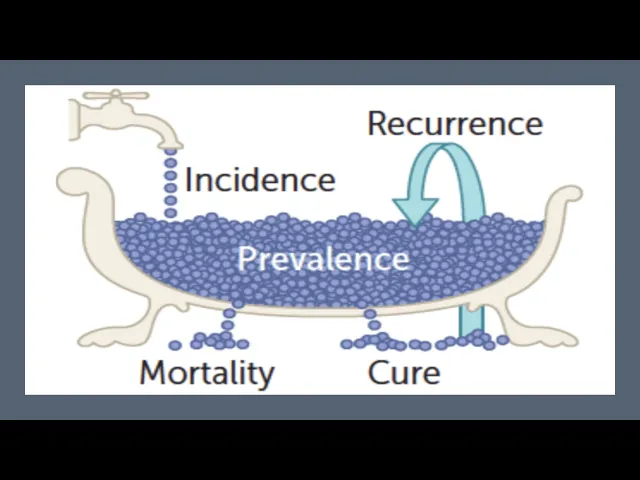
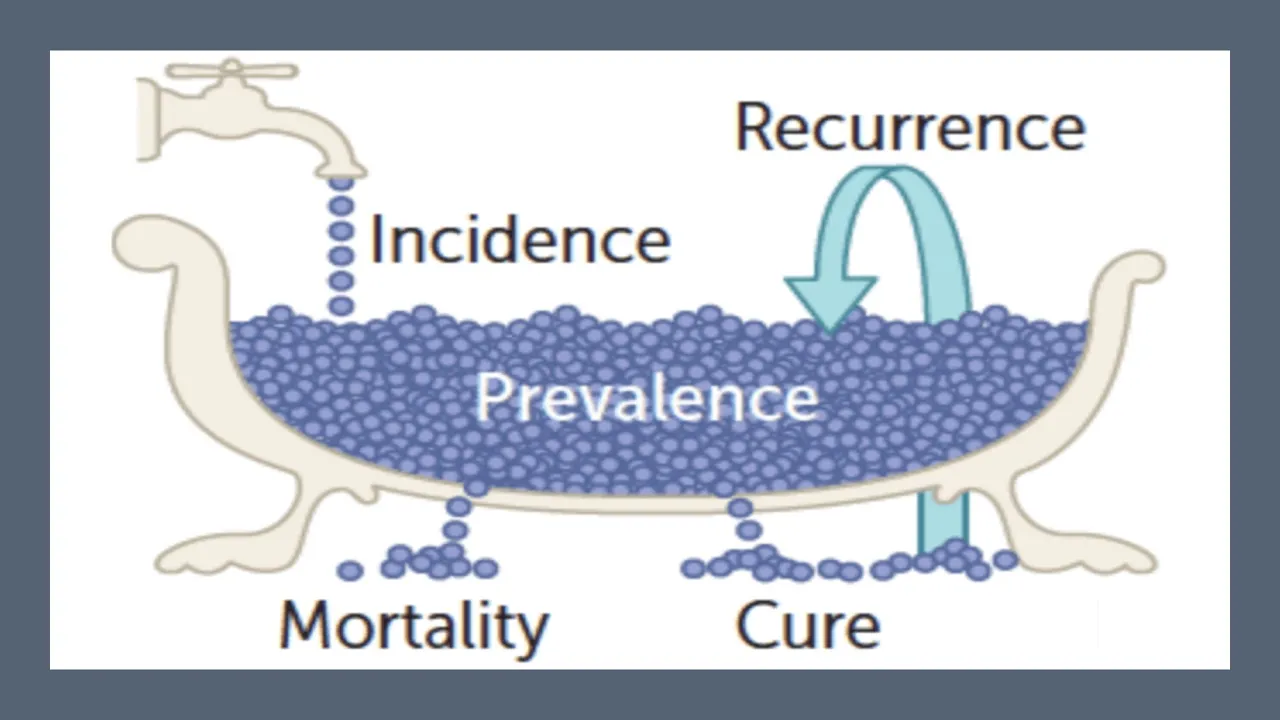
So the prevalence and incidence are related in such a way that prevalence is a function of both incidence and duration of illness. So for example, high prevalence of a disease within a population might reflect high incidence or prolonged survival without cure or both. On the other hand, low prevalence might indicate low incidence, a rapidly fatal process, or rapid recovery.