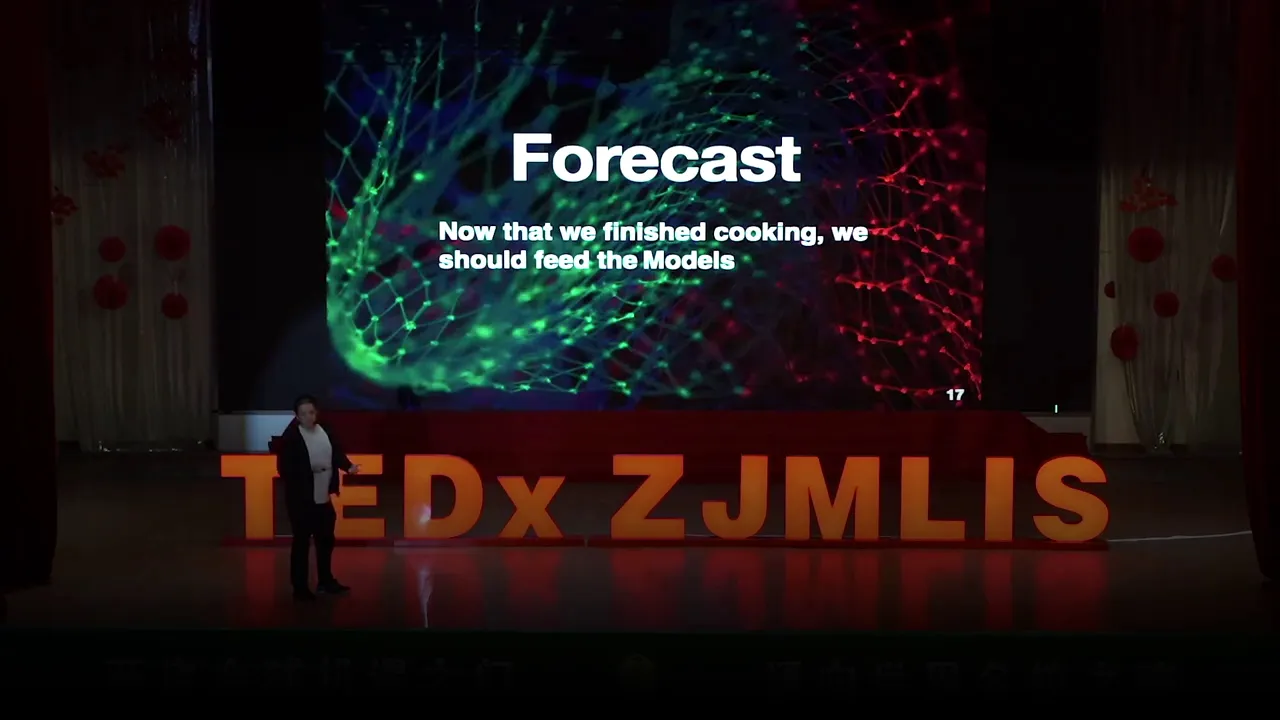
[Applause] is [Music] i'll say it's very relevant to our daily vlogs because you do you rely on a lot of modern conveniences that are based on sciences so let's show you some applications of classes so face sometimes we can forecast and forecast our goal we look and let's define sinuses um you have time here and you have one variable in barriers one area and on the left side you have three variables here those are weights uh intake and your workout intensity so this is a pretty very intensive small because uh got connections which will wait
for the food you eat and exercise so by exploring their correlation the forecast model can give us their insights in this case they're forecast after seeing this input or you can visualize it as they paint the input and they are happy and then after that they tell you their insights so how does times work let's look at our words this is an example how times of results we have strength and the greater that's called this typically it's uh 80 or 95 percent confidence level and uh inside that region uh it's very likely to see the
real data in that breakdown and you can see the actual data the yellow line uh perfectly light and then this is blackly in most scenarios but in some cases the real value might go out the forecast model is helping us to transform the inputs into the forecast let's do a univariate time series forecast so the stock i chose the sap hana that reflects the performance of the united states economy and uh so we need to have data and we have possible quality data and uh not requirements uh remember we only need one variable here because
it's much simpler for us to understand the workflow of profit data analysis so we just need the close a common price we now only have one variable and uh let's pop this out this image looks pretty much uh stock market ish it looks pretty standard and and they give us their insights only after they are uh repeating patterns that they're usually continuous but when you are trying to see seasonal pattern just from your own eye without any processes it will be pretty hard so we need to use different methods of overlaying the chain change in
every year so yearly overlay on the right side you can see a highly seasonal example and that's a that sweeps ourselves difference so in january you can see a huge comment on december a huge increase my theory is that on december where the christmas ass people swallow their wealth so that they don't have money to pay for their goods in january that's one likely scenario but uh for our data which is aren't class seasonalities they invest the system so we don't have to care about the seasonal models because they don't love it if it's not
reasonable they're hard so you can see the data trend the value is not zero so it's stationary but it's not stationary and this stationary data does not have a trend and that mean value is zero so how to transform uh to this image from innovation above we are going to use take a difference so let's uh think about decree it's five dollars and they talked seven dollars so it experienced a two dollar increase and we're going to cost the difference on this on this cost so the [Music] stationary looks stationary is it uh have a
atf test to see if it is stationary and after the test we can see that the difference data is completely stationary so we now have two in there one is the station everything and one is not that not stationary so um i'm not saying that the constitution really is bad they're uh they all fall into different factors different models right now so we have three different models the naive arena and bts these are uh this is when our data is seasonal we can feed it into the arena discussion sort of a lot of discussion and
they will usually produce better results but not always um with other analysis like intervention development analysis and by doing so we can values there is a real model and there is yes the arrow value the smaller the pattern is the best but pcs follows very close to show you how this slight difference is supposed to be in our final forecast output where we'll show so it has a smaller confidence interval it is more precise because it has a smaller range for the yes has a bigger range for example when you get your [Music] much more
accurate right so you will prefer having a smaller range the real data on the forecast and you can see the red line which is really that perfectly falls into that eighty-five percent complex however are fifteen percent will go out so but it's in most scenarios it would just fall into that dark blue region so um how do they enter the stocks market forecast as you can see we have a still a pretty wide range how to narrow it down to make it more accurate through the health of existing machine learning tools we can transform the
tests into the newspaper into uh values that represents food volatility uh different sorts of things combine it with our close class and figure out some correlations and they will help the forecast results when you check whether again i really hope you can't remember this meditation because this is what makes your weather act awesome and thank you