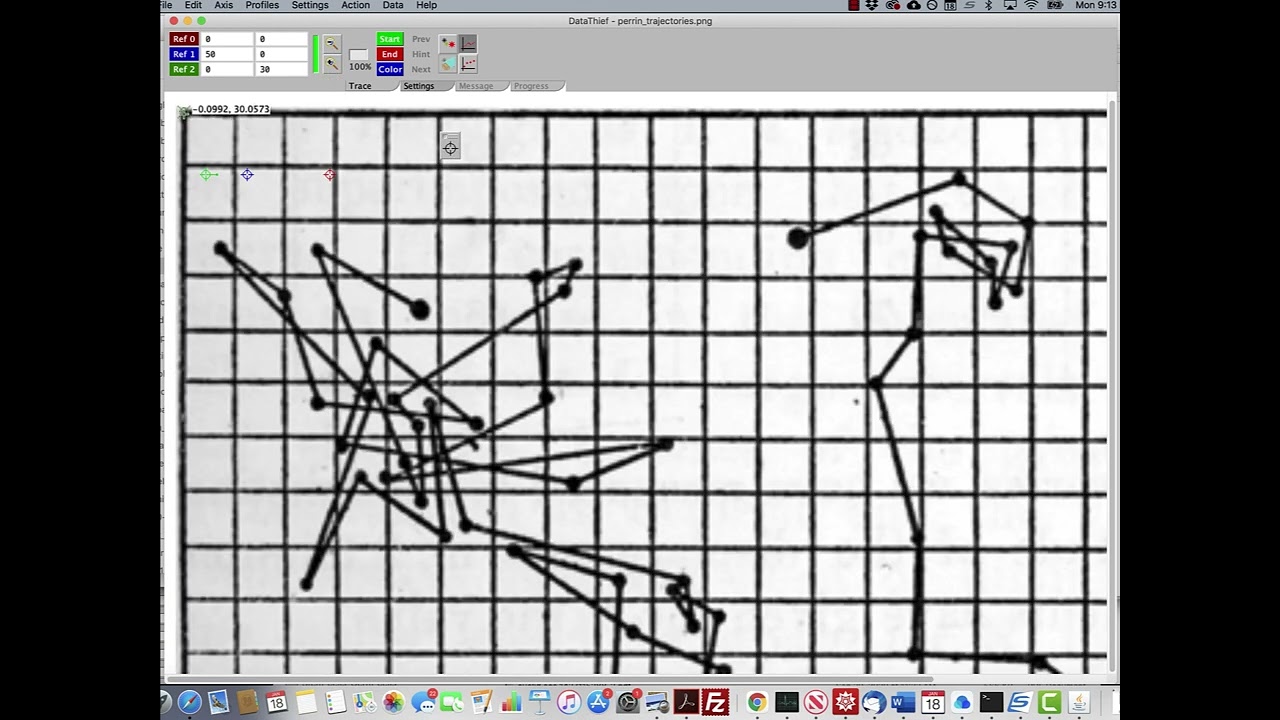
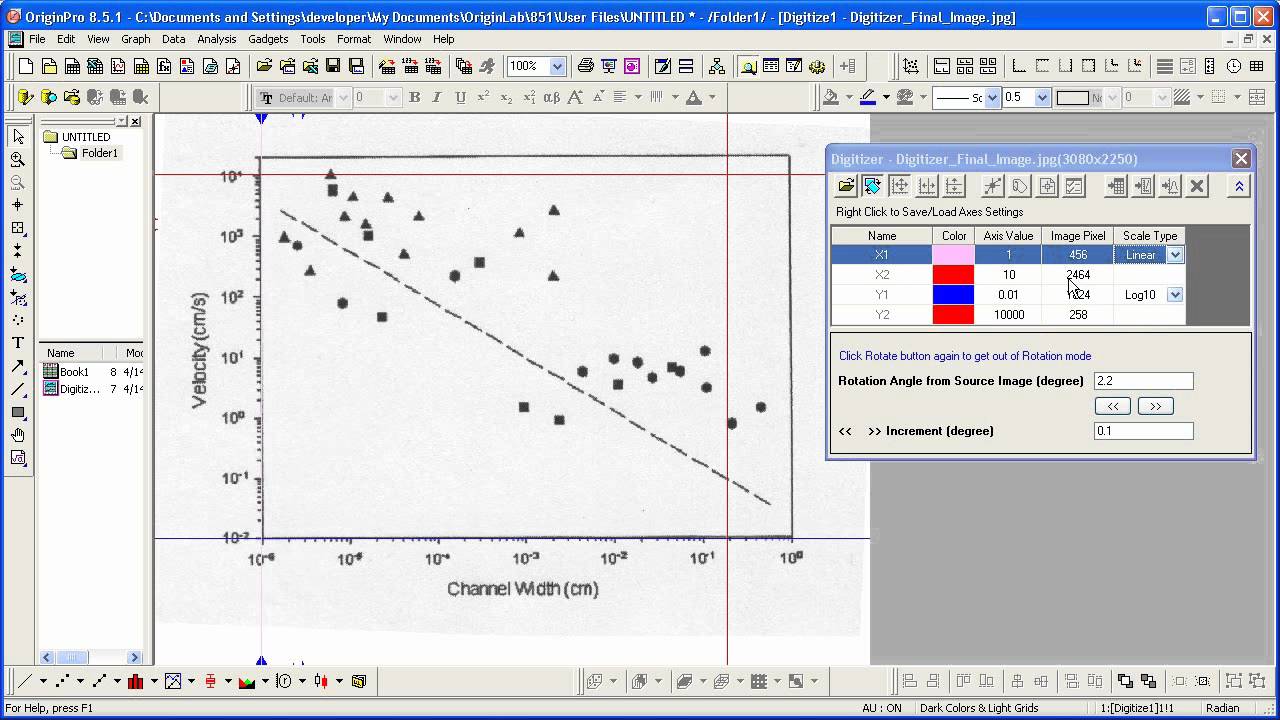
hi I'm Katie Thompson I will be walking us through this tutorial on using data Thief for digitizing meteorological charts at hubard Brook we're going to be using rr0 354 as our example chart the first thing we're going to do is open our image one of the precipitation charts to begin we look at our reference points we have three reference points 0 1 and two highlight them this way so they're easier to see can line our reference points along the chart then we can zoom in to make them more precise here I'm going to show you
how to jump from one reference point to the other so rather than having to always scroll down to where your reference points are scroll along a zoomed in chart you can click on the point and it will bring you to that location now we'll go to reference two another useful thing to be able to do is hold down your mouse button like left click and then you can use the arrows from your keyboard to move the chart I'm sorry to move the reference point make it more precise this can sometimes be more precise than clicking
and dragging with just your mouse now we need to look at the chart Dimensions so we need the length and the height in centimeters we get that from the chart type this chart is 5-44 by opening our table of the chart types we can find 5- 446 we can find a length of 292 cm and a height of 152 CM plug that in 152 for the the height 292 for the length next we can go in our trace and we can see our start and end points and put them along the line that we want
data Thief to trace now I want to show you something thing about zooming in and out you can see right now we're at 25% for our view and that you can no longer zoom out anymore it's Gone transparent with zooming in you can go to 50% and 100% you cannot go past 100% it doesn't show this this doesn't turn transparent you can touch it but if you click it will crash so let me just show you that data Thief says a fatal error occurred it tried to get to 200% and it couldn't so you say
okay and it will crash now we can pull that right back up go to your data Thief we have to open our file again now everything has stayed where it was you've still got your reference points and everything you just had to open the image file again and we can go back and continue what we were going to do with our start and end points by making sure that these are precise so now I want to talk about this start point unlike the indicator point or the reference point this has a tail hopefully you can
see it as I'm moving the mouse around this tail tells data Thief which way to follow the trace so after this indicator that the chart was put on we put our start point I'm sorry that the pen was put on to record precipitation we then use this indicator to show that it's going this way now can go and check the Precision of our end point that right before the indicator that the chart was taken off now the last thing we need is to indicate the color and that's indicated with this right here make it flash
you touch the color tells data Thief what color line to look for you can also see it in this box so as I move move you can see that that box will change colors now that it's along the line we can zoom in to our 100% and place our color so that it's nice and deep purple now we can go currently we're in the trace Tab and we can go to the settings tab to check our color even further when you're checking your color you want to look at the tolerance right now we're at a
tolerance of three and by clicking show we can see what that means that data Thief is seeing so data Thief is seeing this line if you increase the tolerance dat Thief will be able to see more colors to an eight or a nine you can't see anything because you're seeing too much out of one you're seeing a very small amount usually three is a good indicator for data Thief lastly we're going to check what our output put points will be when it traces so we're tracing this line so that we can get X and Y
coordinates along it for our hourly precipitation rate so we can go into the settings tab still we can look at the output distance of the points we want them every half centimeter so EV so for half of every 292 292 is the length of our primary axes so we want half a centimeter we'll do 0.5 on the primary axis now we can go in and we can trace this line so you're going to go action Trace this alert is very common so when you press okay it'll show you how far data Thief was able to
trace with a lime green line that will show up on top of our purple line and it'll also indicate where there was trouble and it couldn't get to the end so we can see that the trouble occurred right here to fix this we're going to use hints and you get hints by going settings show dump and then this will give us these hint points these hint points are a circle with a line extending out of them similar to what our start does and this tells data Thief when you put the circle in the problem area
to look forward this way this line indicates which way we want data data Thief to continue so I'm going to zoom in and because our problems near the end I'm going to jump to it by clicking on the end roll up a little bit to find data Thief you can also get rid of hints by putting them back in the dump so this dump box gives us hints and can get rid of hints if you don't need it so we're going to put a hint in some of the spots that I see could be trouble
I'm going to put in three hints all facing the direction of the end zoom out move my dump box and try tracing it again now we didn't have any alerts this time the green line has gone all the way to the end we're all set we can save our data Thief file this will save the image the reference points the start and end points any hints put on and the color indicator that way if we need to look back at this chart again we can just pull it up as a data th file rather than
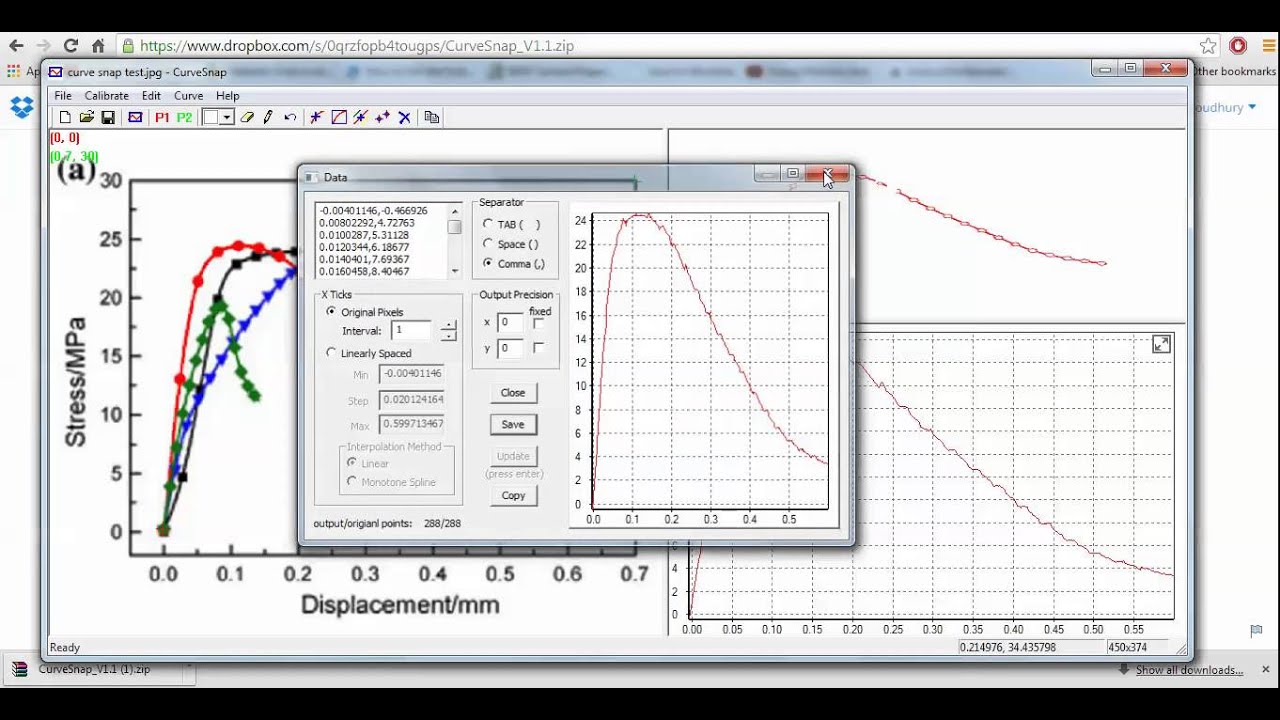
going through all of these steps next we're going to export our X and Y data points you can see these data points by clicking on this box right here so we've gone from showing us the Trac line showing us all the data points that make that that line you can see it's kind of hard to just jump from one to the other but they are every half CM along the primary axes now we can go file export data going to save it with an underscore a which I didn't explain before the reason why we're doing
the underscore a is because some charts require multiple traces which require multiple text files multiple data Thief files so just to stay consistent even though this l needs one Trace we're going to do an underscore a thank you to the team at data thief and thank you very much for watching


![[Webinar]Automation Test - Con đường từ người mới tới chuyên gia](https://img.youtube.com/vi/3UeztRxpuNg/maxresdefault.jpg)