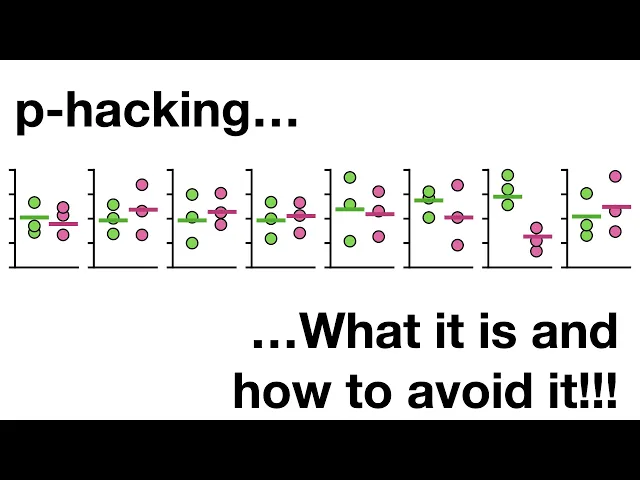
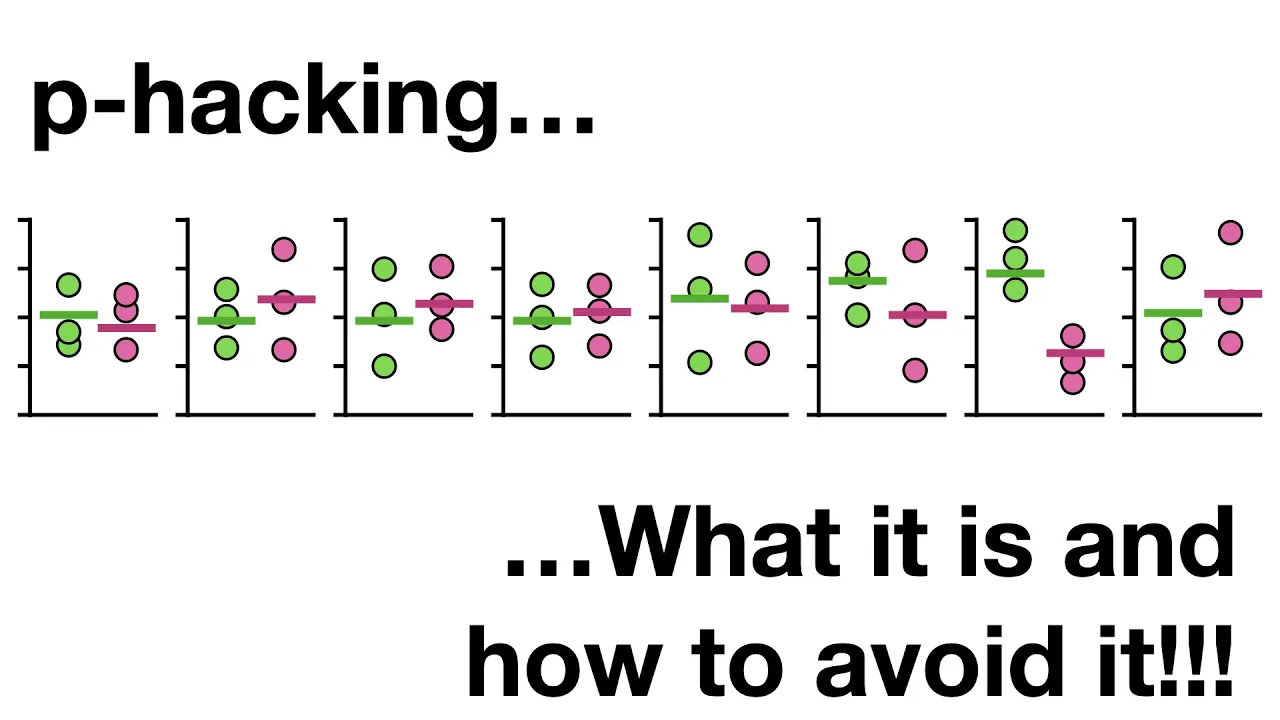
P hackin don't do it if you do it it's a shame skin quest yeah hello I'm Josh stormer and welcome to stat quest today we're gonna talk about P hacking what it is and how to avoid it note this stack quest assumes that you are already familiar with p-values if not check out the quests imagine there was a virus and we wanted to develop a drug to reduce the time it took to recover from it so he created a bunch of candidate drugs and we tested each one to find out if any of them worked so we measured how long it took for three people to recover from the virus without any drugs and then we gave three people drug a and measured how long it took them to recover just by looking at the graph it appears that drug a did not shorten recovery very much if at all so we measure how long it takes three more people to recover without any medicine and then we give three people drug B and measure how long it takes them to recover again just by looking at the graph it doesn't look like drug B helped people recover any faster than people without any medicine so we just keep testing drugs until we get one that really looks like it does a good job and at long last it looks like drugs II does a great job reducing the amount of time it takes to recover from the virus so we calculate the means of the two groups and do a statistical test to compare the means and we get a p-value equal to 0. 02 and since 0. 02 is less than 0.
05 we reject the null hypothesis which is that there is no difference between not taking a drug and taking drugs II BAM no no BAM we just pee hacked pee hacking refers to the misuse and abuse of analysis techniques and results in being fooled by false positives however instead of feeling great shame let's learn about pee hacking so we don't do it again imagine we measured recovery times for a whole lot of people who did not take any drugs to fight the virus and then we fit a normal distribution to all of the recovery times the red area under the curve indicates the percentage of people that recovered from the illness within a range of possible values for example 2. 5 percent of the area under the curve is for durations less than 5 days indicating a 2. 5 percent of the people recovered in less than 5 days in contrast 95 percent of the area under the curve is between 5 and 15 days indicating that 95 percent of the people were covered between 5 to 15 days now if we only asked three people represented by light blue circles how long it took them to recover from the illness there's a good chance all three would say something between five and fifteen days and if we asked a different set of three people represented by dark blue circles there's a good chance all three would also say something between five and 15 days just like before we can plot these two groups of people on a graph and we can calculate the mean values for the two groups and compare those two means and get a p-value equal to zero point eight six and because zero point eight six is greater than 0.
05 we would fail to see a significant difference between the two groups of observations in other words the p-value did not convince us that the observations came from two different distributions and that makes sense because both groups of people came from the exact same distribution now imagine we asked another group of three people how long it took them to recover and we plotted their recovery times and mean value on a graph then we asked another group of three people how long it took them to recover and we plotted their recovery times and mean value on the graph again we do a test to compare the two means and we get a p-value equal to zero point six three and since 0. 63 is greater than 0. 05 we would fail to see a significant difference between the two groups of observations and again this is good because both sets of observations came from the exact same distribution now imagine we just keep taking two groups of three from the same distribution and testing to see if they are different note these two groups almost look like they could be different but the p value equals 0.
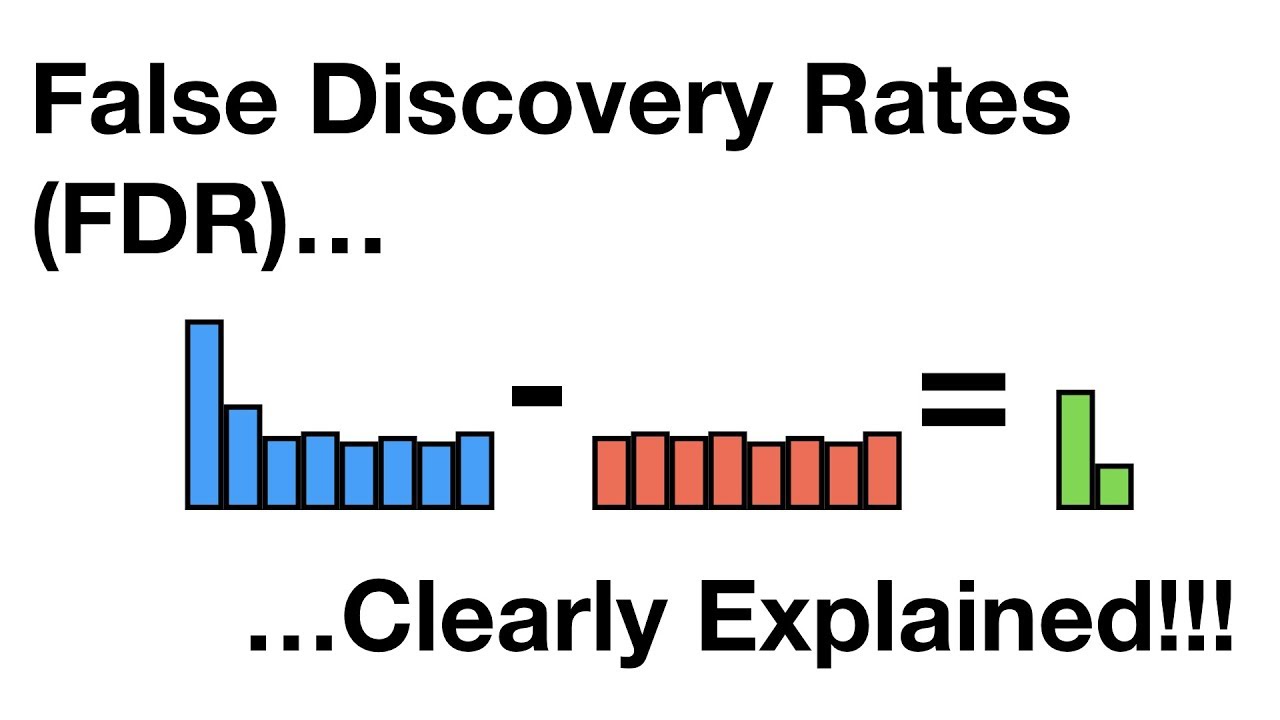
06 which is greater than the standard threshold for significance 0. 05 so we just keep going and sooner or later we will get something like this when we compare the two means the p-value equals zero point zero two and that tells us that there is a statistically significant difference between the two groups suggesting that the data came from two different distributions which is incorrect since we know that both samples came from the same distribution the small p-value is a false positive note you may remember from the stat quest on interpreting p-values that setting the threshold for significance to 0. 05 means that approximately 5% of the statistical tests we do on data gathered from the same distribution will result in false positives that means if we did 100 tests we would expect about 5 false positives or 5 percent and if we did 10,000 tests we would expect about 500 false positives in other words the more tests we do the more false positives we have to deal with oh no it's the dreaded terminology alert doing a lot of tests and ending up with false positives is called the multiple testing problem the good news is that there are many ways to compensate for the multiple testing problem and reduce the number of false positives one popular method is called the false discovery rate shameless self-promotion I have a whole stack quest on the false discovery rate the link is in the description below the main idea is that you input the p-values for every single comparison d ppppp boop boop and then the false discovery rate does some surprisingly simple mathematics and outcome adjusted p-values that are usually larger than the original p-values and ultimately some of the tests that were false positives before end up with adjusted p-values greater than 0.
05 like I said I have a whole stack quest on this method if you want to know more details the important thing to know now however is that in order for false discovery rates or any other method that compensates for multiple testing to work properly you have to include all of the p-values for all of the tests not just the one that looks like it will give you a small p-value in other words don't cherry-pick your data and only do tests that look good BAM now let's talk about a slightly less obvious form of pee hacking remember these two groups the p-value was 0. 06 now we know that both groups came from the same distribution but typically when we are doing experiments we don't know if they both came from the same distribution or different ones and let's be honest we usually hope that the observations come from two different distributions in this example we are looking for a new drug to help people so we want to see an improvement so when we get data like this where the p-value is close to 0. 05 but not less than it is very tempting to think hmm I wonder if the p-value will get smaller if I add more data so we add one more measurement to each group and now when we calculate the p-value we get zero point zero two which is less than 0.
05 so we can report a statistically significant difference hooray we got what we wanted right no we P hacked again wah wah when a p-value is close to 0. 05 like what we had with the original data there's a surprisingly high probability that just adding one new measurement to both groups will result in a false positive in other words even though using a threshold of 0. 05 should only result in 5% of the bogus test giving us false positives the theory assumes that we only calculate a single p-value to make a decision in this case we calculated two p-values to make our decision the one at the start which was 0.
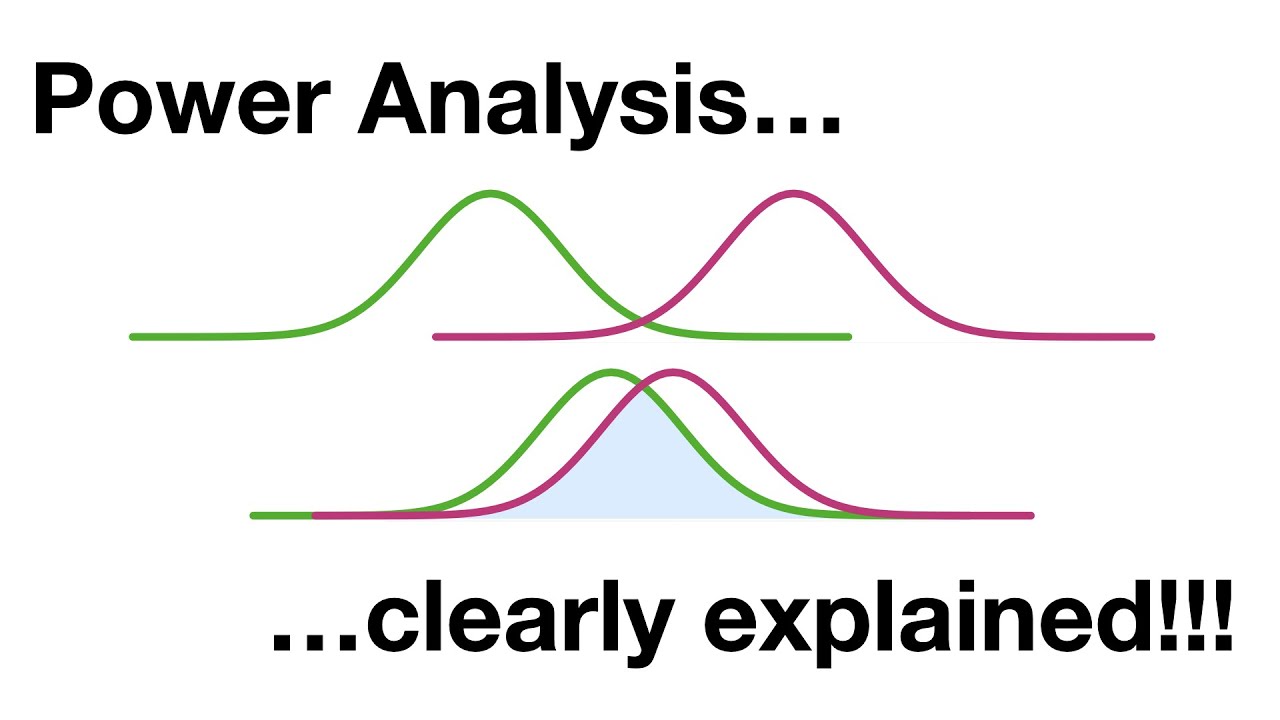
06 then because the first p-value is close to 0. 05 we added more data and calculated a second p-value in this case we know all of the measurements came from the exact same distribution so we know this is a false positive so how do we keep from making this mistake in order to avoid making this mistake we need to determine the proper sample size before doing the experiment and that means we need to do a power analysis a power analysis is performed before doing an experiment and tells us how many replicates we need in order to have a relatively high probability of correctly rejecting the null hypothesis cool where can I learn more about doing a power analysis in the next stack quests we'll talk about power and power analyses to determine the appropriate sample size BAM in summary if you have a bunch of things you want to test out like a bunch of different drugs that might help people recover from a virus don't just collect all the data but only calculate a p-value for the one time things look different instead calculate a p-value for each test and adjust all of the p-values with something like the false discovery rate this will help reduce the probability of reporting a false positive and when you do a test and get a p-value close to 0. 05 but not quite less than 0.