hello and welcome to biostat squid in this video I will give you an overview of pathway enrichment analysis which is a very useful tool for differential gene expression analysis so let's Dive In so we all know that differential gene expression analysis is an essential step in rna-seq Downstream analysis the goal is basically to identify differentially expressed genes or deegs between two conditions for example you might be interested in studying the difference in gene expression between liver cells of healthy individuals and liver cells in individuals with alcoholic hepatitis but the French of gene expression analysis May
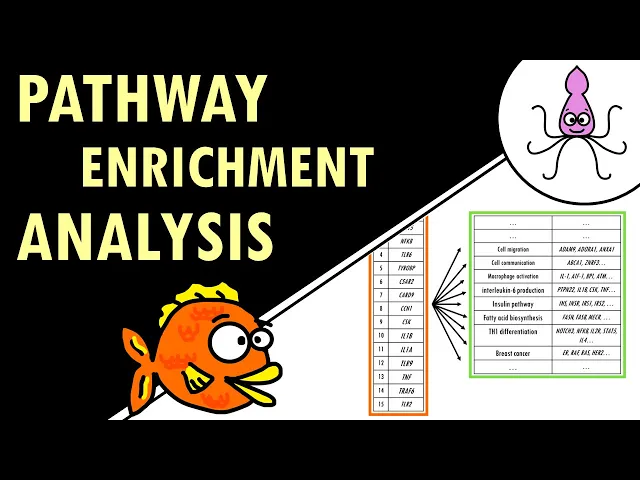
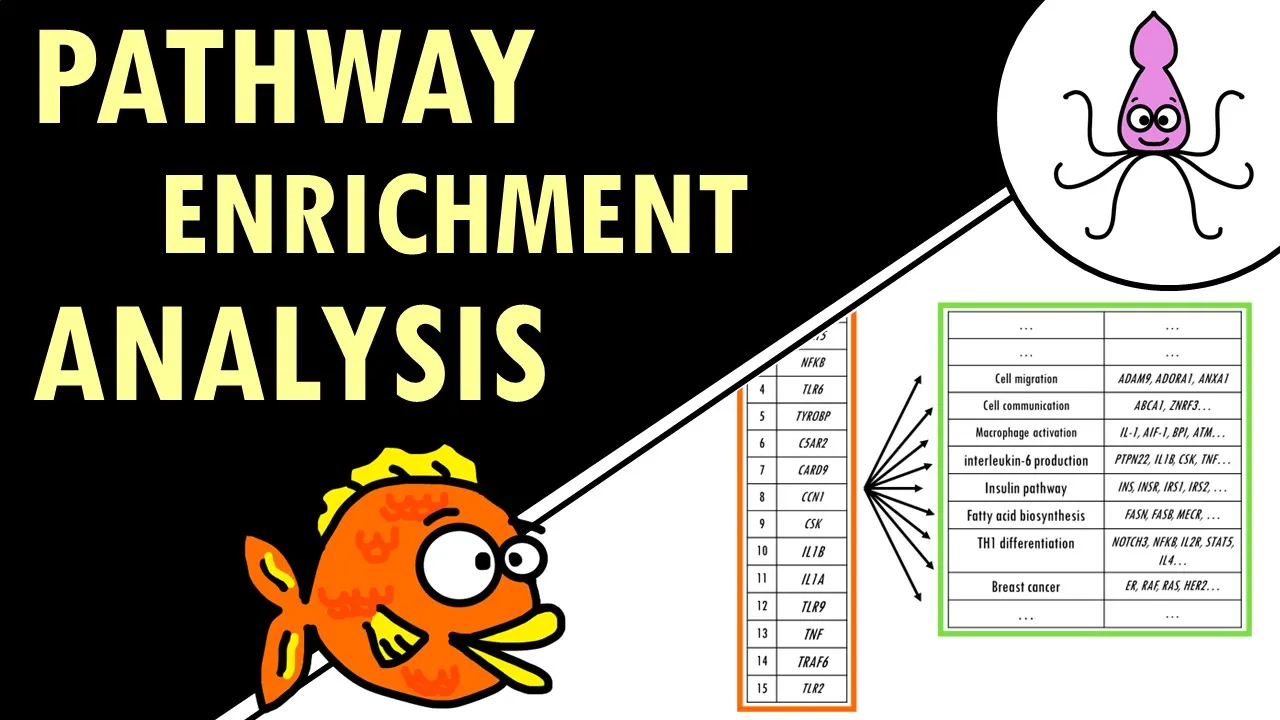
return long lists of differentially expressed genes for example in the order of hundreds or thousands so this is our list how do we even start interpreting this I mean we could get a few students to manually search each gene individually for us but that might take a while is there a better way to summarize this long list of genes and interpret hundreds of differential Express genes at once well a common approach is pathway enrichment analysis its name gives you a clue of what it does it basically summarizes the long Gene list to a shorter and
more easily interpretable list of Pathways so instead of having a list of I don't know 2000 genes you might get a list of 50 or 60 biological Pathways and of course you can then check which genes are Behind These pathways so how does pathway enrichment analysis work pathway enrichment analysis needs three ingredients first of course your Gene list of interest for example a list of differentially expressed genes which you want to summarize second a list of background genes for example all the genes in the human genome the finally it will take a list of Gene
sets Gene sets are basically groups of related genes we'll go a bit more into that later on so of course for the algorithm to know if your list has a lot of genes related to breast cancer or apoptosis or cellular respiration you need to tell it which genes are actually involved in breast cancer apoptosis and cellular respiration anyways what we do essentially is compare our Gene list to the background list to check if there are certain Pathways over represented this essentially tells us that our list of differentially expressed genes includes a lot of genes involved
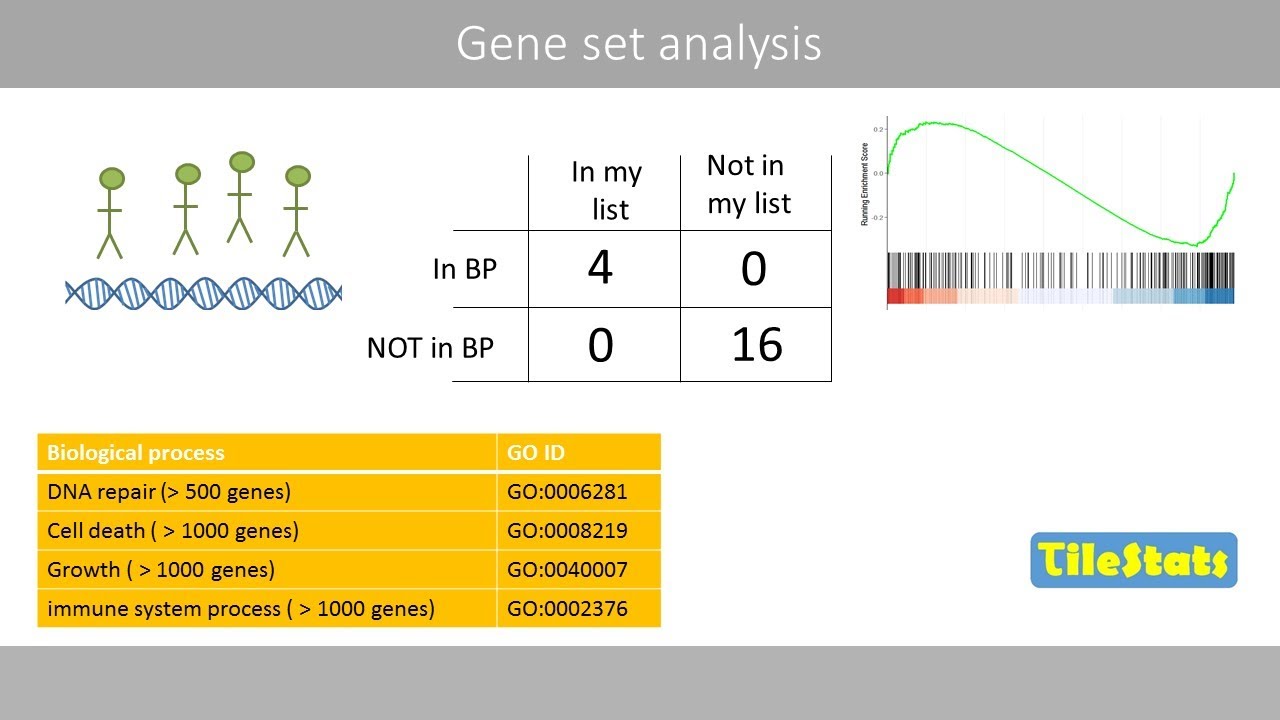
in T cell differentiation okay let's go back to our example alcoholic liver disease usually involves a lot of inflammatory processes which usually involve pro-inflammatory cytokines like interleukin-6 or il-6 so is there an association between our genes um differentially expressed in alcoholic liver disease versus healthy cells and interleukin-6 production in other words is our list of differentially expressed genes enriched with genes involved in il-6 synthesis pathway to answer this question we can build a contingency table this will help us determine whether the fraction of genes of interest in the pathway is higher compared to the fraction
of genes outside the pathway so the background says okay let's take this slowly we have a column for differentially expressed genes and a column of non-differentially expressed genes and then two rows for genes that are annotated as being involved in il6 production and genes that are not involved in il-6 production will simplify things a lot and we'll just look at 30 genes of those 30 genes 15 were differentially expressed genes and of those 12 genes were associated with the gene ontology term interleukin-6 production so we found that 12 out of 15 differentially expressed genes were
involved in interleukin-6 production we could quite confidently say that our Gene list is enriched with genes involved in il-6 production okay but what if there were 9 out of 15 differentially expressed genes hmm obviously we need an objective statistical test to determine what is enriched and what's not there are many methods out there but the one that is commonly used in pathway enrichment analysis is Fisher's exact test now I won't go into details in this video but the point here is that you will obtain a p-value for interleukin6 production which will tell you if that
pathway is over represented in your list of genes if your p-value is really low you can safely say that your list is over represented with genes involved in il6 production in other words il-6 production is an important pathway in alcoholic liver disease compared to healthy liver cells but careful it does not mean it's upregulated you would have to check the genes that are actually over represented in your list and see if they are positive or negative Regulators of that pathway nice so this is what pathway enrichment analysis is all about you summarize a long list
of genes to a shorter list of Pathways with their p-values obviously it does it not with one but with thousands of pathways and this brings us to a big problem the big problem is called multiple testing basically because you are repeatedly testing a lot of Pathways some Pathways will get apparently significant p-values just by chance so we might get results that are a bit unexpected or that just don't make any sense to solve this problem we need multiple testing correction the most commonly used method is the benjamini hawkberg correction now if you're not familiar with
multiple testing or would like to know more I suggest this other video which I will link in the description down below in any case enrichment tools will both test for significant enrichment and then correct for multiple testing so in summary pathway enrichment analysis will take your Gene list of interest and compare it to a list of background genes to check if there are certain Pathways over represented so it checks the fraction of your genes annotated to a specific Gene ontology term and then it checks the proportion of genes in your background set so in the
whole genome let's say that are annotated to that Gene ontology term and it gives you a p-value which tells you what is the probability that that pathway is actually over represented in your Gene list and it wasn't just coincidence to be exact and you might want to take a deep breath here the p-value of a pathway is the probability or chance of seeing at least X number of genes out of the total n genes in the list annotated to a particular Gene set term for example th1 differentiation given the proportion of genes in the whole
genome that are annotated to that Gene set term anyways what's important here is that The Closer the p-value is to zero the more significant the particular Gene ontology term associated with the group of genes is so the less likely this was all just by chance okay let's talk a bit more about your Gene set there are many databases of Gene sets out there some of the most widely used are Gene ontology or go cake or reacto Gene ontology basically focuses on biological processes keg is more focused on metabolic pathways and reactome is a curated database
of human molecular pathways but Gene sets are not restricted to functions their Gene sets for diseases which gives you groups of genes associated to different diseases tissues which gives you groups of genes expressed in specific tissues transcription Factor targets which tells you which genes are the targets of different transcription factors the list is endless okay so super important to choose well your background genes let's go back to our example of liver cells if we use all the genes in the human genome as a background and we perform enrichment analysis it will probably tell us that
our list of differentially expressed genes is enriched in liver function pathways I mean it's true but it's not very helpful instead we might want to use as a background list genes that are expressed in liver tissue and remove those that are never expressed in liver for example heart specific genes that way it will tell us which specific functions of liver cells are over represented in our analysis so we need to choose custom background Gene set that can be measured in the experiment if we're dealing with liver cells then exclude genes that are specifically expressed in
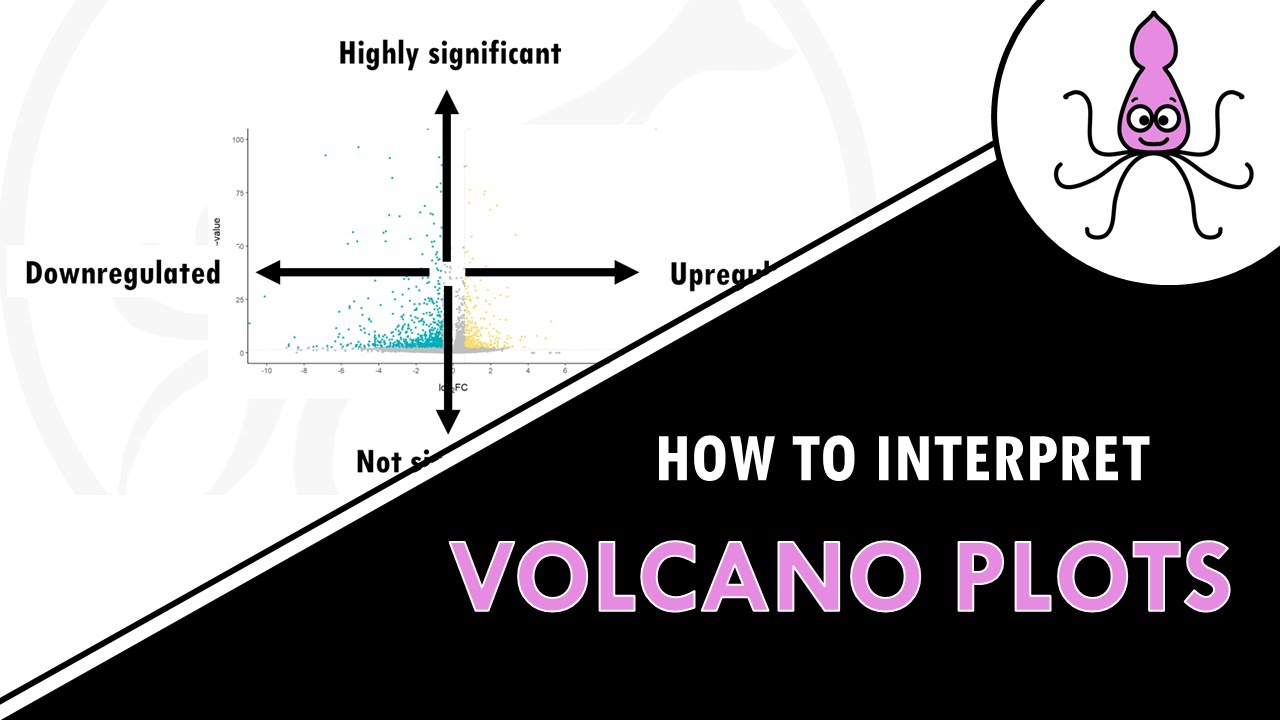
other tissues phospho proteomics experiments for example measure only proteins with one or two more phosphorylation sites so our background Gene sets should only include genes encoding phosphoryl proteins so basically genes that we can actually measure if we take into account how our experiment was designed otherwise pathway enrichment analysis would reveal inflated p-values for General processes such as kinase signaling and protein phosphorylation finally our Gene list results from gene expression analysis often look like this some genes are down Regulators some are upregulators some don't really change some changes are significant and some are not significant at
all if you use this list for pathway enrichment analysis it will not take into account all that information it will also match genes that are not even differentially expressed so of course you need to First filter your results by significance and fold change to keep only differentially expressed genes the genes of Interest of course the results can change a lot depending on the cutoffs you set to say what is a differentially expressed Gene and what is not is there a more objective or unbiased way of doing this for example by taking into account the significance
and strength of the changes which we have anyway of course there is in the next video I will talk about Gene session enrichment analysis and why it is a great pathway enrichment analysis method and that is all for today squidtastic I hope this video gave you a clear overview of pathway enrichment analysis and how it works if you like this video please let me know and also let me know what other topics you would like to cover next have a great day and see you in the next one