- More than half the world's population is now urban. Geographic information in maps are helping city governments become more democratic and participatory. - Portland has invested in geospatial technologies because it saves us money, it improves our services, our relationship with the people that we're here to serve.
- We created Portland Maps to give easy access to citizens for crime data, transportation, property information, where all the pipes are, the utilities, all sorts of information. We like the fact that the general public can get access to all of the types of data that we see here at the city. - Our system is called Transit Tracker.
We were one of the first in the country to implement computers and GPS on board all of our buses. We've got this centralized database and all this information, and real-time location of the buses is available for everyone through the internet and our customer service department. - What time were you thinking of?
- Because of that, we're able to build mapping applications that allow better-informed decisions. We can see that the number 15 is due to arrive in nine minutes. We can also turn on 6-inch aerial photography.
We also have links to street view so that people can know what to expect. Let's pull up more detailed information about that stop, for instance, crosswalks, curb cuts, lighting. If someone has a disability, knowing if there's a crosswalk or a curb cut there is very important.
Some of the applications provide real-time information out in the street. This application is called PDX Bus, and right now, it's using GPS and our services to tell you that the eastbound Max, it's arriving right now. - Because of Civic Apps for Greater Portland.
- Our mayor challenged us to create a way for mobile users to catalog issues around Portland. PDX Reporter is an app that anyone can install on their mobile phone. We have some graffiti.
You can take a photo of it and send it in with the GPS coordinates. - Suddenly, I had tens of thousands of eyes and ears because of PDX Reporter. It gives us good feedback in real time that's geographically coded and therefore useful for us to follow up on.
- As soon as I submit the report, I'm actually able to get back a detailed status of where this incident is at in the city's system. - The Bureau of Planning and Sustainability does long-range planning to inform future development or redevelopment. What do we want the city to look like in 25 to 50 years?
There's an awful lot of analysis. You have to address economic development. You have to address housing.
You have to address environmental issues, et cetera. We couldn't do any of this without GIS. For the first time, we have a 3-D building model for the whole city, and that's possible because the whole region now has LIDAR data.
- With LIDAR systems, the satellite or aircraft beams down to the Earth. The beam bounces back up. They gather information based on the return of objects on the ground.
So you end up with a very good terrain model. - At laser-point accuracy, literally, and we can take our information and actually start to visualize things three-dimensionally. - Instead of worrying about, "What if a proposed building threw a shadow all over the park?
" we did a shadow analysis using the GIS to calculate that it doesn't really impact the park. People went out and measured it, and we were within two feet, I believe. The city says you can't build anything that's gonna block the view of the mountain from up on the hills.
With the GIS, we're able to do sightline evaluation to prove that proposed buildings would not block the view of the mountain, and that made people happy. The city has set a goal that 90% of all Portlanders will live within walking distance of most of the things they need by 2025. It's really resonated with the public.
So we did a statistical analysis of the areas that are not 20-minute neighborhoods: they don't have any sidewalks or the terrain is too steep or there's no transit here or there's no grocery store. So there's all sorts of things that we can answer now because we can overlay all of this data, one on top of the other. - I think our investments improve the way that we perform our work as a city government.
It just makes good business sense. - Geospatial technology allows us to turn data into knowledge. When you have 60,000 drivers, if I can just reduce one mile per driver per day, that's more than 20 million miles a year.
That's tires that aren't being wasted. That's 2 million gallons of fuel. That's 20,000 metric tons of carbon not going into the air if I can just save one mile.
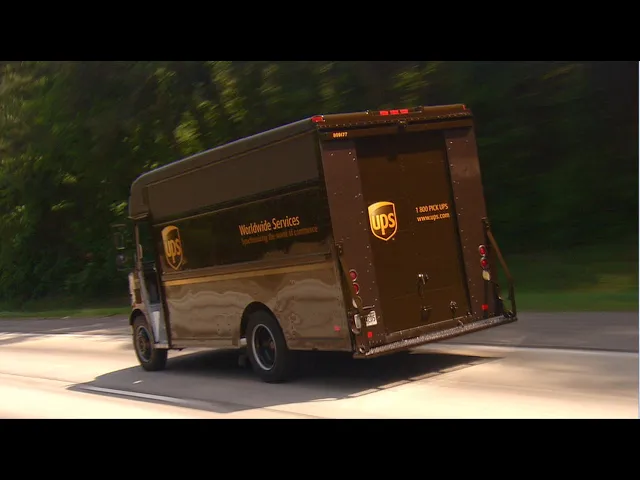
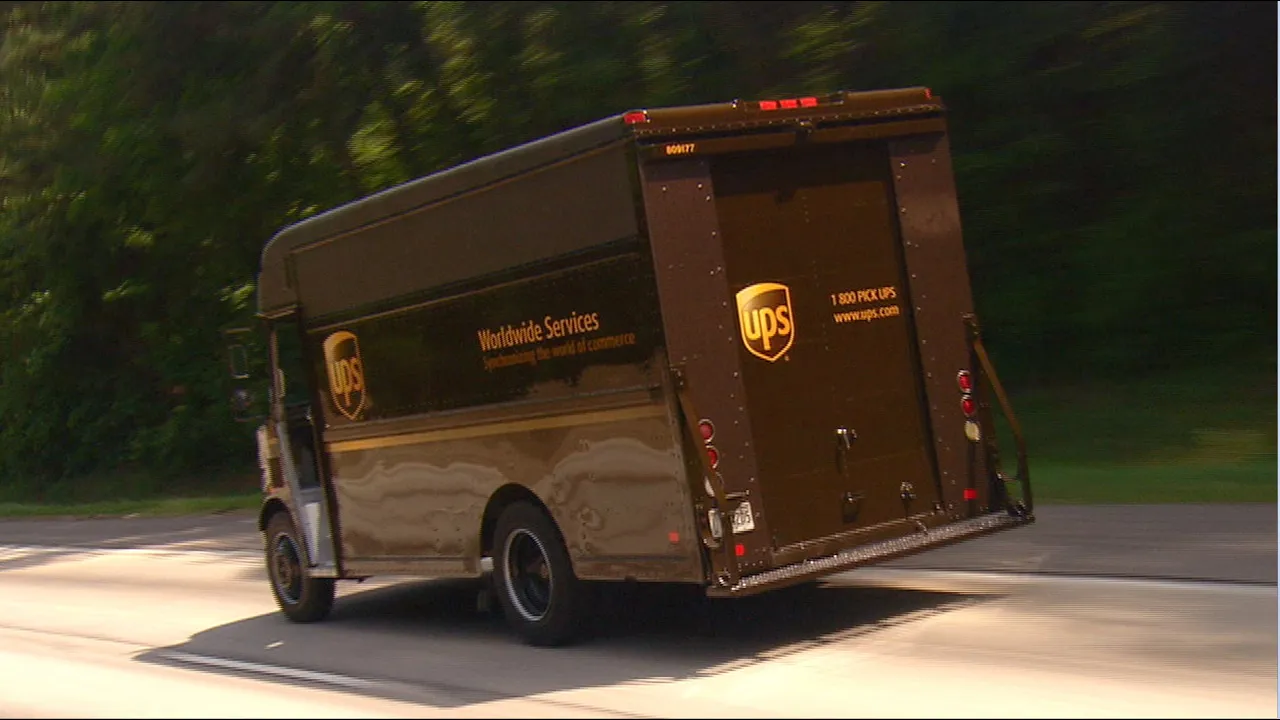
We spend about a billion dollars a year on technology to make that happen. - In an average day, I will do 115 to 125 stops. I'll travel probably anywhere from 120 to 140 miles, depending on he route of that day.
- Some packages have to be delivered by 8:30, some by 10:30, some by noon, pickups in the afternoon, and then some special things for customers. So our mathematicians, or our operations researchers, by using the data from the geospatial technologies, use analytics and create algorithms to take this huge amount of alternatives and turn that into the route that's the best for today. - Have a good day, people.
So when a package comes in the building, we print out a label, and that tells us what package car it goes into, where in the car it goes, what order the driver is going to deliver it. And then we move the electronic data into the driver's handheld computer, so they have that at the same time. - Scrolling.
It looks like the flow's pretty good. - We may want to change the time on that pickup. - Make that a 1:30 - This little device gives me a pre-planned ideal way to deliver things and what my day's going to be.
I look at the delivery order listing so I can envision how I'm going to do things, whether I want to make changes or whether I agree with it. It's quite the tool to have. - It has a GPS chip inside of it, a communication device.
So every time a driver makes a delivery, we transmit up and say, Here's where the driver was at that moment. " In the center, where the operations are occurring, they have a map and they can see every driver in their delivery territory and where they are in near real time. So if a customer calls and says, "I need an on-demand pickup," we can look and say what driver is the better driver to give it to.
So she takes it, she drags it over to the route she wants to dispatch it to, automatically goes into that driver's handheld computer, and the driver says: "Yep, I can do it," or, "There's something I know you don't; sorry, I can't," sends it back. - Telematics yesterday: phenomenal results. We had one seatbelt event yesterday.
Telematics helps me communicate with my workforce. I have real physical data that I can give back to them that we can use for improvement in the operation. - We put sensors on a vehicle to tell us if the vehicle's backing, if the driver's seatbelt is on, if they shut the door behind them.
- The biggest thing is the safety perspective. How about this one? I can look at the speed that they're traveling throughout the day; I can look at whether they stop at a stop sign.
Now, let me ask you about this one, since I got you. I can see how far they backed their vehicle up. Was there a reason why you backed out?
- That is a 55-mile zone, and I'd just rather just stay out of the way. - So you backed in the lane to avoid the curve? - Sometimes the driver says, "No, I consciously did that.
" - Okay, that makes perfect sense. - And that conversation can make our people and customers more safe. When you see little red circles, that's where something's wrong with the map.
It takes a human along with the software, and sometimes we have to call the best experts, and that's our drivers. - We use this tablet to plot roads that either don't go through, or we wouldn't send a package car down it; there's better ways to deliver from point A to point B. We're looking for, also, new developments.
Many times, with GPS data, new developments come in, and the map data just hasn't caught up with it. - So if he brings up some readings of where drivers have driven, there's a road missing, he'll draw in the road, everything will snap, the red dots will go away, and we've updated that portion of the map. The world changed around us, so we took all that information that's in people's heads, and we put it in computer systems.
And we put it all on a map. We've moved from being a trucking company that has technology to a technology company that just happens to have trucks. - Six years ago, many neighborhoods had alarming rates of obesity-related conditions like heart disease and diabetes.
Six years ago, this city had fewer supermarkets per person than almost anywhere in America. If a mom wanted some fresh fruit for their kid's lunch in this community, she would have to navigate public transportation with big bags of groceries just to feed her kids. - That would not be a big deal if most of us had vehicles, but most of us don't.
People had to shop at corner stores. Their food was horrible. They had to buy things that wasn't nutritious for the kids.
So that's how we set on the path to get a supermarket in this community. - We're trying to figure out ways that supermarkets might be able to come back into neighborhoods. Here at the Food Trust, we develop GIS maps to describe problems in the community to stakeholders.
We see where different factors overlap: where the supermarkets were and weren't, where the people were and weren't, and then you overlay poverty or lack of poverty and diet-related disease. And then, voila! There's our space that we really need to target, and policymakers and community members could really get a look at where we should really focus our effort.
- Having a very clear graphical presentation really helps you get these projects done. The Food Trust said, "Hey there's a legitimate need here. " And as soon as possible, we opened the first store.
- This has opened up a whole world for us bringing up young people and teach them how to shop, how to deal with nutrition and to be healthier. And healthier children do better in school, and it's just a wonderful thing. - You all took a stand, a really important, collaborative stand.
If you can do it here, we can do it in underserved communities all across this country. - You could throw a lot of statistics at it, but there's something about seeing a map that speaks to people, especially policymakers, seeing highlighted in red your neighborhood as an area of high need. Projects are being funded, stores are being built because of this initiative.
That should really raise the bar for other states wanting to know, "Well what can we do? " - I believe that we're at the point where technology that's been growing over the last three decades is now ready to explode. New people, new organizations are building applications we've never thought of before.
- Geography is now all about technology that's gonna help make your life better. The data is out there, the maps are available, and we as regular people can understand and take advantage of that. - I think that the idea of people really knowing the whole planet as well as they know their own neighborhood is going to transform what it means to be a human.