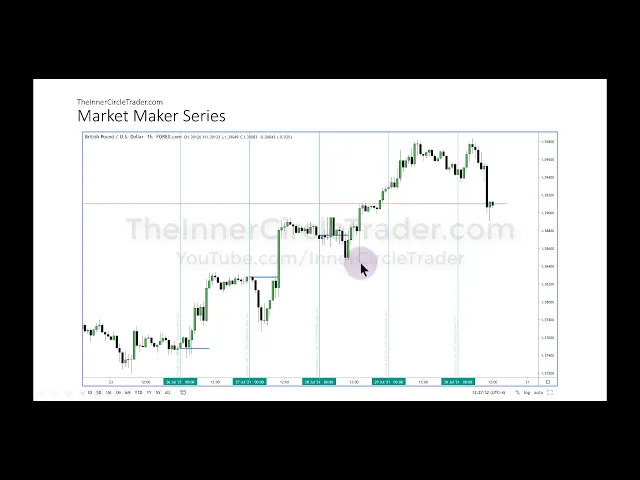
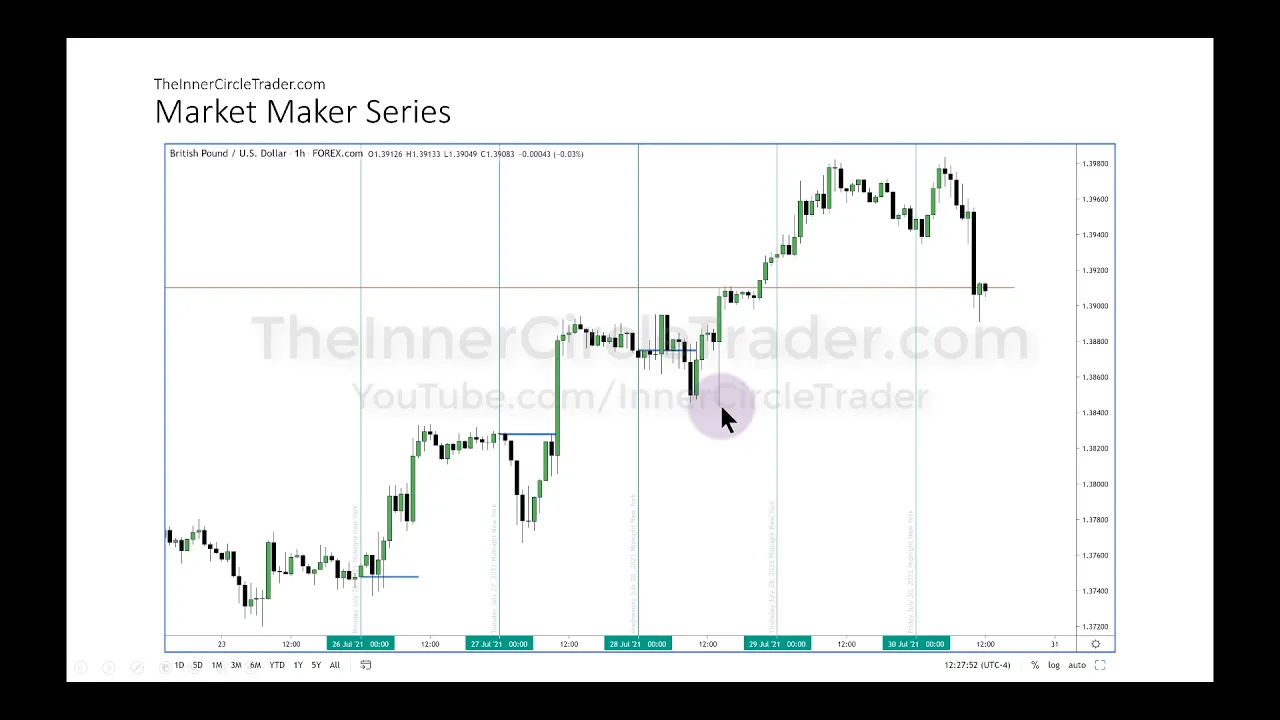
oh all right folks welcome back this is volume four a continuing series of five parts on the inner circle trader market maker series i'm gonna be teaching time and price theory all right keeping in sync with our present market conditions and what has transpired this week in pound dollar no better way to learn how to do something than to apply it to a chart that's actually trading and you watch unfold this week we have the hourly chart here on british pound versus us dollar and with all the things that were mentioned covered in the previous volumes of this series if you haven't watched obviously part one two and three of the series then you should not be watching this video yet because it's kind of requirement before you get to this but the backdrop behind it is we've had smt diversions down here we've cleared out daily cell stops so we've accumulated we have a market maker buy model underway and if that's what you're expecting and your analysis leads to a run above these relative equal highs and above the original consolidation here in the market maker buy model let's incorporate the elements of time and price so now i have the daily dividers on and how i did this in case you're wondering if you're new all i did was create a vertical line and dropped it on the zero zero level on the time axis down here that's going to be midnight new york time if you have your time it's important that you have your chart set to new york local time that'll make understanding what i teach easy to follow along because your charts will look like mine and also you'll be looking at through the lens of the algorithm so new york midnight time is delineated each day so we're looking at obviously today's trading in friday thursday's trading wednesdays trading tuesday and then finally monday's trading of this week now when you're looking at this go back and look at your notes and we've outlined how this week of trading july 26 2021 to july 30th 2021 was bullish four pound dollar i made the case for why it was bullish i pointed to where it was going to go how it was going to trade there and we have it here now in hindsight so if you look at each individual day as one-fifth of the weekly range each of these days have specific characteristics that are repeating in nature now they're not always exactly the same each week but what i'm going to teach you here i've covered in other lessons in this youtube channel but for continuity sake and kind of like bring everything that you should have collected along your journey through all my videos here we're looking at the delivery of the weekly range and if we're bullish the expectation is that there's a 70 percent chance that the low of the week is going to form on monday tuesday or by wednesday's new york session now right away you're probably thinking oh that's that's a pretty wide envelope of time you got a lot of ways to you get it wrong well consider what we have here we have monday's trading we're already in a consolidation and we left the consolidation so is it likely to come back down and go below this low here when it's already taken out a low there remember what i've taught you so far in this series before price movements that are directionally driven typically opposing stop losses will be taken and then price will be allowed to deliver in your expected direction in layman's terms if you're bullish look for swing lows to get traded below and then it starts to move higher short term low trades below it then it starts to trade higher okay each day of this week was predominantly bullish until we get to friday obviously that ends the week so if we look at a open high low close perspective of the week we see the week opening here small little movement lower creating the low of the week on monday a retracement and a buying opportunity on tuesday a retracement buying opportunity on wednesday and then thursday creating a short-term high of the week and then friday we went just above the thursday high but not by much and then we traded off the high and we're probably going to close anywhere between 139 20 and 139 big figure okay so going back to what i mentioned here and what i've taught in other lessons on this youtube channel is that we want to be buying on monday tuesday and at the best case scenario if we missed buying opportunities on monday and tuesday we want to try to buy on wednesday in the new york session okay but we'll talk more about other things that were factors this week as we go into the series in part five but for now i want to bring in the opening price each day here at midnight so we have this opening price here extended out in time how far is this going out it's just showing until 10 a. m you can take it out till 11 a. m which basically is the heart of london close so the idea is if you're bullish you want to be buying at or below or very close to the opening price each day we see it trade below the opening price and rallies up day here opens and trades down all through london and then rallies higher on the day opening price here we initially start to go higher but then we trade down below it and then we have another whip saw below the low here on fomc and then trades higher and then on thursday we're not incorporating the opening price on thursday and this is for your notes make sure you write this down we're only looking for the influence of the opening price and buying below or at it in a bullish expected week on monday tuesday and wednesday thursday and friday they tend to create the opposite end of the weekly range okay so try not to be looking to be a buyer on thursday try not to be a buyer on friday with the weekly range expectation if you do that you're going to miss trades yes but by far and large you're going to protect yourself by avoiding being a buyer in a market move it's already been moving okay obviously there's going to be days where it just continues on thursday and then friday really explodes even higher i've seen it happen in my own trading i've missed pretty big moves on friday but i generally keep a small piece on as i illustrated this week with trading the fomc day so i bought on this day i bought on this day here and i recorded and shared the fmc trade and put it on my telegram channel you can see that and left a small piece on it got me out at 139.
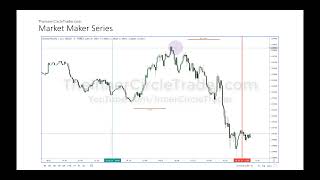
50 on a limit so you can design this any way you want you can create a model where you get in on a tuesday after you've seen monday prove that it's wanting to go higher and then trades down below some short-term low picks up the stops and we have optimal trade entry here and you can be a buyer there and basically allow money to trade without you or if you're hardcore and you're in consolidation like this and you think you are in a move where it's here and you start to go higher rate from monday's beginning of trading then obviously you can put a small little position on there and then consider maybe taking a larger position once you have a better confirmation of the weekly range unfolding to the upside and a retracement down as a new student or a new trader when you see a day like this and most of you probably have one in five minute charts up on your chart you see this decline like it's heart stopping especially if you don't have any experience you're thinking there's no way i could be a buyer or that well we have relative equal highs the bottom line is it's going down to pick up the sell stops flood the market with sell stops allowing smart money to buy those sell stops and then it takes off and goes higher each day or this week between monday and wednesday is offered a buying opportunity to get us above our target that was established for the weekly range was trading above here for the buy stops so let's strip this down and go a little bit closer so we're zoomed in on an hourly chart you can see here's monday's trading tuesday's trading sweeping below that short term low there and rallying and we drop down here on fomc wednesday it starts to come down and give us a buying opportunity here but then on fomc two o'clock in the afternoon new york time the market whips down knocking out traders that would have already trailed their stop loss right below that low it gets tagged and then it runs aggressively higher above that original consolidation which is that red line here so above that red line is our buy stops that we were aiming for that i started teaching you about in earlier parts of the series in the earlier portion of the week then ultimately we trade creating a short-term high on thursday slightly higher on friday and then profit-taking model kicks in and you can see it returning back to that original consolidation study the relationship of the opening price at midnight in new york time and how buying below that opening price is ideal this is where smart money accumulates longs this is where smart money accumulates longs and this is where smart money accumulates longs they distribute their longs on thursday and friday if it offers higher prices and then you expect price to come off that and trade back down into the range which is the highest high formed intra-week to the low and we're seeing that here now if you look at it on a 15-minute time frame i'm going to incorporate day of week and time of day here's that opening price at midnight the market trades down creating the low in london rallies comes back down in for an optimal trade entry if you don't know what optimal trade entry is there is lots of videos on this youtube channel and you can study and find out what that is it's a really simple pattern repeats all the time so it creates an awful tradition right there you can be a buyer there and then trades back down again we have a short term low here and a short term low here and this low is during new york open so short term low here to high down in and taking out a short term low what's occurring they're taking out short term stops right below here and optimal trade entry rallies in new york and continues higher the next day the market trades back down into the range that was established in the previous day this right here is the reason why most of the time i'm leaving monday's trading to everyone else because if i establish along here and it starts to rally up i may make the mistake of trailing my stop-loss up to here and then they take it on tuesday and then i gotta go back in and reposition myself so i wanna study on monday what they do and then on tuesday generally that's my action day and you can see there's a lot more animation in price on tuesday but look what they do they drop it down into london creating the low of the day taking out this short term low again the previous day and if you look at the low to high you're getting optimal trade entry there the key is ote or optimal trade entry is associated with time of day a kill zone these little hyphenated segments of annotation on the charts london is delineated by 2 a. m to 5 a. m new york time so again if you're setting your time on trading view to local new york time always set it to that no matter what location you are in the world always look at trading view through the lens of new york period if you do that everything i teach you will make perfect sense you won't be confused but london kill zone is two o'clock in the morning to five a.
m new york is seven a. m to ten a. m and if you want to use the new york session time not the new york kill zone the new york session time is 8 30 in the morning till 11 a.