"It is unequivocal that human influence has warmed the atmosphere ocean and land" That is a quote from the 1st part of the 6th IPCC report, a scientific work that describes the physical manifestations of climate change and reaffirms the responsibility of human activities. The 2nd part outlines the past, present, and future consequences of climate change, and the 3rd details how to reduce greenhouse gas emissions, which are the primary cause of this climate change. But what are these greenhouse gases?
Who is emitting them? And how? That's what we're going to look at in this video because we need to know the answers to these questions in order to act on these emissions.
Among the greenhouse gases, whose emissions by human societies affect the climate, are carbon dioxide, methane, nitrous oxide and fluorinated gases, which are a group of many molecules containing one or more fluorine atoms. Because of their physical differences, these gases have different effects. First, they warm the planet differently.
Secondly, depending on the gas, the excess added by our emissions to the atmosphere will take more or less time to be eliminated. Fortunately, there is a tool to compare and aggregate the emissions of different greenhouse gases. The Global Warming Potential (GWP) allows us to convert a quantity of a gas into its CO2 equivalent.
Let's take methane as an example. This factor indicates how many kilos of CO2 would be needed to produce the same warming as 1 kg of methane over a given period of time. That's right.
Because of the difference in the lifespan of these gases, we have to define the period considered in order to make a comparison. If we consider the 20 years following the emission, 1 kg of methane is equivalent to 81 kg of CO2. But if we consider the century following the emission, 1 kg of methane is equivalent to 28 kg of CO2.
And if we consider 500 years, we drop to 8 kg of CO2 equivalent. The further into the future we consider the effects, the less important methane is compared to CO2. Within the framework of the international climate negotiations, the convention has been set at 1 century.
This is the convention that will be used for the rest of the video, and it is the one that is generally used for quantifying equivalents in CO2. If we stop here, we may get the impression that methane plays a greater role in climate change than CO2. But we're looking at an effect per kilogram, so you have to multiply that by the amounts emitted.
In 2019, methane emissions from human societies were about 400 M tons and CO2 emissions were over 40 bn tons. With the global warming potential defined earlier, we can convert methane emissions into a CO2 equivalent. This allows us to aggregate these two gases.
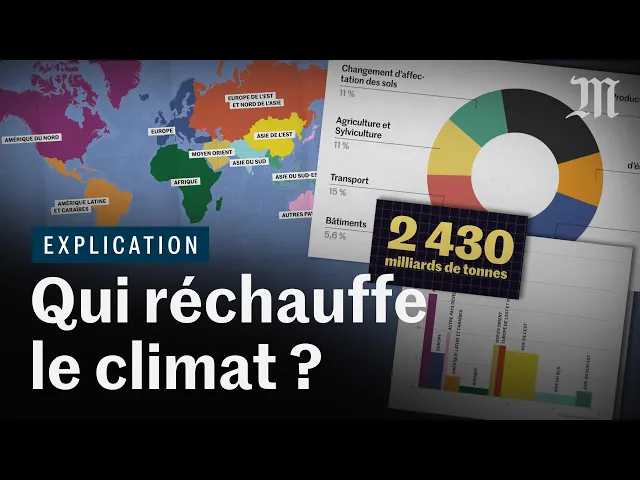
We can do the same work for the other greenhouse gases and integrate them into this representation. In 2019, fluorinated gases will account for 2% of total global emissions in CO2 equivalent, nitrous oxide for 4%, methane for 18% and CO2 for 75%. We now know what these gases are.
But where do they come from? Let's focus first on CO2 emissions. We can trace them from 1850 on.
The annual amount of CO2 emitted by human societies has increased from decade to decade. These emissions can be separated into 2 categories. First, the emissions from what is called land-use change.
These are the CO2 emissions and removals from human-managed land. For example, the CO2 emissions from a forest that would be destroyed to make a field instead. At the global level, you can see that the net effect is an emission of CO2, notably because of deforestation.
Then there are the emissions from industrial processes and especially from the combustion of fossil fuels. They have increased very quickly since 1950. They can be divided into different sub-categories.
Coal remains the fossil resource whose combustion adds the most CO2 to the atmosphere each year, followed by oil and then fossil gas, a more accurate name than natural gas. We can also note cement, the production of which directly emits CO2. These annual CO2 emissions are added to the atmosphere.
As a result, the atmospheric concentration of CO2 has only increased since the industrial revolution and much more rapidly in the last few decades when emissions have been higher. There is a direct and almost linear relationship between this concentration and the rise in temperature. So let's look at the cumulative CO2 emissions.
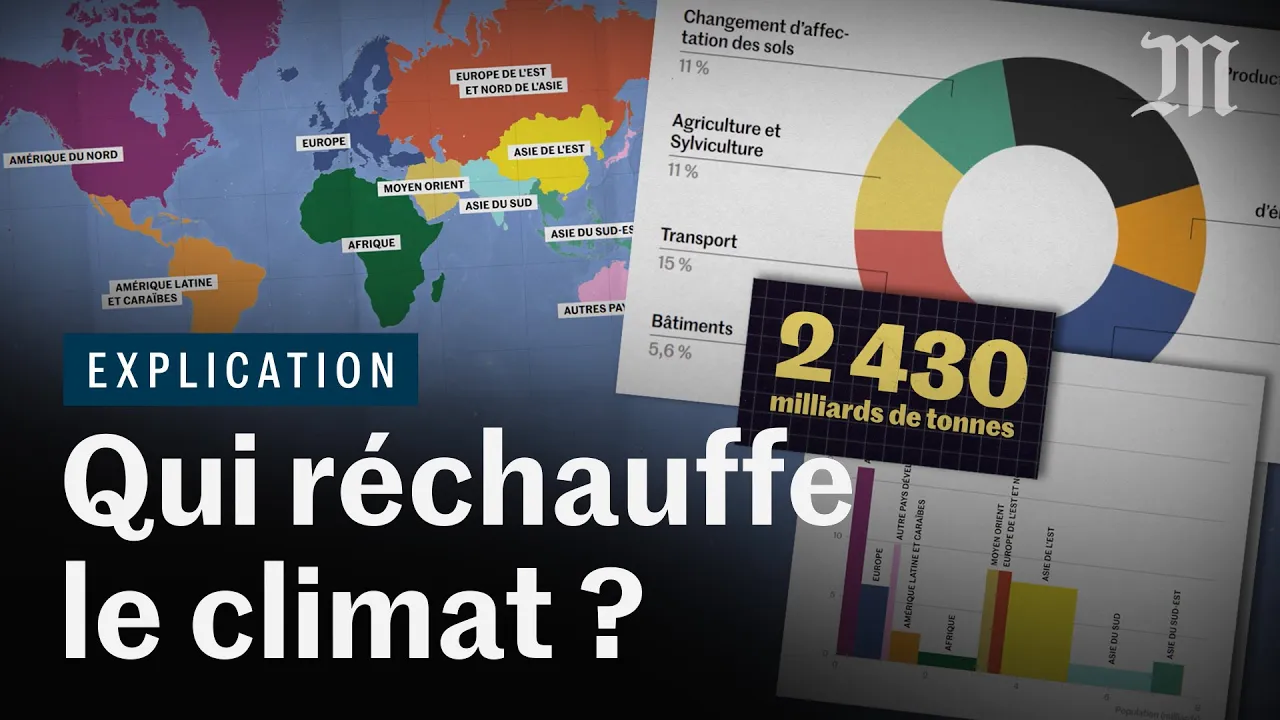
Between 1850 and 2019, human societies have added 2,430 billion tons of CO2 to the atmosphere. Which countries have emitted all this? In order to answer more easily, we must first group them together.
Developed countries are separated into those in North America, Europe and the rest of the world. Then we have a group for all the rest of the Americas, a group for the African countries and another for the Middle East. The rest of Eurasia is divided into a group encompassing Eastern Europe and part of Asia, East Asia, which includes China, South Asia, which includes India, and Southeast Asia, to which we add the developing countries of the Pacific.
If we look at the cumulative CO2 emissions between 1850 and 2009, in each of these groups, we get this. Emissions from fossil resources and industrial processes are shown in black and those from land-use change in green. We also see emissions from international air and sea transport, which are conventionally counted separately.
With this historical approach, developed countries account for nearly 45% of CO2 emissions. The distribution of the historical accumulation is an important element, but it does not tell us anything about the current distribution of emissions. If we take all the greenhouse gases emitted in 2019, we have 59 billion tons of CO2 equivalent.
If we divide these emissions between the groups we have defined, we get this: East Asia, which includes China, is responsible for a little more than 1/4 of the 2009 emissions and dominates this representation. This was not the case for the previous one. But some of these groups are much more populated than others.
To take this aspect into account, we can divide the emissions of the different groups by their population to obtain emissions per capita. This changes the picture again. We see, for example, that per capita emissions are more than 7 times higher in North America than in South Asia.
Now, let's give these columns a width proportional to the population of the group. For each group, the height of the rectangle gives the per capita emissions and the width gives the population. The per capita emissions for North America are 19 tons of CO2 equivalent for 366 M people.
This representation allows us to see, for example, that South Asia, a group containing India, has low per capita emissions, but weighs about as much as Europe in the total emissions, because it is a much more populated region. These greenhouse gas emissions can be broken down into CO2 emissions from fossil resources and industry, CO2 emissions from land-use change, and emissions of other greenhouse gases. Land-use change accounts for CO2 emissions and removals from land managed by humans.
In some regions, deforestation causes CO2 emissions, but there are large variations. In particular, we see the importance of deforestation in Latin America and Southeast Asia. In Europe and North America, there is slightly more absorption than emission, partly because forests are expanding.
I can add one last subtlety, but we need to change the source of our data and only consider CO2 emissions from fossil resources and industry. If a phone is made in China, but used in Europe, should we allocate the emissions from its manufacture to the country of the producer or the consumer? So far, we use a territorial approach for this allocation.
This is the official way of doing it. We attribute the emissions to the countries where they took place. But we can use a carbon footprint approach and allocate emissions according to the country where the product is consumed.
If we take into account the net effect of trade, we get this: Some regions of the world reduce their emissions, notably East Asia, to increase those of others, notably developed countries. Footprint or territorial approach, taking into account only fossil CO2 or all greenhouse gases, emissions per capita or per country, recent emissions or cumulative past emissions. The distribution and therefore our perception of responsibilities change according to what we choose to look at.
This does not simplify international negotiations on the subject. Now, let's leave the approach by groups of countries and look at the human activities that emit these greenhouse gases. When we look at the direct emissions of greenhouse gases by economic sector, we note the important share of heat and electricity production.
Globally, electricity is still largely produced with fossil resources, especially coal. But we can attribute the emissions of heat and electricity production to the sectors that consume them. If we do this, we can see that at the global level, industry, with 34% of direct and indirect emissions, is the first sector to emit greenhouse gases.
If we look at these emissions in detail, we see that 8% of global emissions come from the extraction and refining of metals. After industry, we have buildings with 17% of global emissions, including 11% for residential, followed by transport with 15% of emissions, including 10% for road transport. This is where we are today.
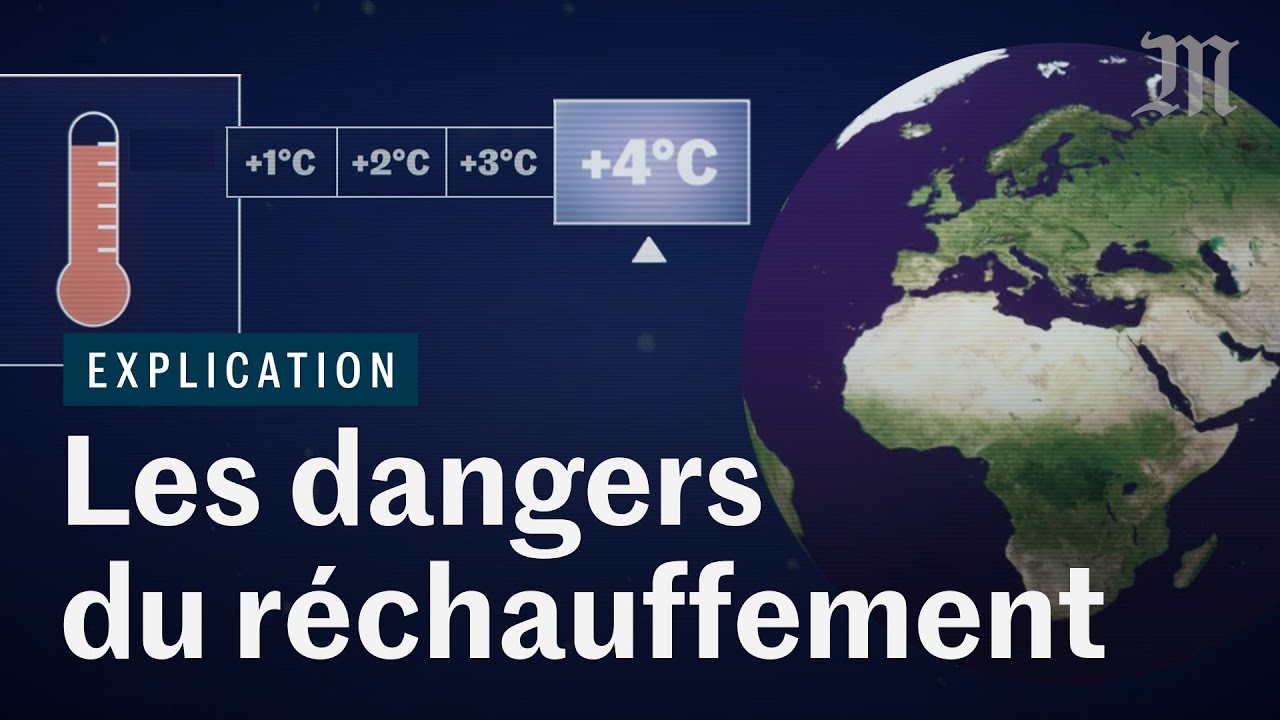
The emissions we are talking about here have not stopped increasing over the last decades. We must act quickly and in a sustained manner in the coming decades if we want to limit warming to less than 2°C, or even less than 1. 5°C.
For that, the last part of the 6th IPCC report identifies many actionable levers in the different sectors we mentioned. For example, the possibility of having more efficient equipment and buildings, among other things via the renovation of buildings already built. Gains can also come from behavioral changes, such as reducing meat consumption in countries where it is high, or reducing car use in developed countries.
Significant reductions can be achieved through the deployment of technologies, including low-carbon electricity generation: wind, photovoltaic, hydro, geothermal and nuclear. Especially since low-carbon electricity opens the possibility of emission reductions by electrifying transportation and heat production. The most relevant levers vary from country to country and depend on political choices.
It is hard to give a quick and global vision, but we already have in our hands solutions that allow us to substantially reduce our CO2 emissions over the next decades. The question is whether we will be able to mobilize them fast enough at the global level. Well, I hope you've enjoyed this video and now know a little more about global greenhouse gas emissions.
For those who would have liked a video on France, don't worry, we are working on it. And you will see that the sectoral distribution of emissions is different from the one I have shown here at the global level. I don't know if it's useful to remind you, but this is a vast and complex subject and such a short format only touches it.
In addition to the sources, I'll leave you some links in the description for those who want to go further. This was Rodolphe Meyer for Le Monde. See you soon on the Net.