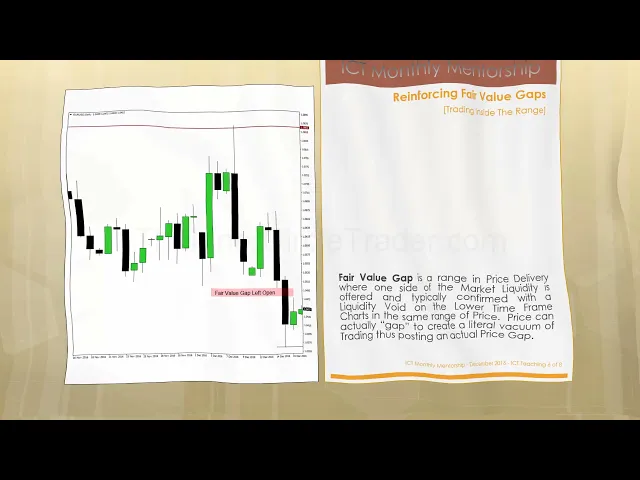
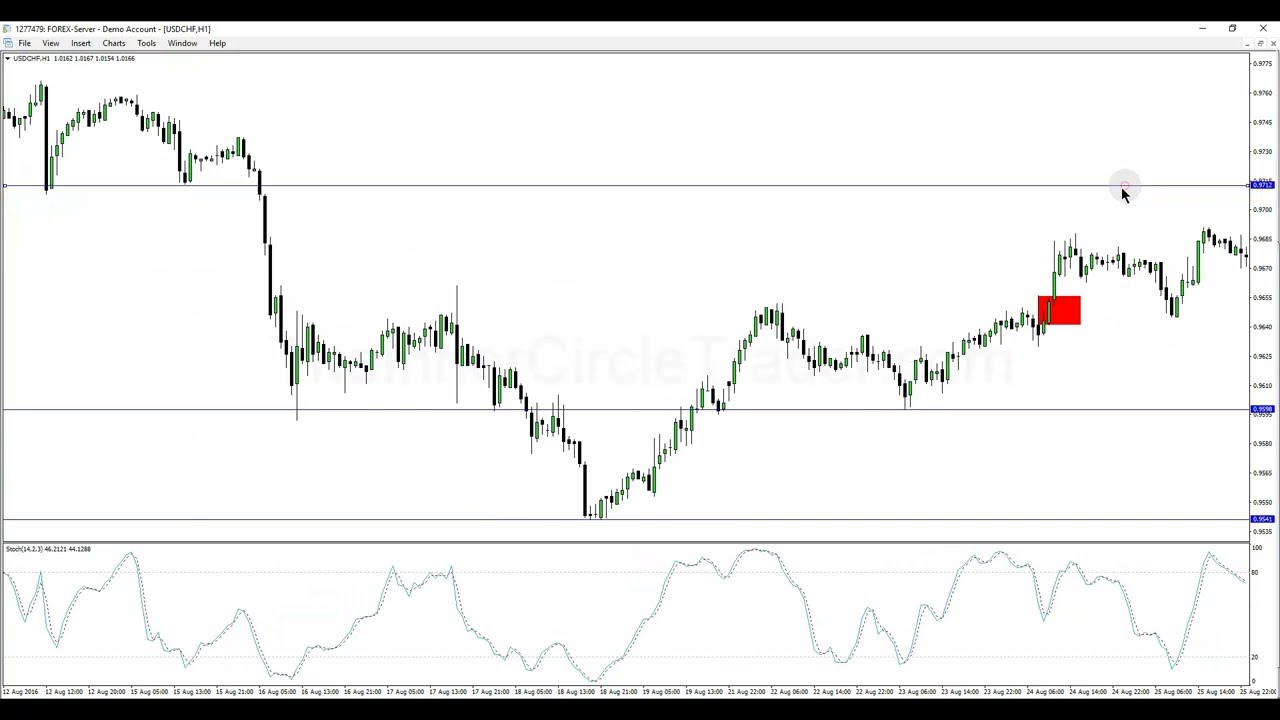
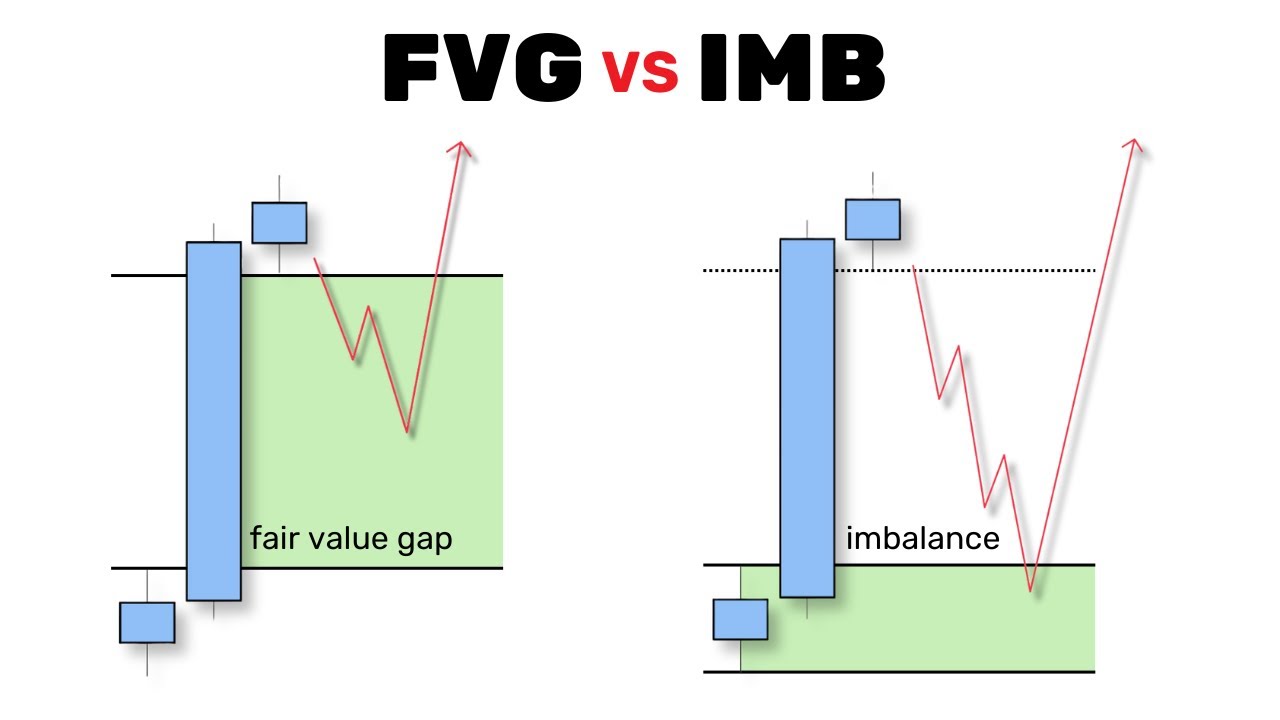
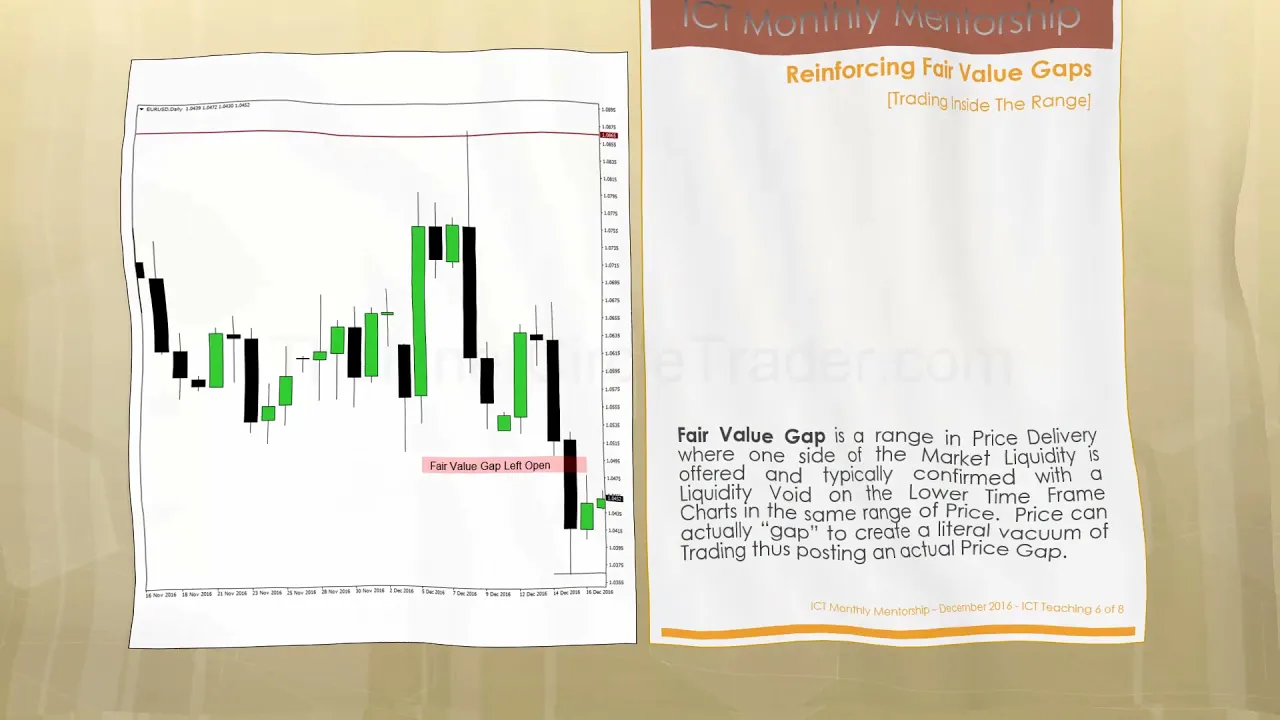
we'll be dealing specifically with the reinforcing of fair value gaps and it's a concept of trading inside the range okay what is a fair value gap it is a range in price delivery where one side of the market liquidity is offered and typically confirmed with a liquidity void on the lower time frame charts in the same range of price price can actually gap to create a literal vacuum of trading thus posting an actual price gap okay let's take a look at a euro dollar daily chart okay and i'm going to ask you where do you see an example of the fair value gap okay i'm going to draw your attention to it here it's a blue shaded area here on the daily chart let me explain to you why i'm shading in that specific area of price it's about a 20 pip range on the daily but inside of that blue shaded area that is what is common referred to in my work as a fair value gap so take a look at what makes that gap so significant as you can see here the candle to the left of the down candle we're looking at that comprises the fair value gap that's this candle here okay and to the left of that we have the higher bearish candle and i'm drawing attention to the fact that it has a down close but it's come off the low okay so we're looking at the low up to the close that little wick in there if you take that same range okay and you look at our down candle that created that fair value gap on the daily chart that range between 105 15 to approximately 105 big figure inside our down candle and in this candle here that's highlighted from the low to the close that price range has been traded up into once already delivering the buy side liquidity in other words on this candle's low up to the close price had come off that low so if it came off that low to have a higher close on that candle that means the buy side liquidity had been offered on that range between 105 15 to 105 big figure so that means when we look at the down candle that makes the fair value gap we're not concerned with the 105 15 to 105 big figure price range so we're going to be drawing our attention to that low here and we'll draw that out in time but let's now look at the other candle that frames our fair value gap the next area at which we see buy side liquidity offered is from this green candle or up close candle to the right of our down candle that makes the fair value gap the open to the high on this candle has offered by side liquidity as well so we have seen price offered on the up movement or buy side liquidity on two candles one to the left of our fair value gap creating down candle on the daily chart and one candle to the right of it where we saw price move higher in portion of that down candle so we have a range left that's open and it specifically is this area right in here so we're delineating the low of the previous candle and the high of the count to the right of the down camera that creates that little pocket of space so between 105 big figure down to 104. 75 about 25 pips that is our fair value gap and it's been left open there's been no trading outside of the movement of that range except for that down candle and no up movement at all on this time frame now when we're looking at fair value gaps okay it's important to remind you that if we're studying a specific time frame the gap occurs on the time frame you're looking at you can break this down further into smaller time frames but in the smaller time frames you'll probably end up seeing a liquidity void where the gap would be indicated here on this time frame on a lower time frame it would many times appear as a liquidity void where it's multiple candles that create that open space of range okay so now we have our daily chart here we have our specific levels in mind that we're watching and the two little line segments delaying one candle is low and one candle is high in between those two reference points we have that big down candle and the exposed area in between that is the fair value gap that only the cell side liquidity has been offered so imagine that paint brush analogy i've used many times in the past on the down candle that creates the lowest low here there's a range with the candle before it and the candle after it where it has left a pocket of porous price action or only delivered on the downside we're going to expect price to eventually want to trade back up into that little gapped area so this area in here that's where we're looking to see it fill in that's the nature of a fair value gap so when we look at price and we're zoomed in a little bit now here with a four hour chart okay and you can see that the two specific price levels again are delineated as well and we have a low delineated for potential liquidity run on sell stops below the low price does in fact go down below that previous low and well now we can expect to see what form a turtle suit or false break below an old low why would we reasonably expect it to go back up to fill in that gap well because we've already taken the sell side liquidity out by running an old low we have equal highs here delineated also on our chart on a four hour basis and right above those equal highs we have our fair value gap eventually price does in fact trade back up closes the fair value gap in that trade or that idea is now complete while it doesn't look like a great deal of money or pips offered it's a very highly profitable and probable condition in the marketplace where we can see these fair value gaps and double tops where buy stocks will be resting above it and if you see a turtle soup run below an old low you're in a range this time of year going into the end of the 2006 trading year going into the holidays uh trading is going to be range bound and when you're in a range bound consolidation type format or profile for the marketplace this is the style trading you want to be doing looking for stops and looking for fair value gaps so it was well over 100 pips of a move and it only took about two days to to complete that little price swing and in fact this range of price action in the form of a fair value gap was actually detailed to you in the beginning of this week where we delineate it on the daily chart the fair value gap as outlined here and on the daily chart you can see it's been filled in here so while there's a lot of information about fair value gaps and breakaway gaps and measuring gaps that's going to be coming your way in the form of the december study notes just understand that everything has been shown here is reversed for buy side liquidity runs where the market will come back and closing a fair value gap that's below the marketplace to seek to fill in the sell side liquidity i want to take a quick look at something else because i mentioned that the gaps fair value gaps liquidity voids order blocks and liquidity pools they kind of overlap a lot of in a lot of different ways that you're probably not aware of yet and that's what the benefit of having the pdf files study notes and also the supplementary teachings that's going to happen next week monday through friday while we're away from live trading and live sessions with the ict mentorship you will be getting a daily video supplementing these specific techniques and concepts for the month of december so to help you really dial in on the concepts going forward so that we are prepared and primed for the content for january 2017. but i want to take you back over to the charts and give you something by way of understanding the overlap of liquidity voids and fair value gaps okay folks we're looking at at 104.
75 level i have the charts trained in on a five minute euro dollar and we're seeing the very moment that that 104. 75 level was pierced here on the 19th this is the second time it trades through that 104 75 level and i want to just draw a special attention to this area up here okay and now i'm going to show you what it looks like when we have a a run above an old high which is what this is 104. 75 it's also run on liquidity in the form of a liquidity pool so it's running buy stops but also it's hitting that fair value gap also so straight into the fair value gap and i said in lower time frames many times this will create a liquidity void you see a movement lower here on this candle and then we have another candle here look what happened the next candles open is down here so you have this gap in here so price trades up into that and closes that in right there see that price then moves lower significant break lower and then lower and ultimately trading through to where the cell stops were mentioned earlier okay let's take a look at it on a 15-minute basis here's the first time it trades up into that 104 75 level closing that fair value gap and then here's the second time it trades up into it running out the previous high the previous high this time was at 104.
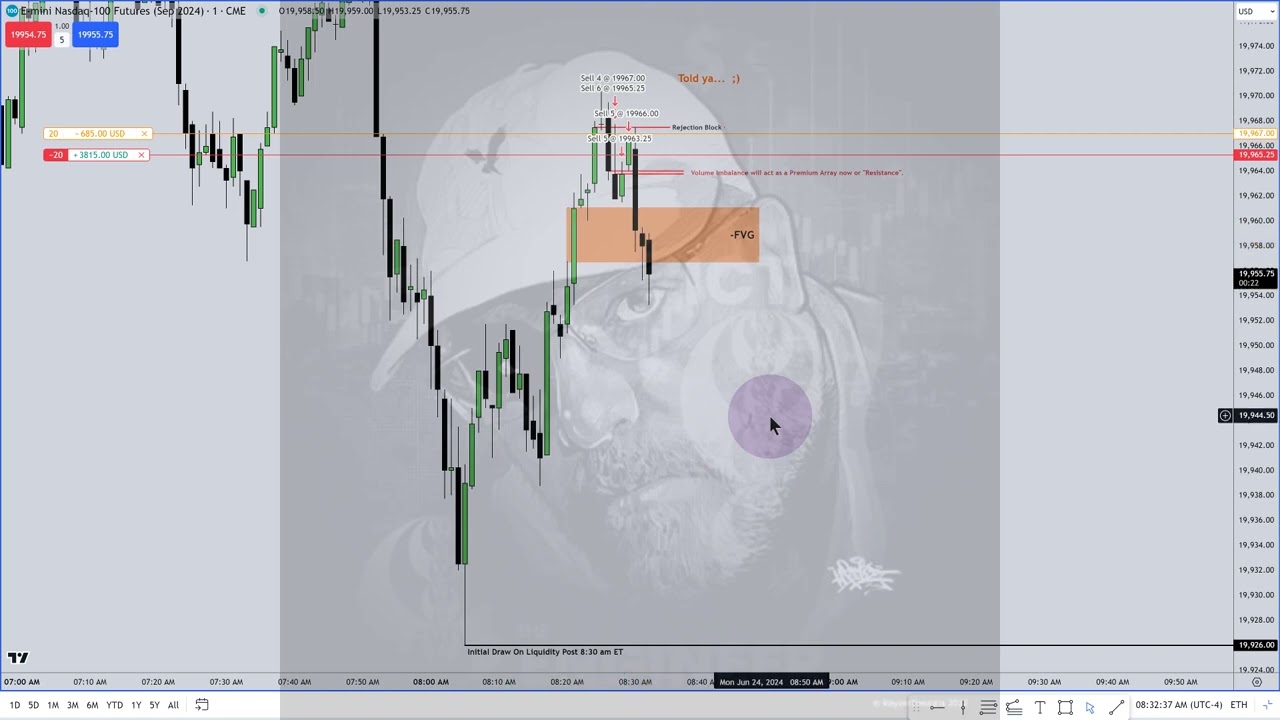
77 this candle's high comes in at 104. 78 so it trades to it just by one pip now watch the difference here we have a down candle here a lot of movement lower but it comes off that low watch what happens now we gap we get from this candles close 104 72 to an opening on this candle of 104 70. now it's only two pips difference but that creates a what a gap so we can be a seller at a more refined price level mentioned and earlier time we said that we could be a seller at 104.
70 on a limit when price trades back up to that level if it doesn't give us an opportunity to go on a limit we can trade it right as it hits it live it can be in front of the charts right there there's your cell now here's the thing look at the body's clothes on this candle right here the close is 104. 72 that's exactly the high on this candles close 104. 72 the wick trades through the body but the bodies of the candle completely close in here so this gap between these two candles these two black down candles this gap in between the bodies have perfectly been filled in with this up candle so this is exactly what i'm referring to as efficiency in terms of the price delivery if this movement lower has been offered on the downside okay now think look closely this candle is high comes in at 104.
78 the close is at 104. 75 the next candle it opens at 104. 76 i'm sorry 104.
74 and then it creates a high at 104. 76 so it moves two pips up so from the opening to the high is buy side liquidity offered then it trades down for a down close then we gap down here there's a gap of buy side liquidity from these two candles from this candle's opening that's exactly where this price goes on the upside from the open to the high the open is 104. 63 the high is 104.
74 which is the opening here 104 74. that's the last point at which the buy side liquidity is offered on the up movement then it's all down from the opening it fills in that perfect delivery of price right there and then at that moment when you see this live you can be a seller at that moment and price does exactly what we mentioned earlier when we're looking at the higher time frame this delivery here price from this candle is low up to the close buy side was offered here and buy side was offered from the opening to the high here so there's a gap closure here on all the downside movement here so this has all been closed in so efficiently we could look for this range being delivered lower we have to consider back here where price was delivered on the buy side here so this low comes in at 104. 55 so if we drop that down to there 104 55 that's where the last point at which the low had traded up to the close so buy side liquidity has been delivered here it's all sell side liquidity at this moment here it's all sell side now nothing over here until we get over here so we created a gap down here price trades up hits it here hits it here we could be a seller at 104.
55 or 104. 50 looking for a move down below 104 15 to 104 10. there's your run right there perfect delivery of price hits it here hits it here look at the high on that candle 104 55.
104. 55 the low on this candle 104 55.