Bitcoin just gave back most of the 10% spike it saw following Donald Trump's announcement for a strategic crypto Reserve this move is coming after Bitcoin fell to a new 3-month low triggering over $1.5 billion in liquidations the sharp breakdown had gotten a lot of people worried in fact the fear and greed index had reached the lowest levels since June of 2022 signaling that sentiment had turned extremely bearish and there were plenty of reasons behind the Fe driven sell-off escalating us tariffs the 4.5 billion Libra rug pull on salana and a massive 1.5 billion crypto exchange
hack all added to the Market's uncertainty these combined factors created a perfect storm pushing investors toward risk-off positions and sparking fears that Bitcoin had reached its peak but now this strategic crypto Reserve news has left many investors wondering whether this is just a dead cat bounce or if Bitcoin still has more upside left well when we look at something called the world uncertainty index it reached the highest levels seen in the past 2 years Panic had clearly been rising and crypto markets were reacting to this increasing uncertainty around the world but this isn't the first
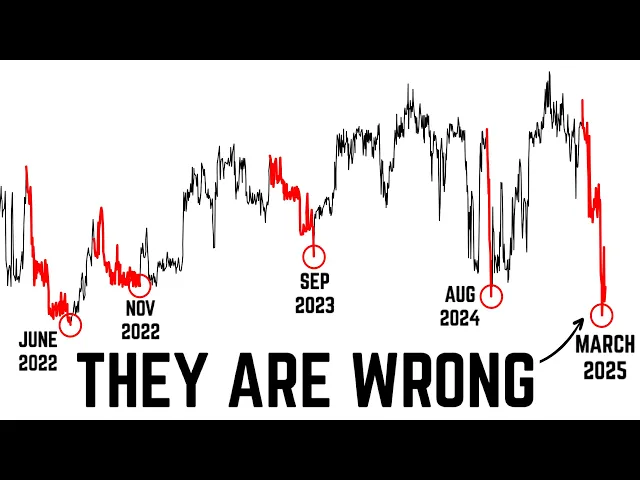
time this index spiked to these levels in the past 10 years there have been five other instances where uncertainty reached this High December 2015 May 2019 March 2020 April 2022 and April 2023 and if we look at what happened to bitcoin we can see a clear pattern four out of five times Bitcoin saw heightened volatility but it didn't mark the bull cycle top instead it led to a multi-month consolidation phase before the uptrend resumed The Only Exception was April 2022 which did Mark a long-term Peak before Bitcoin entered a deep bare market and dropped over
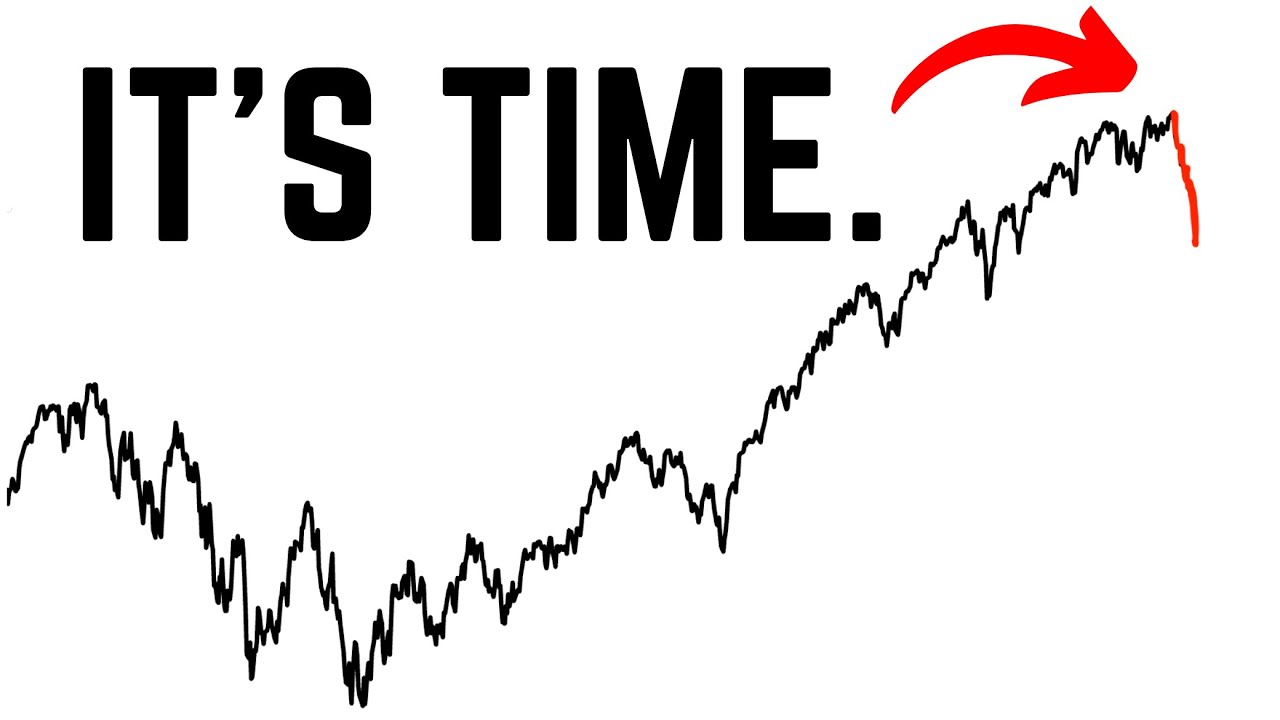
65% So based on history a surge in uncertainty like today has been more likely a signal for consolidation rather than the beginning of a major downtrend and if that's the case what we're seeing today could just be part of another reaccumulation phase perhaps similar to what we already saw in 2024 back then Bitcoin had a strong two-month rally surging 80% with almost no pullbacks but after that it entered a 5-month consolidation from April to August before breaking out to new highs if we compare this to the recent rally we can see that there are actually
quite a few similarities Bitcoin saw another rapid two-month move up again Rising by about 80% with no real pullbacks along the way so we could hypothetically see a similar consolidation period this time around now if we take that same 5-month consolidation structure and copy paste it onto the recent price action we can see that if we follow a similar path then price could remain volatile in the coming months potentially dipping as low as the $73,000 support level which is the same level that Bitcoin initially broke out from in November 2024 this means that Bitcoin could
be going through a phase where the market is digesting the recent rally by allowing buying and selling pressure to balance out but in the last consolidation it was Trump's presidential win that sparked off the November 2024 rally so if Bitcoin starts closing above $100,000 and making higher highs and higher lows than it could be that the Strategic crypto Reserve is the Catalyst for the next big move and that the recent breakdown was just a false breakdown but here's the bigger question why do we think that bitcoin's top has not yet happened well one of the
most historically reliable indicators for signaling Bitcoin cycle tops the pi cycle top indicator has not triggered yet the pi cycle top indicator works by tracking two key moving averages the 111 day moving average or the shorter term moving average and the 350 day moving average multiplied by two or the longer term moving average historically when the shorter-term moving average crosses above the longer term moving average Bitcoin has peaked within about 2 weeks this pattern played out almost perfectly for the past three tops so in 2013 2017 and 2021 each time marking the absolute top before
a major downturn now you might be wondering where do we stand today right now the 111 day moving average is still trading well below this line longer term moving average suggesting that Bitcoin hasn't yet reached the levels of overheating typically seen at Market tops of course some argue that this indicator could lose relevance as Bitcoin matures and becomes more integrated into traditional Finance with the rise of Bitcoin ETFs greater institutional adoption and now the Strategic crypto Reserve Bitcoin Cycles may not follow the same patterns as before but it's not just the P Cycle top indicator
another Keyon chain metric the MVR VZ score also suggests that Bitcoin has not reached the exhaustion levels we typically see at Market tops the mvrv Z score measures how overvalued or undervalued Bitcoin is relative to its fair value it does this by comparing bitcoin's market value to something called the realized value market value is basically the current price of Bitcoin multiplied by all the Bitcoins in circulation similar to a company's market cap it changes constantly based on what people are willing to pay for Bitcoin right now realized value on the other hand looks at the
price of each Bitcoin the last time it was moved between wallets so instead of focusing on today's price it calculates the average price investors actually paid for their Bitcoin the difference between these values is then adjusted using a statistical metric called the zcore which helps identify extreme conditions in the market historically when bitcoin's mvrv Z score enters this upper Red Band it signals that market value has risen too far far above the realized value indicating an overheated Market where price tops typically form this has accurately marked major cycle peaks in 2011 2013 2017 and 2021
each time predicting bitcoin's top within a matter of weeks right now bitcoin's MVR VZ score is elevated but it's still well below the Red Zone suggesting that while Bitcoin has rallied significantly it hasn't yet reached the level of extreme overvaluation that has historically preceded major crashes this means that just like the pi cycle top indicator the MVR VZ score is also signaling that Bitcoin is not yet at its cycle Peak so to us the evidence still suggests that the recent Bitcoin volatility may not be the beginning of a bare Market but rather a healthy period
of consolidation before the next leg higher in fact throughout this bull market since 2023 70% of the time has been spent consolidating with only 30 % of the time seeing explosive moves up we can see that in the past couple of years the average upside move has only lasted about one to two months all the remaining time has been spent in just consolidation so the reality is that patience has been key in this bull market and it continues to remain so from a technical perspective bitcoin's key moving averages the 10050 and 200 day are still
sloping up indicating bullish momentum right now bitco coin has just reached its 200-day moving average but remains in a volatile phase as long as price is between the moving averages this period of choppy sideways action could last for weeks or even months similar to these past consolidations but as we mentioned earlier in this video a move back above $100,000 with higher highs and higher lows would indicate that the recent selloff was nothing more than a false breakdown trapping late shorts and setting the stage for higher price of course if Bitcoin loses these key moving averages
and the moving averages start curling downward just like they did back here in April 2022 then we'd be having a very different conversation that type of a technical breakdown would be a clear warning sign of a larger Trend shift but for now the longer term bullish structure remains intact keeping us constructive on bitcoin