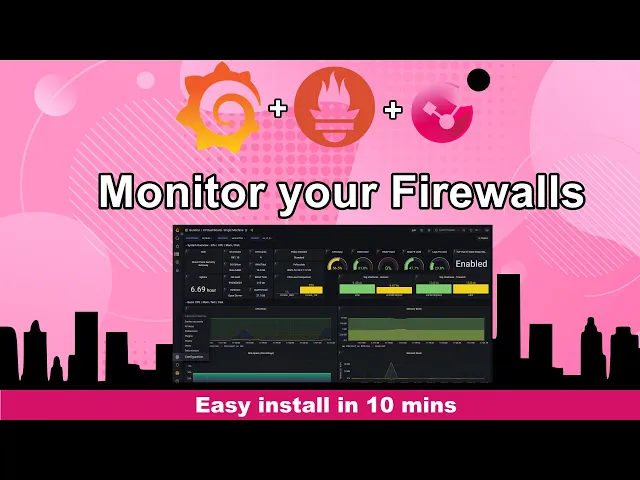
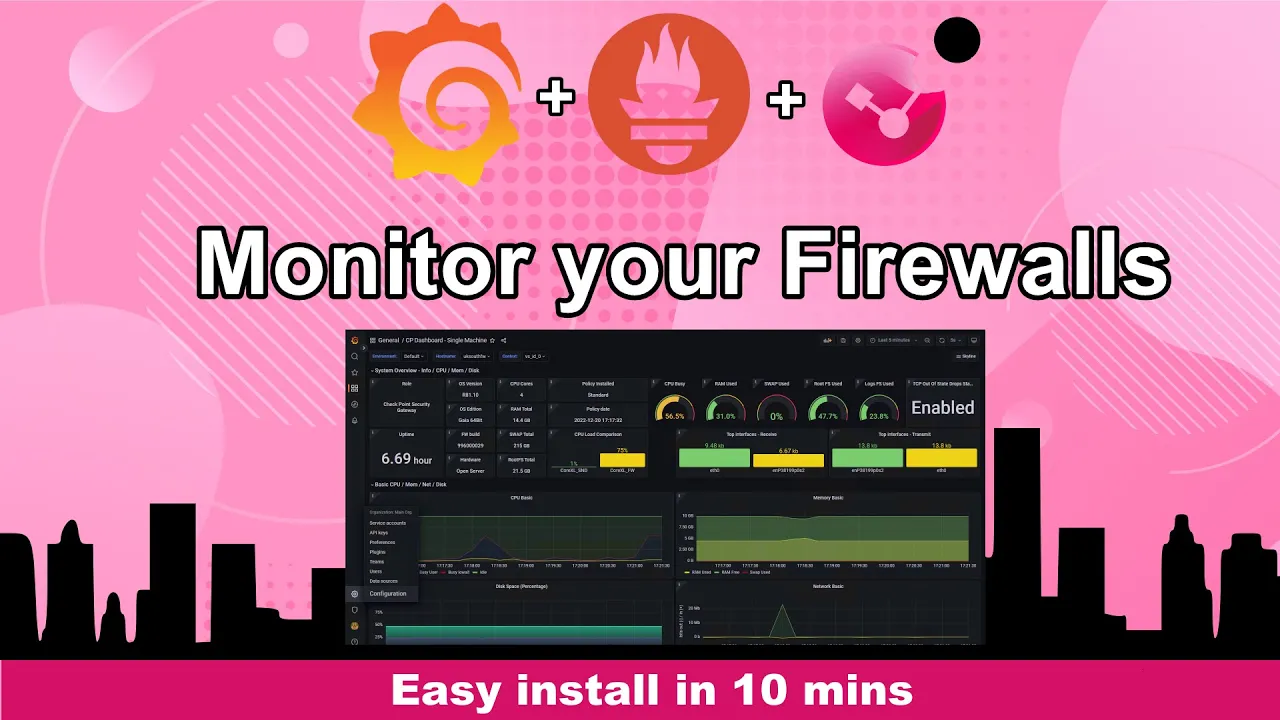
foreign [Music] here we have a standard checkpoint management station and firewall policies are pushed from the management station and received from the firewall these logs however only provide information about the network connections the firewall is processed no information about the state of the firewall itself so we're going to build a Ubuntu Server install Prometheus and grafana we then will take the data from checkpoint CP view which provides health information about the firewall and send that information to the Prometheus database the grafana data visualization tool will convert this into a graphical web interface giving us graphs and other statistics about the Box all of the commands for this video will be made available in this instructions file on my GitHub page link will be in the description [Music] once your Linux server is up and running run the following commands sudo app get update and sudo apt-get upgrade this will update your Linux repositories and any software you have running once that's completed we're going to paste the command wget and then the URL for the Prometheus software this will then be downloaded onto your system and we'll go through the processes to install this now these commands can be copied over from the GitHub page they will add a certain level of permissions create certain directories but ultimately these are the simple steps that are needed to install grafana again all the instructions are going to be in this file which is on my GitHub page Link in the description [Music] once all those commands have been copied across we'll be able to launch the Prometheus service it is now ready to receive logs from an external source which will ultimately be a firewall now head over to your browser type in the IP address of your Prometheus server with the port 9090. if everything is running correctly the web interface for the Prometheus service will be shown here unfortunately with this method the Prometheus service will not start on boot so we need to make a few changes to ensure that it can survive a reboot so we're going to use the touch command to create a file called prometheus. service and then we're going to use the vi command to edit that file and paste the contents from the instructions page now if you're not sure the version of Prometheus that you're running you can just run a list on the Prometheus directory and then you can spot there the version of installer that you have in place now a second file that needs to be modified is the Prometheus dot yaml file so locate the yaml file and to the bottom of it add the following instructions this will enable that remote right receiver ensuring that the Prometheus server can receive logs from an external Source now we're going to use the system CTL commands to reload that particular service the Daemon that's running we're then going to start the Prometheus service and we're going to use the status command to check to make sure everything's running now we use the final command which is systemctl enable Prometheus and that will ensure that the system can survive a reboot so we quickly reboot that system and we run that status command again on the Prometheus service and we can see that after the reboot the Prometheus service is running in the background one last check we'll head back over to the Windows machine refresh that page and again great we can see the web interface is up and available now over to the grafana configuration again we use the wget command to download a copy of the grafana installation and we can copy and paste those commands from the instruction file to ensure we set everything up now I ran into this particular problem where I tried to install the grafana Debian file and I ran into this error so if you get this it's not necessary if it runs perfectly for you continue if not run the command here which is sudo apt fix broken install and that seems to fix the Linux repositories and once you run the installation command again everything should work perfectly not entirely necessarily for everyone but maybe a problem you may run into now that's running we're going to set up the grafana service to be installed as a service again so this will survive a reboot head back over to the browser and this time using the port 3000 if everything is working correctly you will get the grafana interface the username and password is admin admin and it will request afterwards that you change the password so we quickly just do that and we have our grafana server up and running the next thing we need to do is head over to the checkpoint knowledge base article and download a copy of the grafana dashboards these will be uploaded into the grafana interface and will ensure that we have a pre-configured and a pre-designed interface to represent and display all of the data from the checkpoint firewalls once downloaded uncompress the files and there are a number of different options available today we're just going to do the single machine now before we import the dashboards we need to go over to our data sources and we need to point the grafana server towards the Prometheus server now this has automatically picked this particular data source up because both grafana and Prometheus are installed on the same Linux server however if they were installed on different servers instead of the local loopback adapter here you would place the IP address of your remote Prometheus server click save and test and if everything is configured correctly you'll get a little green tick once that's done we're able to head back to our dashboard go over to dashboards click new import and we're going to upload that Json file that we extracted earlier we're going to start with single machine then under Prometheus select the data source we just edited and click import and then we see all of our pre-configured dashboards ready to receive data from a checkpoint firewall at the point of recording this in December 2022 the only supported version is r81.
10 with the hotfix take 79. the base build of r81. 20 does not support this integration future support will come in later hot fixes so head over to your firewall and log in with expert mode create a file using the touch command called payload no tls.