we're closing in as we said 100 when does that happen sir Bitcoin is on the cusp of breaking out breaking above $100,000 per coin for the first time in history some people are asking the question am I too late am I too late to buy or is this rally just getting started well let's look at the onchain data and see exactly where we are in the cycle seriously watch today's whole video because there's one chart that truly does predict where crypto's headed next and let's just remember the paradigm shift that just happened what I think
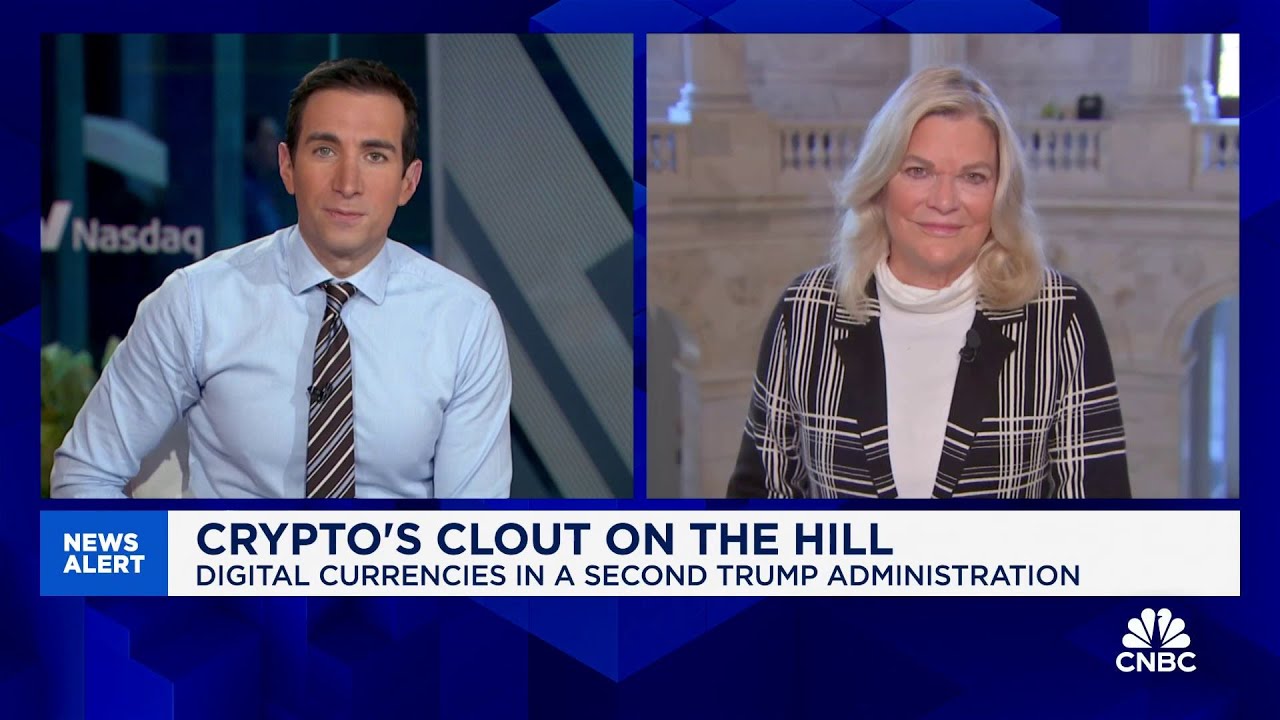
listeners have to understand is When Donald Trump uh got elected uh there was a paradigm change and we have a hard time trading Paradigm changes what what I mean by that is four years with a really harsh uh Regulatory and political climate for people in this industry and now open wide open the entire cabinet almost owns Bitcoin and as proponents of digital assets I mean Kennedy said his whole net worth is in Bitcoin so the people around that table are very Pro this space they're Pro Innovation they're Pro digital assets they're Pro Bitcoin and I
think the rest of the world has to take notice and we're seeing it we're seeing with buying from the mid East and while Trump's pick for US Treasury secretary is a big Bitcoin believer he actually just spoke at the Bitcoin conference if we do end up hearing that Senator Bill Hagerty ends up being a treasury pick and he's called called Bitcoin bill I mean do you imagine that would be next another Catalyst and could that push us beyond that 100,000 also Trump's Secretary of Commerce Howard lutnick huge Bitcoin accumulator he's actively buying I have hundreds
of millions of dollars okay okay hundreds and hundreds of millions of dollars uh exposure to bitcoin but in breaking news as of this morning SEC chair Gary gensor will step down he is departing from the agency on January 20th which is a huge weight lifted off the crypto industry we can now have clear regulation and not just regulation by enforcement without knowing the rules in a direct quote from Gary Gensler he said the Securities and Exchange Commission today announced that its 33rd chair Gary Gensler will step down from the commission effec of 12:00 p.m. January
20th 2025 I thank President Biden for entrusting me with this incredible responsibility so the Trump pump and more importantly a new regime has begun as a Trader though if you're just trying to trade this as you know so well it is there are times when it blows through whatever you think the target is and 100 you're saying yeah maybe it blows through that there's also been these sort of remarkable retrenchments where you know it retrace is 50% so what's next for Bitcoin and the beauty of Bitcoin because it's on 100% public blockchain we have onchain
data that the elites crypto Elites are starting to use most average people don't look at these charts they really should if you're invested in Bitcoin and the pel multiple first chart of three I really like because it gives us insight into what the Bitcoin miners are doing and the Bitcoin miners who have a history long history with Bitcoin do usually tend to have their finger on the pulse of where we are in the market what the P multiple does is it tracks the current minor income in US Dollars which is generally how all power and
capex is covered by Miners And it Compares it to the yearly average of income so in layman's terms are the Bitcoin miners holding because they think prices are going higher or are they selling because they think prices are sort of toppy the puel multiple is calculated by dividing the daily issuance value of Bitcoin that are mined into existence every day by the 365 day moving average of daily issuance value this allows us to start to see the trends and what this provides is an indication of when we have a high degree of profitability relative to
that yearly base line which can then create an incentive to sell or in periods when we have very poor profitability suggesting that there is some form of income stress and potential minor capitulation that can then change the overall hash shares it's distributed across the network and how I like to use this chart and by the way hit the like button if you appreciate this Alpha but I use this chart by looking for extremes for example if we're getting a high extreme that means the miners are more incentivized to sell if we're looking at very high
values of the pure multiple it's suggesting that the current daily income is much higher than their yearly average and that very high profitability is creating an incentive to sell which can then create an increase in the overall liquid Supply as miners liquidate parts of their treasury in order to take advantage of that market strength or of course if we're seeing a very low value that means the miners have very low incentive to sell and conversely very low values of the peal multiple suggest that the current daily income is substantially less than the yearly average and
that generally suggest that there's a capitulation event in play and at the end of large mining Cycles we can have a shift in the overall share of hash rate where weaker miners have to drop off the network turning off their machines stronger miners gain a larger share of the hash Network and therefore they can actually sell fewer coins in order to cover the same Fiat expenses so what's next for Bitcoin where is the P multiple today and we're really right in the middle of the cycle buying Bitcoin today in terms of how profitable are the
miners and are they incentivized to sell buying Bitcoin at today's po multiple value is like buying Bitcoin right here look for that dot above like right here look at that top dot last cycle or like buying Bitcoin for looking back in 2017 like right here in the 2017 Bull Run so Bitcoin miners do sell some every day typically but they also do hold a lot every day typically and looking at the long history of how miners have reacted we are nowhere close to the end of this Bitcoin bull run you know normally you hit 100
you bounce off of it I would not be surprised if you know we go much higher we're in price Discovery there's not a lot of Supply there had been a giant seller for the last week between 92 93 and 94 probably 14 15 billion dollars of Bitcoin sold there I know because we saw the buying uh not us personally but the the US market now of course it's not just about one metric one chart it's about reading multiple charts pulling from multiple data sources so I can make the best decision for me as a crypto
investor I really want to recommend you subscribe to altcoin daily because we drop one video per day keeping you informed it's really just one video per day and over time you can start to become an expert in this stuff so the next chart I want to show you is the Bitcoin MV RV zcore it sounds complicated just stay with me and actually to get to this we we first have to understand Bitcoin realized price because we know bitcoin's regular price bitcoin's regular price is just whatever the coin market cap says you know the regular price
now just under 100K but bitcoin's realized price slightly different many people say it may be a more accurate way to Value the network and bitcoin's realized price is the average price of the Bitcoin Supply valued at the day each coin last transacted on chain so what this is assumes is once you buy your Bitcoin you put it in storage you hold and the only next reason you would move that Bitcoin again an onchain transaction is if you want to sell Why move your Bitcoin unless you want to buy or sell so this is the average
of that realized price of the last time all Bitcoin in Supply did that today's average price is closer to 35 probably now probably pushing $45,000 today to me this says if the worst should happen and the bare Market started today we typically won't go under or won't spend a lot of time under that realized price and actually what I think we'll see because I don't think we're going into a bare Market but I think we'll see in the bull markets that realized price gets brought up to a more fair value but anyway understanding realized price
let's move on to a really interesting chart Bitcoin MV RV zcore the mvrv zcore evaluat whether BTC is overvalued or undervalued relative to its fair value so this uniquely compares the regular market value of Bitcoin to the realized value meaning this is comparing the two charting it over time and it's been a pretty clear indicator of when bitcoin's near a top so the way to think about this and and for any of you who've been uh kind of absorbing our video content or our webinars in the past you'll know that I love to bring in
the layer of um human psychology so if the mvrv ratio is basically charting out current price which is market value spot price market cap divided by realized price which we often consider to be the acquisition price so the current value divided by the acquisition value that will give you a profit multiple when it's above one it's going to give you a we are in profit when it's below one it's going to give you we are in loss on average and the psychological concept here is that at some point in time everybody sees a green enough
number in their portfolio that they feel motivated to sell and likewise at the very very bottom of bare markets there's only so much pain that the human can take um and when we look at our financial portfolio and it's just red red red um at some point in time that elicits the same response of people flushing out their coins so that's why it tends to work on these extremes we're looking at points in time when people become exceedingly likely to distribute their coins and that generally triggers some kind of cycle change and what does this
chart tell us today again we're right in the middle of the cycle the time to buy was back in 2022 end of 2022 clear buy Zone by the way altcoin daily was sharing that with you Wales quietly buying Bitcoin ethereum to explode after merge in September ethereum's price was around $11,200 back then again you can go back on some of our old videos 2 years ago you are being lied to about cryptocurrency in 2022 the bitcoin's realized price is at what level each coin actually trade at hands but just know many people use realized price
as sort of a more accurate way to determine the value of the underlying Bitcoin Network we were sharing with you why this does have value when the elites back then even Larry thinkink of Black Rock was saying no bitcoin's nothing but essentially what this is telling me is we're not close to a bottom we're not close to a top but let's start to check back in on all these metrics every every 4ish four six weeks and keep tabs on these so subscribers of this channel are the most prepared and for all you trading on Marx
who opened up their long positions when we talked about it in my video from two days ago Black Rock to send Bitcoin over 100k in the next 7 days you're looking good anybody who set their Longs clearly in Profit just remember Market could literally do anything so set the stop losses take some profit but many Traders are making money in this bull run I'll put some links down below check it out and like always see you tomorrow