welcome to part 6 of this training series in this section we will introduce you to the technical aspects of doing causal loop diagrams to do a basic causal diagram you need to be familiar with at least these five key concepts stock variables flow variables link polarities positive and negative feedback loops bouncing and reinforcing and time delays this video is intended to introduce you to the concepts and in the next video we'll reinforce these concepts using the modeling of the case study so don't worry if you don't fully understand all the terminology by the end of
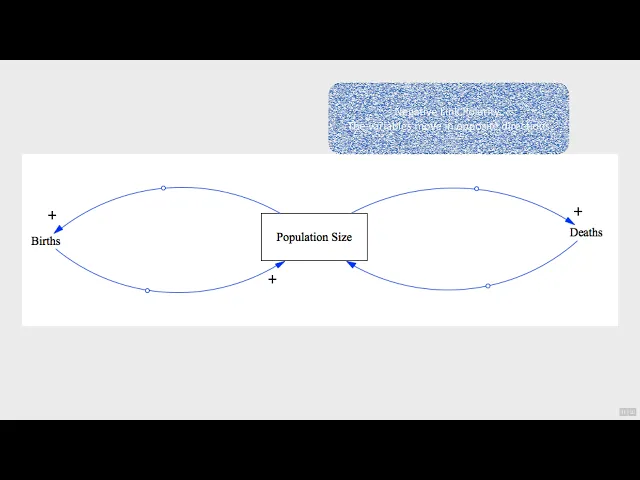
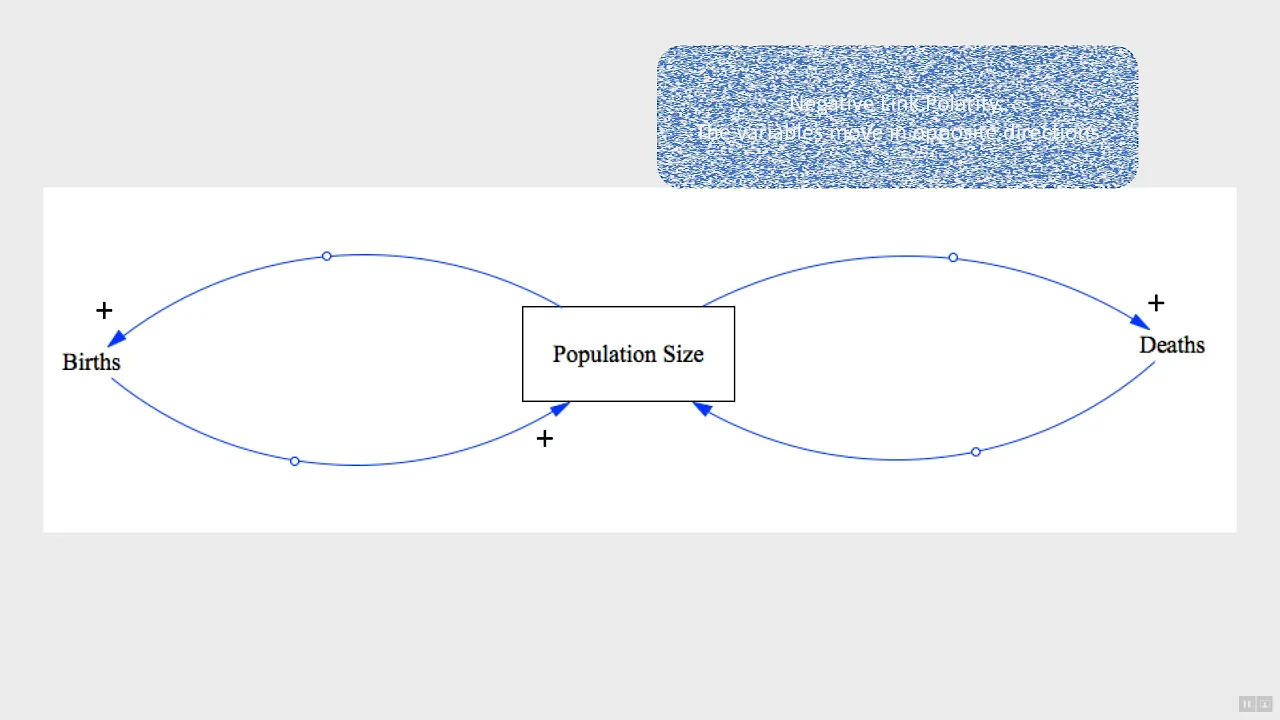
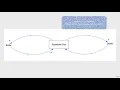
this video to better understand what these are i'm going to work through a simple model that was provided to the participants during the workshop prior to doing the actual modeling activity the problem of interest was population size there are two main variables that influence population size births and deaths so my three variables in the model will be population size births and deaths a stock variable is something that can accumulate over time in this case our stock variable is population size we'll put this variable in a box which indicates it's a stock variable populations can get
bigger and accumulate over time in contrast births and deaths do not accumulate over time rather they are the variables that the change flows through so we call them flow variable variables the link polarities represent the causal relationship between the variables or another way of looking at them is that they're if then statements thinking back to the connection circle activity we can ask ourselves which variables have a causal relationship meaning changes in one variable causes changes in another variable population size affects birth the bigger the population size the more births that are likely to occur so
an if then statement would be if the population size increases then the births increase an arrow from population size to births denotes a causal relationship now we have to add the polarity sign which is either a plus for positive or a minus for negative if a cause relationship is positive it means both variables move in the same direction if the cause goes up then the effect goes up and if the cause goes down then the effect goes down whereas in a negative polarity the variables move inversely if the cause goes up then the effect goes
down and if the cause goes down then the effect goes up in this first causal relationship if the population size increases then the number of births will also increase and if the population size were to decrease then the burst will also decrease this is a positive relationship because both variables are moving in the same direction we put a plus sign by the arrowhead to denote it's a positive link there's also a causal relationship in the other direction as the number of births increase the population size also increases this is also a positive causal link now
how does population size and death affect each other well as population size increases the number of deaths will also increase this again is a positive link however as a number of deaths increase the population size will decrease these two variables move in opposite directions making it a negative causal link we use a minus sign to denote a negative link when the causal links create a closed loop or a closed circle like we have on both sides of population size we call this a feedback loop the change starts at population size and comes back to population
size again if the links around the circle end up amplifying the starting variable then it's a reinforcing feedback loop we put an r to denote a reinforcing feedback loop if the if the loop balances the starting variable that it's called a balancing feedback loop and we put a b in the middle in this example the birth loop increases population size so it's a reinforcing loop whereas the death balance is the population size making it a balancing feedback loop the last component is time delays sometimes the causal relationship takes time to have an effect for example
the increase in births doesn't happen immediately from an increase in the population size it takes years for babies to grow into adults and begin having babies of their own so we can put a time delay symbol on this link same thing for population size and deaths it takes time for the babies to grow and affect the death rate so we can put a delay symbol on this link as well and those are the basic components needed to create a causal loop diagram let's recap the components one more time for you stock variables can accumulate over
time such as population size flow variables such as births and deaths do not accumulate over time but change flows through them link polarities represent the causal influence between variables if the cause and effect variables move in the same direction such as the effect of births of population size then it's a positive link denoted with a plus sign but if the cause and effect variables move in the opposite direction such as the effect of deaths on population size then it's a negative relationship denoted with the minus sign when this close when there's a closed circle we
call it a feedback loop feedback loops are denoted with an r for reinforcing if the initial condition is amplified and if the initial condition is balanced it's denoted with a b lastly if there is a delay in the cause and effect relationship then the link polarity has a time delay sign added to it and there you have the main components of a causal loop diagram in our next video we will be representing the call slip diagram that was created during the modeling session of the case study