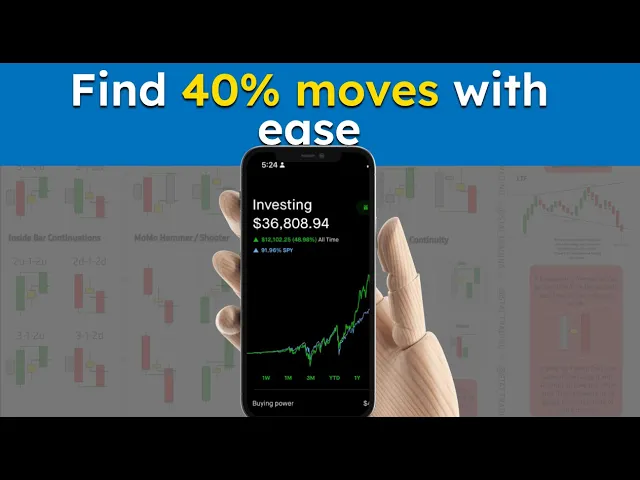
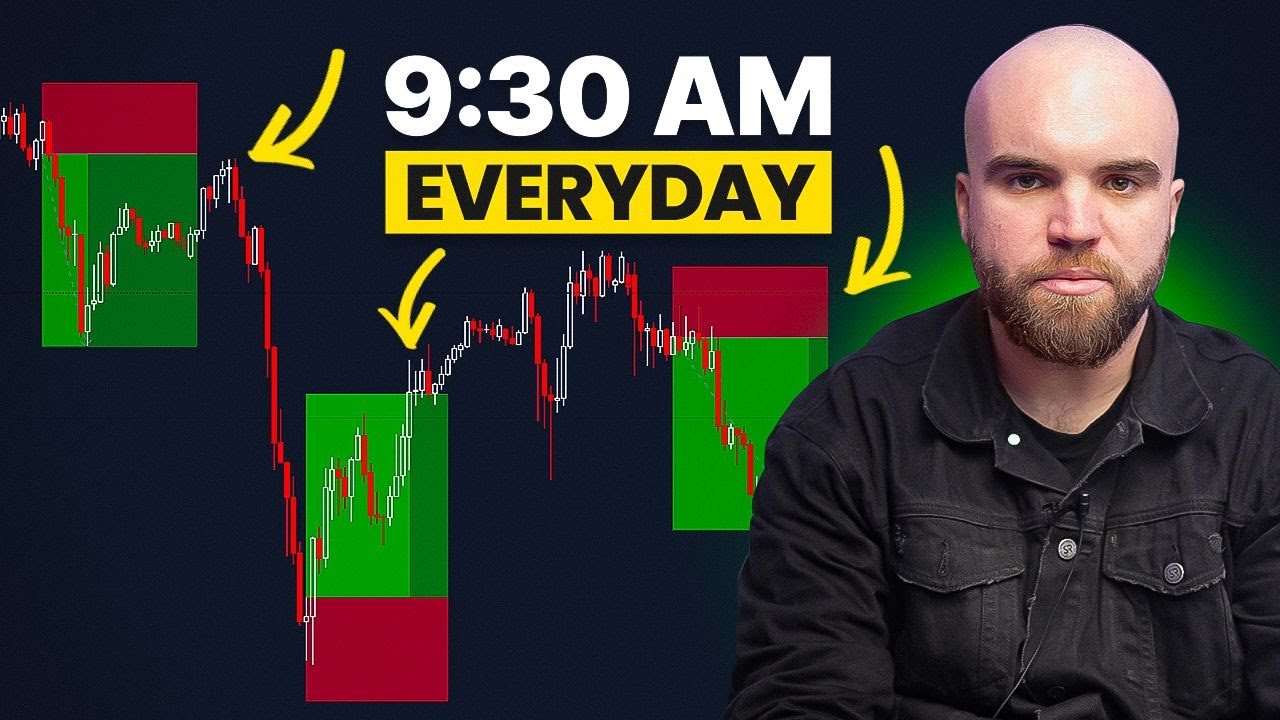
every Trader wants to find the stocks that go 10 20 30% in a week or even a couple weeks the Strat attack universe is something we use in order to find those momentum stocks that will keep going so I'm going to teach you the Strat attack and then I'm going to teach you the entry techniques that can be used to get in and create winning positions and if you're interested in that stick around my name is Alex and this is the Strat [Music] so the first thing you want to understand about the Strat if you're new is that we must trade back through a previous range you're not back through previous range we don't know if it's going to keep going what this means is we want to look for charts where we make new lows and then reclaim the lows and then go back through the range so what it may look like is something like this or price has a range and then we make the new lows and you'll notice we reclaim these lows here and then we reverse coming back through allowing us to gauge magnitude and say we're going to the other side to stop out anyone that's short in here so very very simple and this works both up and down so you can see the reclaim of these highs to Target these lows so we start the Strat attack on a higher time frame chart meaning on a monthly a quarterly or a yearly chart for the most part we're sticking to the month we'll also add the weekly stuff in there for the Traders at stat trading that being said what we look for is very simple we want signals back through a previous range so those signals may look like a 2 two reversal we're going to see we have a two down in here and that's a lower high and a lower low to this Bar's range that's a two down followed by a two up or makes a new high to this bar and a higher low that's a reversal two down two up reversal above this then we manage our risk on whatever time frame we trading to the low of the bar we enter on or you can use the midpoint of this Whip and we let this thing go back through the previous range we can also look for two one tws so you can see two down one two up reversal so this is our inside bar and then right above this that's your 212 reversal and these are going to be the two most common reversals you will see the other thing we can do is we can look for continuations so for example we can have three which is a new high and a new low to this previous bars range and we can look at 4 32 continuations below the lows of this three and these are some of the most common things we will be trading on the Strat attack universe and then the most important part back through a previous range we're taking people out of long or short positions if we're trading up or down so very important we start at the big time frames and look for that so what the Strat attack is trying to do is identify algorithmic trading buying or selling and because of this we need to pick up on them how do we do it we do this by looking for two directional bars cars so two up two up or two down two down to start the trading week what this means is if we have let's say we have that monthly chart we have this signal where we have the month signal and then it starts breaking in here on Monday and Tuesday during the week we want to look for a two up two up so the the daily chart might look something like this if we have that monthly 2 two reversal and let's say here they buy it Monday two to the upside it's the first one then Tuesday they come back to buy more this is what puts it on the Strat attack so we scan for two up two up and then we look at those monthly and weekly charts and quarterly charts and say do we have signals in force and if we do we can expect that this is going to keep going the rest of the week Wednesday Thursday and Friday and the reason this is is because if you have a trade desk let's say your Goldman Sachs you may have people that come and say hey uh we did all this analysis we think we should invest in this stock called locky Martin we need to buy $100 million shares so what's that going to look like when they open on Monday and they start buying those shares well they're going to buy it on Monday right and then they're going to come back and buy more on Tuesday so what this tells us is hey they got more to buy right and since we know they fill these really large positions and that's what causes the market to move it's aggressive buying or selling we can pick up on it via the Strat attack directional bars to start the Monday and Tuesday trading week so hopefully that makes sense now as that week goes on there's a few different ways we can enter these positions on the daily chart we have a few entries that we can do so for example let's say this is Monday's trading this is Tuesday's trading two up two up to start the week and we got monthly signals let's say we're breaking last month's highs here what we can do is we can look for the gap down buy so they close trading up in the highs here and then it gaps down and then starts going again this is what we call the Gap down buy and we say Gap Downs are made for buying gaps up are made for selling because of this reason where if they're buying Monday Tuesday they're really aggressively buying they want the stock so when it gaps down it's actually in a discount they're like hey we can get even more at like $100 even though it was trading 105 yesterday at the close so we're going to buy even more aggressively and then it will go flying right so this is one of the ways we can do it just on a daily chart you can also look for gap down buys where maybe it looks like this they take the previous day lows reclaim it then take out both sides this is where you get the outside bar the low they reclaim it during the trading we can buy that and then we can Target the other highs so two ways in on the daily chart very simple the last way the Third Way is looking for momentum so if Monday and Tuesday we're just going to get it over here so if Monday trades up and Tuesday trades up what will normally form on Wednesday Thursday and sometimes on Tuesday is a momentum Hammer so a momentum Hammer is where they maybe Gap up and then create this Hammer signal this would be on Wednesday's trading so when we see this this is another way in on a daily chart we can just buy it above that high and expect it to go right away meaning we can have a tight stop either at the bars open that triggers this right here or we can do it like the 50% of that wig really simple and then we can expect it to keep going on Thursday Friday or Wednesday Thursday Friday if this occurred on Tuesday so hopefully that makes sense so momentum hammers we can look for we can also look for momentum Shooters which are going to be very similar just in the opposite direction so three ways in just on a daily time frame the next thing we can look for is actionable signals to confirm the direction after stopping people out on Lower time frames so if we have the Strat attack we know we're going after it let's say this is Mondays and Tuesday's trading on a 60-minute chart I'm just going to draw out some random candles here just so we have that here what we can look for is for example let's say th Wednesday opens and trades lower to start we can look for the triangle out where they stop guys out and then start reclaiming back back through the previous range then we can look for the 22 reversal to gain an entry sometimes you will also have 212 reversals or maybe we have the same exact thing except it goes 2 one and then we can look for the two back to the upside managing risk to the low of the bar we enter on or you could use the 50% of the bar that you use to trigger and then we look to Target the other side of the range because this is a broadening information we're stopping people out and going back through the previous range that's what a winning trade looks like if we do this on the Strat attack we expect it to keep going so we create winning positions and then we can put our stops where we had gotten in down at our entry price and let it go until Friday because if it's a monthly signal we got all month if it's a weekly signal we got all week quarterly signal we get all quarter so we want to go for the biggest signals and create winning positions the next thing I want to do is go and show you the charts to add this all together and show you some real world examples of things we have talked about so let's get started first one I want to show you occurred on AI the justce past trading week so what we'll see is on the month that's your 22 reversal back through previous range that's what a long position looks like so we like that if we go to the week you'll see on the weekly basis we have the hammer week so we want to be trading it this week and this month is we know if it breaks 2447 we can go after it all month and all week and then on the daily how did it show up on the Strat attack well you'll see they bought it Monday and Tuesday we also have the momentum some Hammer little bit for on Monday which we'll talk about towards the end of this video how we can actually use this when we already know the analysis that we're looking to trade but you'll see Monday and Tuesday this puts it on the Strat attack so we scan for these two bars and then we look at the week and month and we're like yep that looks good the month yep that looks good so come Wednesday Thursday Friday we want to use the entry techniques to gain entry into this stock one of the ways we can do that is the 4 Hour so if you have a job and you don't have enough time to sit at the charts all day you can scan and look at the 4our on the Strat attack list so on Tuesdays at the close Tuesday's trading they closed an inside 4our continuation signal we can buy that right at the open risking the low of this bar or the midpoint of this bar of the inside bar here and let that go all week you'll also see the 22 4our signal where we stop people out and then keep going in Thursday and Friday's trading so there's two ways in just for people who don't have enough time to sit at the charts if we then drop to the 60 you'll see the example of the gap down bu that confirms the Strat attack where you can see we gap down we stop people out and then when this goes green on the day we can go after it right there in this case we have a two2 reversal signal so we can manage our risk either to the low of this bar we enter on or the midpoint of this Wick that created itself on the hammer and then we can let that go the rest of the week and you'll see the same thing happen here the 22 signal which causes us to take out Wednesday's highs and then it keeps going all the way through Friday because of that algorithmic buying it's definitely occurring right this is what that looks like buy take the offer and they just keep doing it so this is awesome the next example I want to show you is sector specific so if we go to k web which is the China sector this is one we put on the Strat attack on September 25th so you're going to see Tuesday September 25th they were two up two up to start the week when we go to the monthly chart what you'll notice is we have a 22 reversal month back through previous range so where are we going to make the new highs here so we already know our analysis it's super simple then and we go to the day we had the gap down Buy on Wednesday to buy it and then Thursday Friday they follow through and then it did not reverse until right in here on Thursday with the two to the downside the first reversal to the downside here so you can see even just buying the gap down in here you get 27. 75% you close it at the open you get 25% this is why the Strat attack so good it's so simp simple so that being said since this is a sector we can go and look at the sector Holdings and if you look at the Strat Attack video we put out on September 24th you're actually going to go and see us talking about all these one of them was futu so you'll see futu here it has the hammer month it was on the Strat attack with the sector and it's also been a lot higher so you can see back through previous range on the month this actually matters right it used to be trading at 204 maybe it keeps going right so when we go to the month we already know that and we have a initial Target to go to 8186 so when we drop to the week it's just continuation but it's confirming that monthly signal for us we go to the day you will see it trades inside in green on Monday so they did buy it they just weren't that aggressive and Tuesday it goes to up again so it's on the Strat attack with all the China stocks in the kweb sector Wednesday is the gap down buy so on the daily chart you can go and buy this right above 7363 risking the daily open here so with a 1. 14 % or 1.
5% of risk you can go after it and you'll notice the first reversal on this did not occur until the gap down here at 42% gain with a high of 77% which is just crazy so amazing stuff I want to show you then if we go to the day here last one you'll see the momentum Hammer this is where you can add to your position and buy more and so you get more entries there's also the inside day in here which would have came back in and stopped you out and got you out of the whole position if if we go to the 15minute what we'll see is when that gap down by occurred in here we had the 2 two reversal on the 15 which caused us to reclaim all these previous lows in here so when it reclaims where's it going up here right it's that simple pattern of you have a previous range you get stuck inside of it and then you reclaim and go back through to take the other side out so we can take that 15 signal ideally we don't risk all the way down here that's a lot right we'd want to risk maybe the open of the day at the worst if anything we want to just risk like 40 50 cents something small because risking $147 doesn't make sense if they're going to buy and take the offer it should pretty much just go right away and it did in the morning this is one of the strongest ones we traded we also saw Baba do this exact same thing so if you go to Baba you'll see Monday and Tuesday they bought it and it's on the China stock list so you already know all the analysis is correct there we go to the 15 you can see in here there's the 2215 there was also the reclaim right here at 9441 so you could have bought it here with the stop here right at the open the 2215 occurred at worst there was you can see 09 and 0. 12% of draw down which is literally nothing so you can still be in there with your stop either the daily open or you know 50% like 40 50 cents of risk and then you can let that keep going the rest of the week and you'll see throughout the week we have some examples of the triangle they out so this occurred on Monday the next week you can see they made the new high the new low to these previous lows and then the reclaim in here to go after it again so this is going to occur over and over and you can even see in here the slight lower low the reclaim two two reversals in here the two two reversal in here back through a previous range and then continuation and then up they go so this is happening over and over it's a matter of finding that winning position and getting in I want to show you one last thing here on the 4 Hour you're going to see on the 4 Hour the gap down High just above this low it's one way in and then the 322 reversal for hour in here to buy more and there's also the 212 in here which was a gap up so we could not trade that but you have the 322 and the gap down bu in here to gain entries into this so really really simple analysis now the last thing I want to tell you is when you have stocks on your list so if you're doing weekend analysis you can use the Strat attack as a way of understanding how much evidence you have for your trade so since AI was on the weekend video we already know we want to see them buy it Monday and Tuesday so if we go in Monday and they go two up we can just enter the position and our stop loss can be a reversal against that so we can buy it in here two up on the day when it takes the previous day's highs out and put our stop here and then when they come back Tuesday slight gap down by we can go after that too and then when it takes us High we can also go after that just adding to the winning position because now it's on the Strat attack we have a lot of evidence it should keep going once it triggers the weak which occurred above this you can also add it to it there when it triggers the month above $24. 75 we can buy it there as well when the gap down buy occurs we already showed how you can buy that and then it continue so we can use the evidence to buy small positions Monday add to positions Tuesday and let them go the rest of the week the ones that do not reverse will be the winners and with the Strat this the last concept I want to give you guys the market tells you which stocks are winning you do not tell the market you can have the best analysis in the world it can be perfect you know exactly what you're looking for and if it doesn't go up Monday and Tuesday let's say it goes up Monday reverses Tuesday and then they fail to come back Wednesday and buy any of it and it just keeps going it's not a winning trade right you want to see them go Monday buy again Tuesday buy again Wednesday and just keep doing it the best winning positions are going to start Monday and Tuesday going up and then follow through the rest of the week so that's the last thing I have for you guys if you enjoyed this video please drop a like it's a little different than what we've done previously if there's any other questions you have feel free to drop them in the comments I can make a part two to this and answer all of those questions for you and if you're now wondering how do I get the stratus Haack out you can check out app.
Strat alerts. com and at app. at alerts.